It’s Finally Over
Let’s never do that again.
Thanks for reading!
SQL Server Consulting, Education, and Training
Let’s never do that again.
Thanks for reading!
I try to set aside money to use on hardware every year, and this year I chose to grab a powerhouse laptop.
The desktop that I built a few years back was starting to feel a little bit creaky. It was easier to buy a better video card and convert it into a gaming rig than try to update various pieces to modernize it.
I’ve long been a fan of ThinkPads, especially the P series of workstations. I’ve got a P51 right now, which I use for general stuff. It’s a powerful laptop, and it was great to travel with and still be able to write and run demos on. Where things get a little trickier is recording/streaming content. If I run any extra spicy demos on here, it impacts everything. Recording and streaming software has to share.
When I had to do that stuff, I used my desktop for demos. This new laptop serves two purposes: it’s a backup in case anything happens to my main laptop, and it’s where I can safely build demos. And hey, maybe someday It’ll be my main laptop, and I’ll have an even crazier laptop for demos.
While watching the Lenovo site for sales, one came along that I couldn’t say no to. I ended up getting about $8500 worth of computer for a shade under $5000.
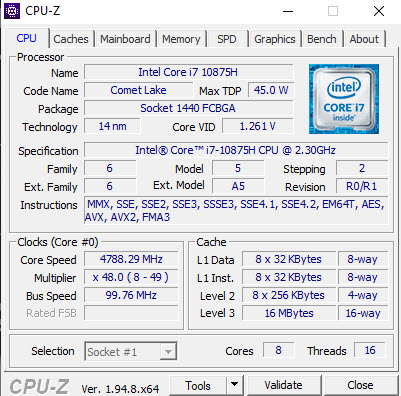
What’s under the hood?
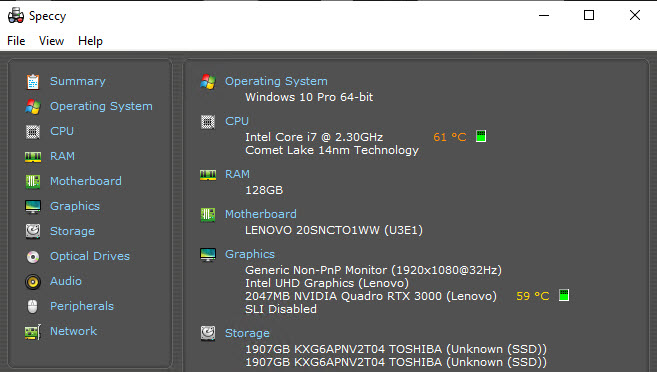
Yes, that is a laptop with 128GB of RAM, and a decent enough graphics card to process video if need be.
As far as benchmarks go, this thing is plenty speedy.
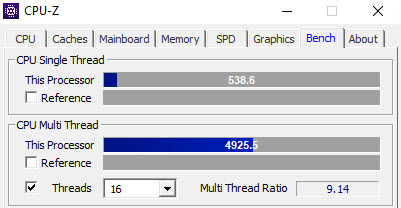
This is great for a laptop. No complaints here.
The storage is also pretty sweet.
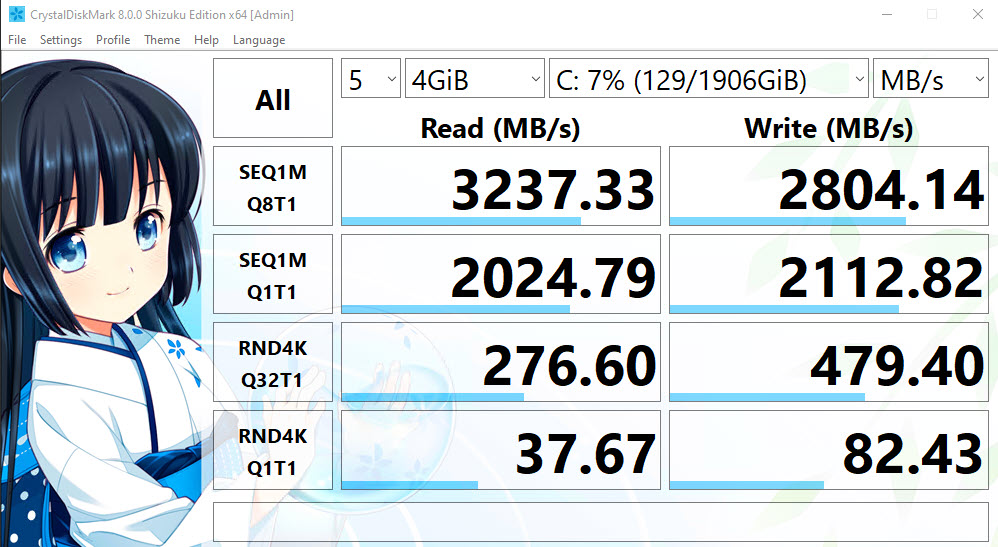
Comparing my P51 storage to the new P17 storage:
I can read the Posts table into memory about 8 seconds faster on the new laptop. Pretty sweet!
Thanks for reading!
If this is the kind of SQL Server stuff you love learning about, you’ll love my training. I’m offering a 75% discount to my blog readers if you click from here. I’m also available for consulting if you just don’t have time for that and need to solve performance problems quickly.
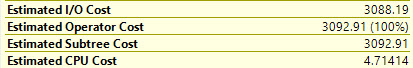
There’s a lot of confusion about what costs mean in query plans. Often when working with clients, they’ll get all worked up about the cost of a plan, or an operator in a plan.
Things I hear over and over again:
Neither of those things are true, of course.
The optimizer doesn’t know that your storage is maybe awesome. It assumes that it’s not. Ever seen how high random I/O is costed?
And no matter how much memory you have, or how much of your data is already in memory, it starts with the assumption that none of it is (cold cache).
Costs can be especially misleading in estimated/cached plans when parameter sniffing is to blame.
For me, I mostly used costs to show why SQL Server may have chosen one plan over another. The thing is, once you understand that the optimizer chooses plans based on cost, it’s easy to make the logical leap that… the other option was estimated to be more expensive.
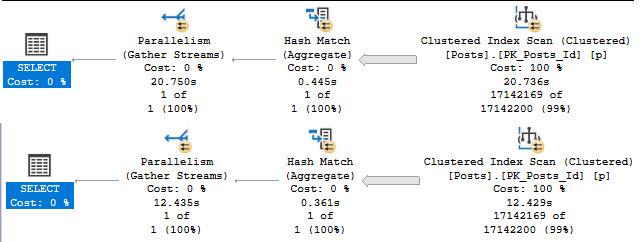
Another thing is that while many metrics have “estimated” and “actual” components when you collect an actual execution plan…
… None of those estimated cost metrics have actual components that appear in actual plans, nor do they get updated after a query runs to reflect what happened when it ran.
If they did that, they’d be useless to illustrate the one point they can reasonably make: why a plan got chosen.
In more recent versions of SQL Server and SSMS, you get operator times. For more detail on timing stuff, check out my videos here and here on it.
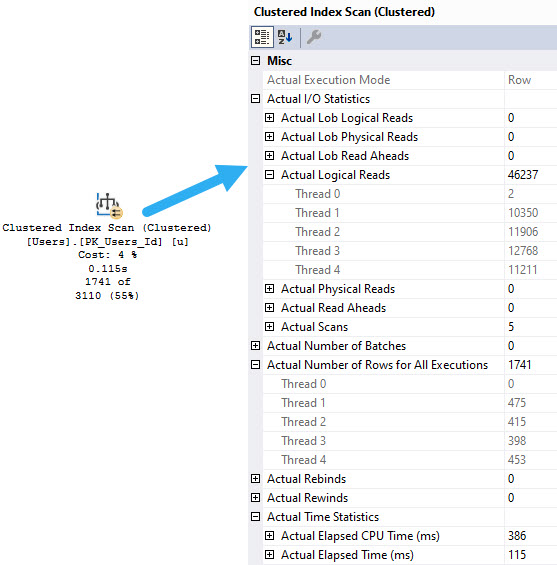
Along with operator times, we get information about I/O, row/thread distribution in parallel plans, and a bunch of other useful metrics.
I’d much rather see either the last runtime for operators or the average runtime for operators in a plan. Before you go calling me crazy, remember that SQL Server 2019 has the a new DMV called sys.dm_exec_query_plan_stats that tracks the last known actual execution plan for a query.
Long term, it makes way more sense to replace costs with operator runtimes. That would make finding the worst parts of query plans a lot easier.
Thanks for reading!
If this is the kind of SQL Server stuff you love learning about, you’ll love my training. I’m offering a 75% discount to my blog readers if you click from here. I’m also available for consulting if you just don’t have time for that and need to solve performance problems quickly.
There are a couple Extended Events that I was really excited about adding to sp_HumanEvents, but try as I might they wouldn’t fire off anything. Ever.
Why was I excited? Because they would tell us why forced parameterization wasn’t used.
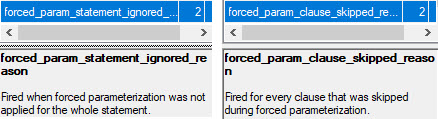
The thing is, they only work if you know someone who isn’t Australian and they know how to change memory bits in WinDbg.
So like. Don’t bother with them for now.
Thanks for reading!
If this is the kind of SQL Server stuff you love learning about, you’ll love my training. I’m offering a 75% discount to my blog readers if you click from here. I’m also available for consulting if you just don’t have time for that and need to solve performance problems quickly.
Seriously. Scram. Get out.
Thanks for reading!
Thanks for watching!
If this is the kind of SQL Server stuff you love learning about, you’ll love my training. I’m offering a 75% discount to my blog readers if you click from here. I’m also available for consulting if you just don’t have time for that and need to solve performance problems quickly.
According to Not-Australians, there used to be a trace flag that would get queries to ignore any supplied hints. It doesn’t work anymore, which sucks, kinda.
Because people do lots of stupid things with hints. Real stupid things. Things you wouldn’t believe the stupid of.
Let’s say, for example, hypothetically of course, that your front end application would add an index hint to every query.
That index hint may or not be helpful to your query in any way. But there it is.
Let’s also posit, using the very depths of our imaginations, that the front end developer was unlikely to change that behavior.
We’ve got a couple indexes:
CREATE INDEX r
    ON dbo.Users(Reputation)
WITH(MAXDOP = 8, SORT_IN_TEMPDB = ON);

CREATE INDEX c
    ON dbo.Users(CreationDate)
WITH(MAXDOP = 8, SORT_IN_TEMPDB = ON);
And we’ve got a query that, via an index hint, is being forced to use the wrong index.
DECLARE @Reputation int = 2;
EXEC sp_executesql N'SELECT * FROM dbo.Users WITH (INDEX  = c) WHERE Reputation = @Reputation;',
                   N'@Reputation int',
                   @Reputation;
The ensuing query plan makes no sense whatsoever.
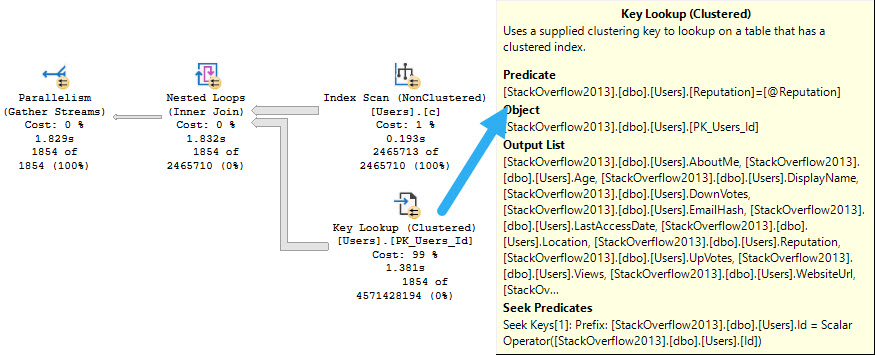
The things are all backwards. We scan the entire nonclustered index, and do a lookup to the clustered index just to evaluate the @Reputation predicate.
The idea is bad. Please don’t do the idea.
There are two things we could do here. We could hint the query to use the index we want, sure.
But what if we change something about this index, or add another one to the table? We might want the optimizer to have a bit more freedom to choose.
I mean, I know. That has its own risks, but whatever.
We can add a plan guide that looks like this:
EXEC sp_create_plan_guide
@name = N'dammit',
@stmt = N'SELECT * FROM dbo.Users WITH (INDEX  = c) WHERE Reputation = @Reputation;',
@type = N'SQL',
@module_or_batch = NULL,
@params = N'@Reputation int',
@hints =  N'OPTION(TABLE HINT(dbo.Users))';
If we were writing proper queries where tables are aliased, it’d look like this:
EXEC sp_create_plan_guide
@name = N'dammit',
@stmt = N'SELECT u.* FROM dbo.Users AS u WITH (INDEX  = c) WHERE u.Reputation = @Reputation;',
@type = N'SQL',
@module_or_batch = NULL,
@params = N'@Reputation int',
@hints =  N'OPTION(TABLE HINT(u))';
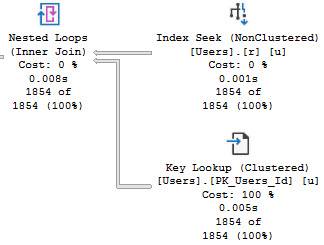
When we re-run our query, things look a lot better:
Thanks for reading!
If this is the kind of SQL Server stuff you love learning about, you’ll love my training. I’m offering a 75% discount to my blog readers if you click from here. I’m also available for consulting if you just don’t have time for that and need to solve performance problems quickly.
Many people will go their entire lives without using or seeing a lock hint other than NOLOCK.
Thankfully, NOLOCK only ever leads to weird errors and incorrect results. You’ll probably never have to deal with the stuff I’m about to talk about here.
But that’s okay, you’re probably busy with the weird errors and incorrect results.
It doesn’t matter who you are, or which Who you use, they all look at the same stuff.
If I run a query with a locking hint to use the serializable isolation level, it won’t be reflected anywhere.
SELECT
    u.*
FROM dbo.Users AS u WITH(HOLDLOCK)
WHERE u.Reputation = 2;
GO 100
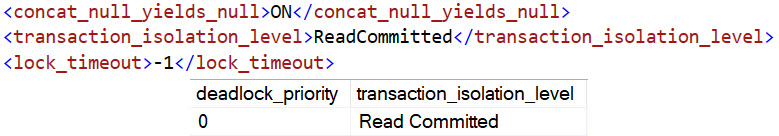
Both WhoIsActive and BlitzWho will show the query as using Read Commited.
EXEC sp_WhoIsActive
    @get_task_info = 2,
    @get_additional_info = 1;

EXEC sp_BlitzWho
    @ExpertMode = 1;
This isn’t to say that either of the tools is broken, or wrong necessarily. They just use the information available to them.
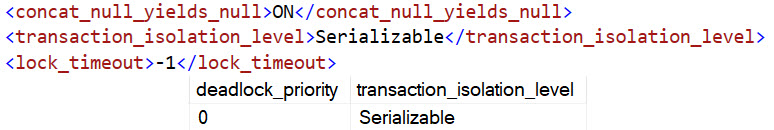
If you set the isolation level at a higher level, they both pick things up correctly.
SET TRANSACTION ISOLATION LEVEL SERIALIZABLE;

SELECT
    u.*
FROM dbo.Users AS u WITH(HOLDLOCK)
WHERE u.Reputation = 2;
GO 100
If we set up a deadlock situation — and look, I know, these would deadlock anyway, that’s not the point — we’ll see the same isolation level incorrectness in the deadlock XML.
BEGIN TRAN

UPDATE u
    SET u.Age = 1
FROM dbo.Users AS u WITH(HOLDLOCK)
WHERE u.Reputation = 2;

UPDATE b
    SET b.Name = N'Totally Tot'
FROM dbo.Badges AS b WITH(HOLDLOCK)
WHERE b.Date >= '20140101'

ROLLBACK
Running sp_BlitzLock:
EXEC sp_BlitzLock;

Again, it’s not like the tool is wrong. It’s just parsing out information from the deadlock XML. The deadlock XML isn’t technically wrong either. The isolation level for the transaction is read committed, but the query is asking for more.
The problem is obvious when the query hints are right in front of you, but sometimes people will bury hints down in things like views or functions, and it makes life a little bit more interesting.
Thanks for reading!
If this is the kind of SQL Server stuff you love learning about, you’ll love my training. I’m offering a 75% discount to my blog readers if you click from here. I’m also available for consulting if you just don’t have time for that and need to solve performance problems quickly.
One problem with Lookups, aside from the usual complaints, is that the optimizer has no options for when the lookup happens.
If the optimizer decides to use a nonclustered index to satisfy some part of the query, but the nonclustered index doesn’t have all of the columns needed to cover what the query is asking for, it has to do a lookup.
Whether the lookup is Key or RID depends on if the table has a clustered index, but that’s not entirely the point.
The point is that there’s no way for the optimizer to decide to defer the lookup until later in the plan, when it might be more opportune.
Let’s take one index, and two queries.
CREATE INDEX p
    ON dbo.Posts(PostTypeId, Score, CreationDate)
    INCLUDE(OwnerUserId);
Stop being gross.
SELECT TOP (1000)
    u.DisplayName,
    p.*
FROM dbo.Posts AS p
JOIN dbo.Users AS u
    ON p.OwnerUserId = u.Id
WHERE p.PostTypeId = 1
AND   p.Score > 5
ORDER BY p.CreationDate DESC;

SELECT TOP (1000)
    u.DisplayName,
    p.*
FROM dbo.Posts AS p
JOIN dbo.Users AS u
    ON p.OwnerUserId = u.Id
WHERE p.PostTypeId = 1
AND   p.Score > 6
ORDER BY p.CreationDate DESC;
The main point here is not that the lookup is bad; it’s actually good, and I wish both queries would use one.
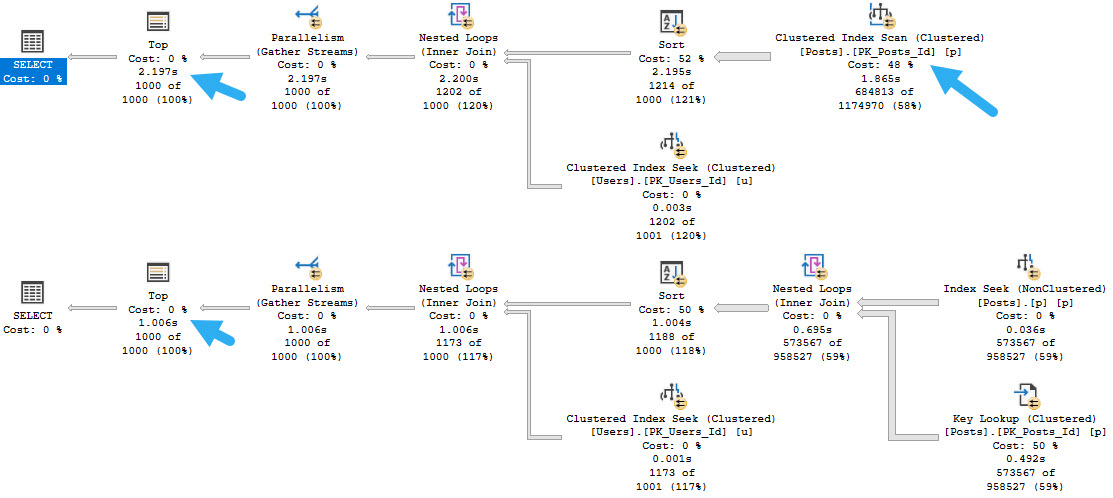
If we hint the first query to use the nonclustered index, things turn out better.
SELECT TOP (1000)
    u.DisplayName,
    p.*
FROM dbo.Posts AS p WITH(INDEX = p)
JOIN dbo.Users AS u
    ON p.OwnerUserId = u.Id
WHERE p.PostTypeId = 1
AND   p.Score > 5
ORDER BY p.CreationDate DESC;
Running a full second faster seems like a good thing to me, but there’s a problem.
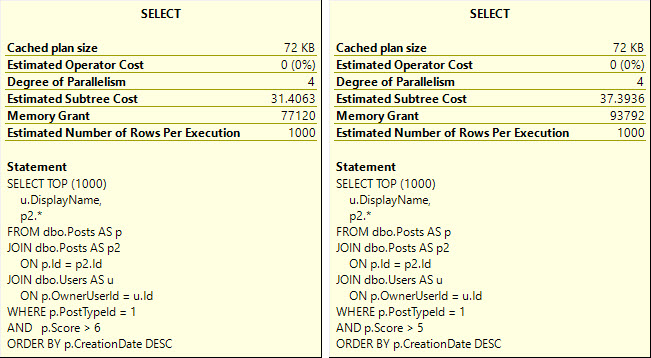
Whether we use the lookup or scan the clustered index, all of these queries ask for rather large memory grants, between 5.5 and 6.5 GB
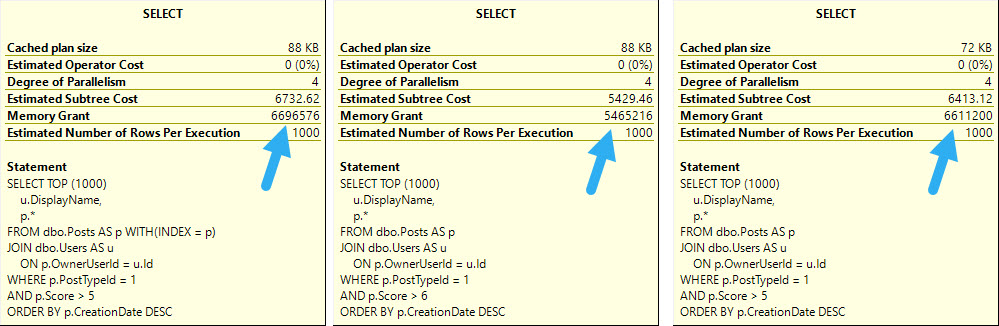
The operator asking for memory is the Sort — and while I’d love it if we could index for every sort — it’s just not practical.
So like obviously changing optimizer behavior is way more practical. Ahem.
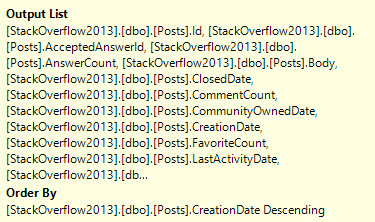
The reason that the Sort asks for so much memory in each of these cases is that it’s forced to order the entire select output from the Posts table by the CreationDate column.
If we rewrite the query a bit, we can get the optimizer to sort data long before we go get all the output columns:
SELECT TOP (1000)
    u.DisplayName,
    p2.*
FROM dbo.Posts AS p
JOIN dbo.Posts AS p2
    ON p.Id = p2.Id
JOIN dbo.Users AS u
    ON p.OwnerUserId = u.Id
WHERE p.PostTypeId = 1
AND   p.Score > 5
ORDER BY p.CreationDate DESC;

SELECT TOP (1000)
    u.DisplayName,
    p2.*
FROM dbo.Posts AS p
JOIN dbo.Posts AS p2
    ON p.Id = p2.Id
JOIN dbo.Users AS u
    ON p.OwnerUserId = u.Id
WHERE p.PostTypeId = 1
AND   p.Score > 6
ORDER BY p.CreationDate DESC;
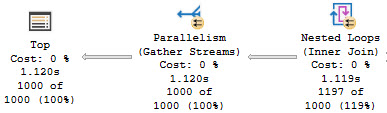
In both cases, we get the same query plan shape, which is what we’re after:
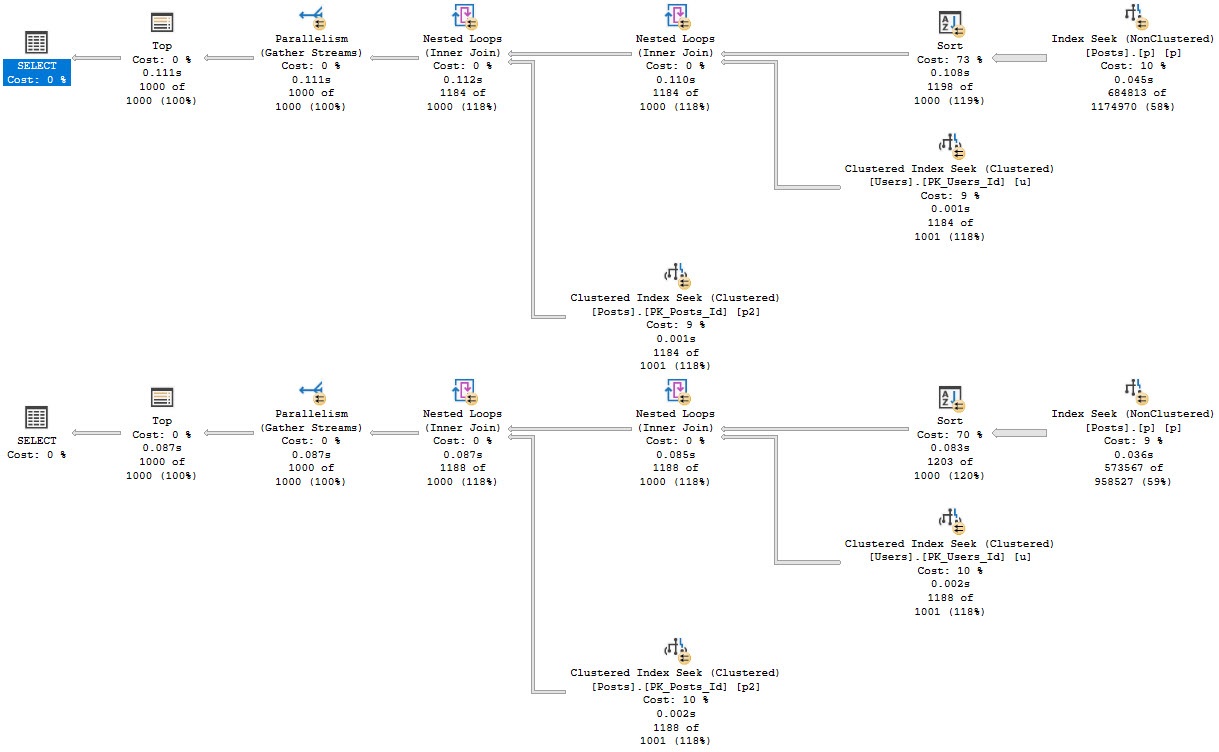
Because the Sort happens far earlier on in the plan, there’s less of a memory grant needed, and by quite a stretch from the 5+ GB before.
Thanks for reading!
If this is the kind of SQL Server stuff you love learning about, you’ll love my training. I’m offering a 75% discount to my blog readers if you click from here. I’m also available for consulting if you just don’t have time for that and need to solve performance problems quickly.
After blogging recently (maybe?) about filters, there was a Stack Exchange question about a performance issue when a variable was declared with a max type.
After looking at it for a minute, I realized that I had never actually checked to see if a recompile hint would allow the optimizer more freedom when dealing with them.
CREATE INDEX u
    ON dbo.Users(DisplayName);

DECLARE @d nvarchar(MAX) = N'Jon Skeet';

SELECT
    COUNT_BIG(*) AS records
FROM dbo.Users AS u
WHERE u.DisplayName = @d;

SELECT
    COUNT_BIG(*) AS records
FROM dbo.Users AS u
WHERE u.DisplayName = @d
OPTION(RECOMPILE);
Turns out that it won’t, which is surprising.
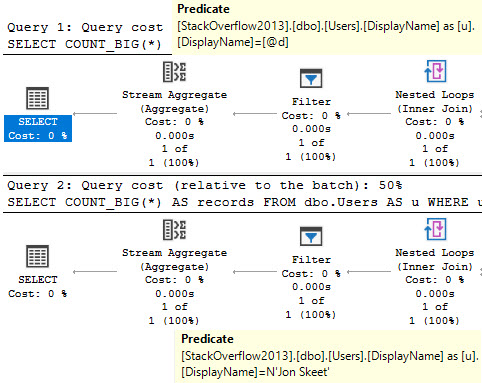
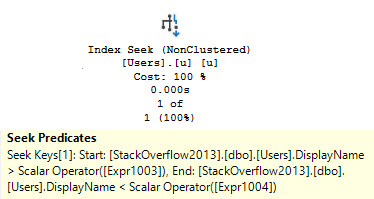
Even though both plans have sort of a weird seek, the filter operator remains as a weird sort of residual predicate.
Thanks for reading!
If this is the kind of SQL Server stuff you love learning about, you’ll love my training. I’m offering a 75% discount to my blog readers if you click from here. I’m also available for consulting if you just don’t have time for that and need to solve performance problems quickly.