Sometimes I have a need to run a quick CPU comparison test between two different SQL Server instances. For example, I might be switching from old hardware to new hardware and I want to immediately see a faster query to know that I got my money’s worth. Sometimes I get a spider sense while working with virtualized SQL Server instances and want to check for problems. Yesterday, I was doing a sort of basic health check on a few servers that I hadn’t worked with much and I wanted to verify that they got the same performance for a very simple query.
The Test Code
To get a single CPU core to 100% within SQL Server with minimal setup, the best method known to me uses a temporary procedure that does a simple operation within a WHILE loop:
CREATE OR ALTER PROCEDURE #p AS
BEGIN
    SET NOCOUNT ON;
    DECLARE @i BIGINT = 0, @time DATETIME2 = SYSUTCDATETIME();

    WHILE @i < 1000000
    BEGIN
        SET @i = @i + 1;
    END;

    SELECT cpu_time, DATEDIFF(MILLISECOND, @time, SYSUTCDATETIME()) elapsed_time
    FROM sys.dm_exec_requests
    WHERE session_id = @@SPID;
END;

GO

EXEC #p;
The code is extremely efficient (from a certain point of view) and CPU time will closely match elapsed time as as long as there’s no other processes on the lucky CPU that runs my beautiful code. It’s designed to spend as little time on waits and latches as possible. A temporary stored procedure is used to avoid ASYNC_NETWORK_IO waits. Paul White explains why the ASYNC_NETWORK_IO waits appear when the same code is run as part of a batch in this stack exchange answer.
CPU Problems
Going back to the intro, you can probably guess that I did not see identical CPU times when comparing the two servers. Otherwise, there would be no reason to write a blog post. The first server that I tested took about 2400 CPU ms to execute the code. The second server took about 300 CPU ms. There are of course a lot of factors in play here, but I would expect a healthy machine to take somewhere around 200-800 ms of CPU work. I definitely wouldn’t expect an 8X difference for two servers that were supposed to have identical performance!
To be clear, the only thing that you can safely conclude in this kind of situation is that there’s some kind of unknown configuration difference between the two servers. It does not necessarily mean that there’s some kind of severe issue with the server that takes more CPU time to perform the same work. With that said, it’s definitely suspicious and not something that you want to unexpectedly see. Running down the root cause of the issue can be difficult and time consuming because there are a lot of possible causes. Here is an incomplete list:
- Hardware differences
- Power plan and other OS configuration settings
- OS patching, especially side channel vulnerability fixes
- Enabling hyperthreading (CPU reporting within SQL server doesn’t have the same meaning)
- Disabling Intel Turbo Boost
- VM CPU oversubscription
- VMware’s Enhanced vMotion Compatibility (EVC) – force a CPU to run on an older instruction set for compatibility reasons
- Other VM issues
- SQL Server version
- Expensive monitoring configured within SQL Server including certain extended events, trace flags, profiling, or traces
In my case, the culprit ended up being a popular SQL Server third party monitoring solution (I will decline to name the vendor). Again, we can’t conclude that the vendor is doing something wrong. Different types of monitoring will have different overheads for different types of work within SQL Server. In some cases, simply asking for a SQL Server actual plan can more than double the execution time of a query. That doesn’t mean that we shouldn’t use actual plans as performance diagnosis tool!
Digging In
There was a fair amount of circumstantial evidence that the monitoring tool was responsible. It was running on the server with the slower code and it wasn’t running on the server with the faster code. Disabling the monitoring tool made both CPU times match. However, how can we really prove that the monitoring tool is the culprit? Where exactly is that extra CPU time going?
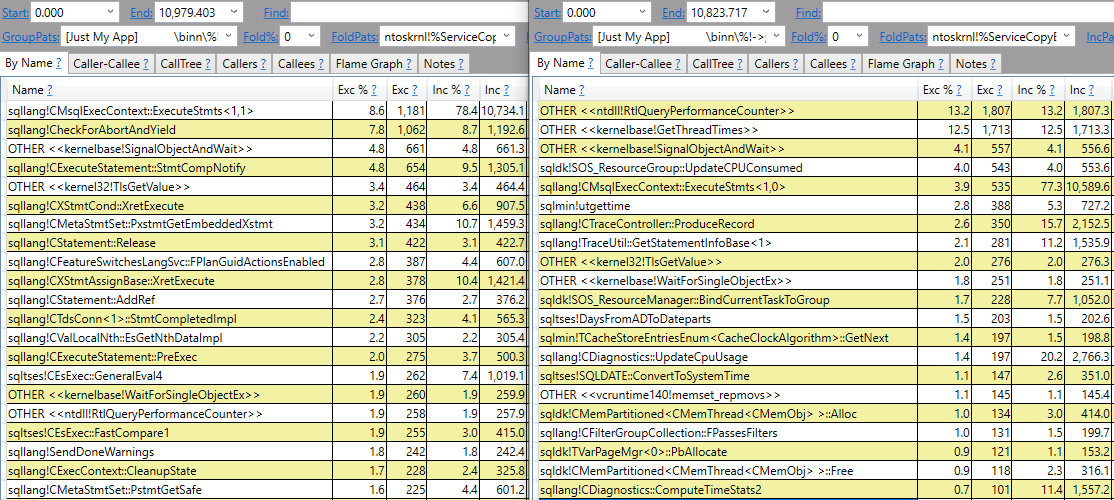
ETW tracing can provide a summary of call stacks during a sampled time period. Common choices are Windows Performance Recorder or PerfView. As usual, I will use PerfView. I was able to temporarily add third party monitoring to the server with the fast code. Fortunately, there wasn’t any other SQL Server work occurring during my testing so PerfView was quite effective at showing the difference between the two servers. In the image below, call stacks for slightly modified code without the monitoring tool are on the left. Call stacks for the same code with the monitoring tool present on the left are on the right:

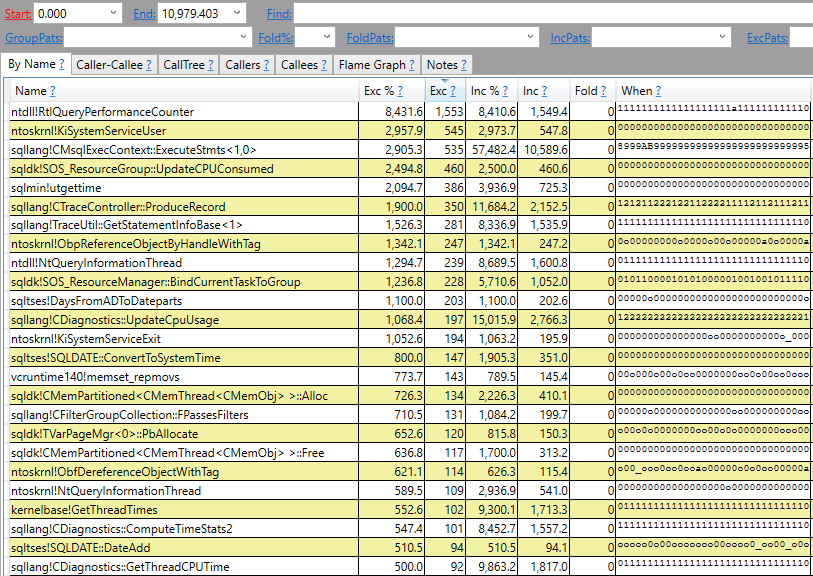
It doesn’t take a SQL Server expert to see that there are some notable differences here. I’m not an expert in SQL Server call stacks, but a lot of the stuff on the left is about what I would expect for extremely efficient code in a loop. It’s a similar feeling to those people who can identify photoshopped pictures by looking at the pixels. A lot of the stuff on the right is what I would expect if SQL Server is spending a relatively large percentage of CPU time doing monitoring, such as ntdll!RtlQueryPerformanceCounter and sqllang!TraceUtil::GetStatementInfoBase. Here’s a diff view if that makes it easier to see some of the differences:

The “exc” column is the difference of the number of CPU ms spent by the method itself (not including called methods). A positive number means that the slow code spent more CPU time on that method and a negative number (not shown in this picture) means that the fast code spend more CPU time on that method.
I would describe the PerfView results as fairly conclusive evidence: the third party SQL Server monitoring tool is responsible for the 8X difference in CPU time for the WHILE loop between the two servers.
Final Thoughts
The real production workload does something more important (and complicated) than simply incrementing a variable. Seeing an 8X performance difference in that simple code wasn’t a good or welcome sign, but I expect to see a dramatic reduction in monitoring overhead when benchmarking the real workload after disabling the monitoring tool. There may not be anything to fix here, but it’s always helpful to be reminded of everything that’s running on your servers. Thanks for reading!


