Query Tuning SQL Server 2019 Part 4: Long Live The Query Tuner

Rumors Of My Demise


Let’s talk about some common hints that people use to fix parameter sniffing:

  • RECOMPILE: Won’t work here to get us a better plan for VoteTypeId 5, because it sucks when the optimizer knows what’s coming
  • OPTIMIZE FOR UNKNOWN: Works like once every 5 years, but people still bring it up, and really sucks here (picture below)
  • OPTIMIZE FOR (VALUE): Plan sharing doesn’t work great generally — if we were gonna do this, it’d have to be dynamic

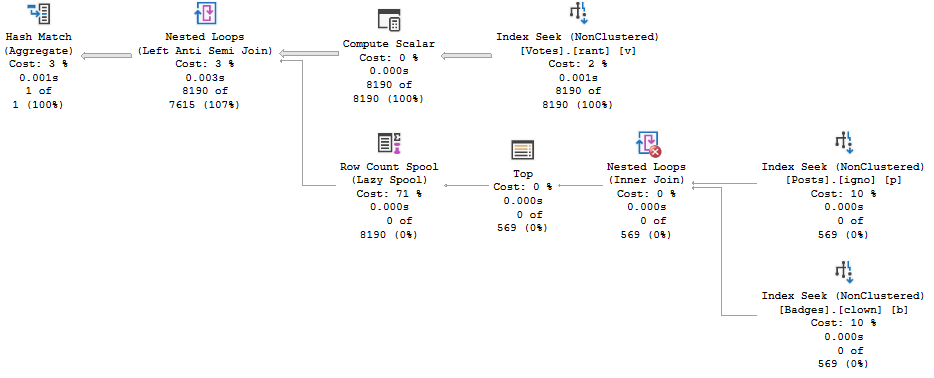
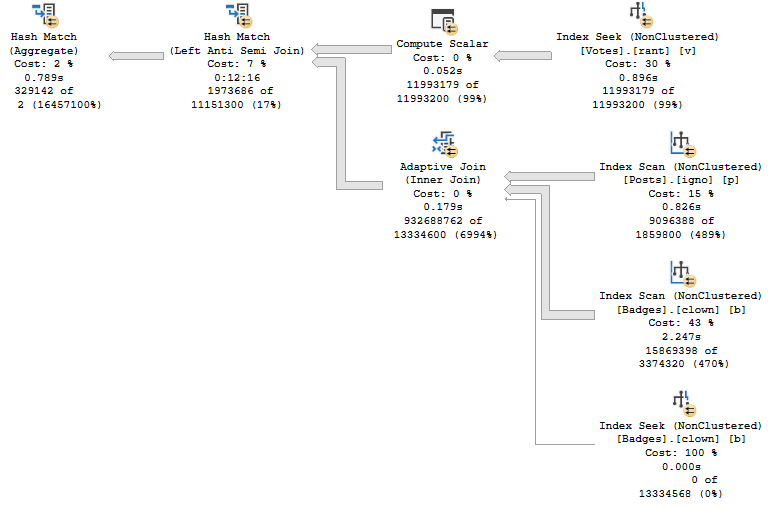
This is what happens when we optimize for unknown. The density vector guess is 13,049,400.

SQL Server Query Plan
Stop it with this.

That guess for Vote Types with very few rows ends up with a plan that has very high startup costs.

This version of the query will run for 13-17 seconds for any given parameter. That sucks in zero gravity.

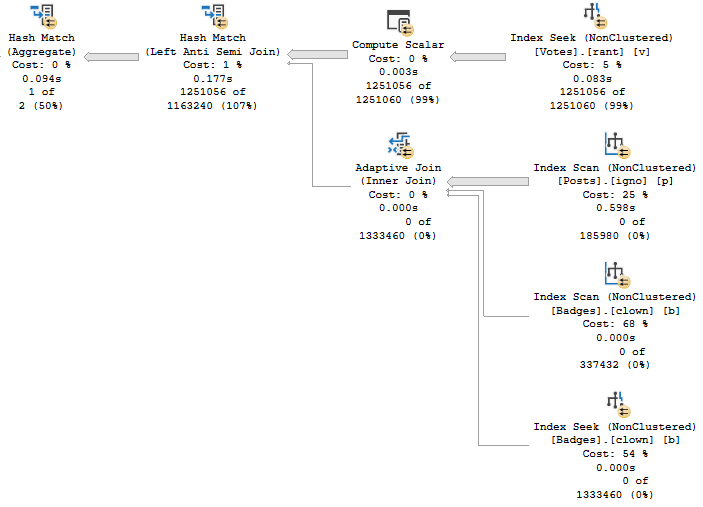
Pictured above is the plan for VoteTypeId 4, which previously finished sub-second using Plan 1 and Plan 2.

With those out of the way, how can we fix this thing?

The Mint


In some circumstances, a #temp table would help if we pre-staged rows from Votes.

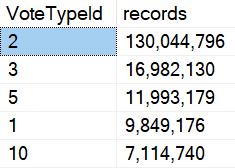
The problem is that for many calls, we’d be putting between 7 and 130 MILLION rows into a temp table.

Not my idea of a good time.

SQL Server Query Results
RAMDISKS NINETY NINE CENTS

But what about the other part of the query?

If count up distinct OwnerUserIds, we get about 3.2 million.

Better, we can reduce the rows further in the procedure with an EXISTS to Votes (I’ll show you that in a minute).

SELECT COUNT_BIG(DISTINCT p.OwnerUserId) AS records --3,236,013
FROM dbo.Posts AS p
JOIN dbo.Badges AS b 
    ON b.UserId = p.OwnerUserId 
WHERE  p.PostTypeId = 1 

That’s not too bad, depending on:

  • How frequently it runs
  • How concurrently it runs
  • How overwhelmed tempdb is
  • Your Mom

The Product


That gives us:

CREATE OR ALTER PROCEDURE dbo.VoteSniffing ( @VoteTypeId INT )
AS
BEGIN
SET XACT_ABORT, NOCOUNT ON;

SELECT DISTINCT p.OwnerUserId
INTO #p
FROM dbo.Posts AS p
JOIN dbo.Badges AS b
    ON b.UserId = p.OwnerUserId
WHERE p.PostTypeId = 1
AND EXISTS
(
    SELECT 1/0
    FROM dbo.Votes AS v
    WHERE v.UserId = p.OwnerUserId
    AND   v.VoteTypeId = @VoteTypeId
);

SELECT   ISNULL(v.UserId, 0) AS UserId,
         SUM(CASE WHEN v.CreationDate >= '20190101'
                  AND  v.CreationDate < '20200101'
                  THEN 1
                  ELSE 0
             END) AS Votes2019,
         SUM(CASE WHEN v.BountyAmount IS NULL
                  THEN 0
                  ELSE 1
             END) AS TotalBounty,
         COUNT(DISTINCT v.PostId) AS PostCount,
         @VoteTypeId AS VoteTypeId
FROM     dbo.Votes AS v WITH(FORCESEEK)
WHERE    v.VoteTypeId = @VoteTypeId
AND      NOT EXISTS
        (   
            SELECT 1/0
            FROM #p AS p
            WHERE  p.OwnerUserId = v.UserId
        )
GROUP BY v.UserId;

END;
GO

Which works pretty well across all calls, and avoids the primary issue with VoteTypeId 5.

SQL Server Query Execution Times
Navy Blue

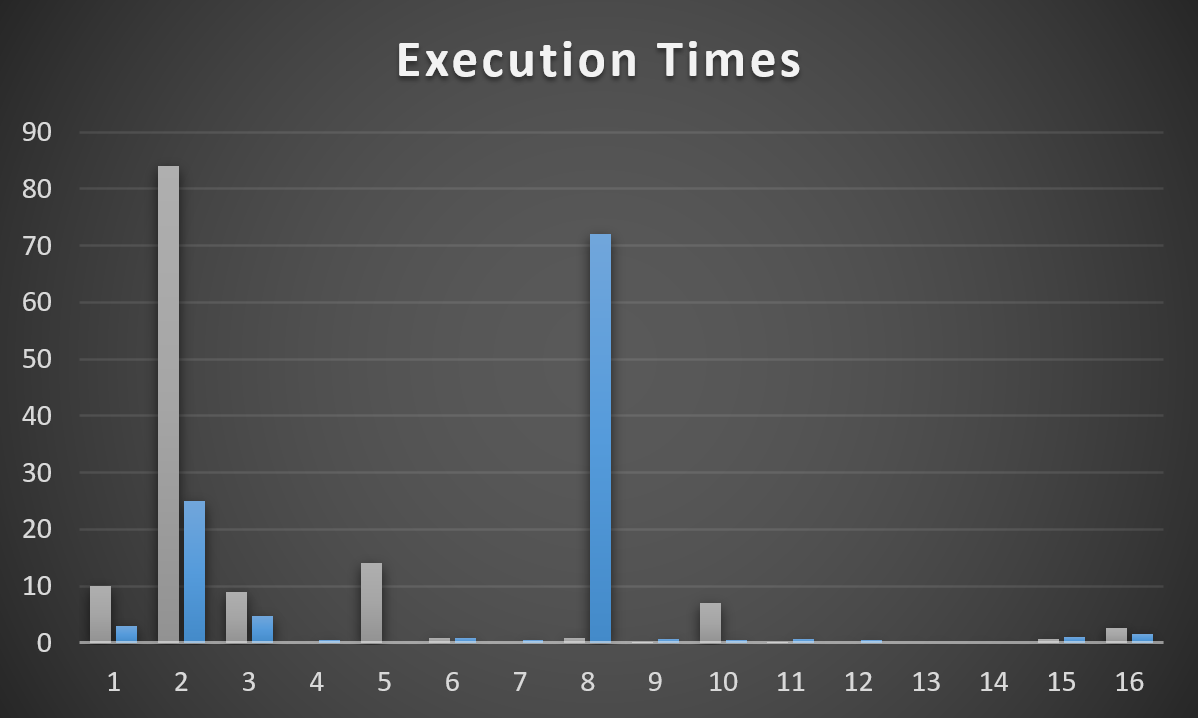
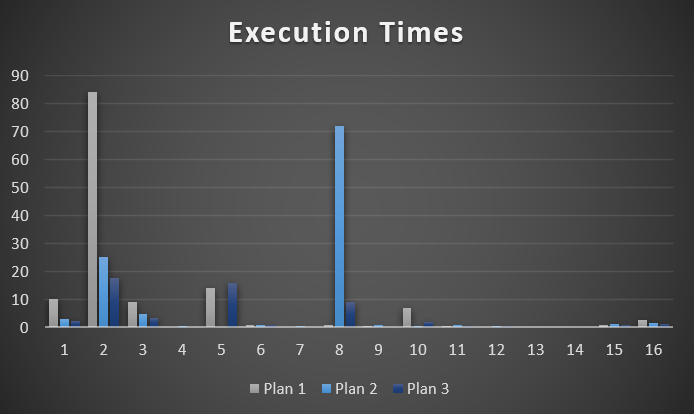
I’m generally happy with this, with the slight exception of VoteTypeId 8. Yeah, it beats the pants off of when we sniff Plan 2, but it’s about 7 seconds slower than when we get Plan 1.

I pulled the 17 minute execution from this graph for Plan 2/VoteTypeId 5, too, because it’s so distracting. Not having to worry about that thing is a trade off I’m willing to make for Plan 3 being about a second slower than Plan 1.

Not bad for a lazy Sunday afternoon of blogging, though.

Save One For Friday


Query tuning in SQL Server 2019 isn’t always a whole lot different from performance tuning other versions of SQL Server.

You have some more help from optimizer features (especially if you’re on Enterprise Edition), but they don’t solve every problem, and you can run into some very common problems that you’re already used to solving.

You may even be able to use some very familiar techniques to fix things.

In tomorrow’s post, I want to look at a quirk that would have thrown us way off course to explore on our way here.

Thanks for reading!

Going Further


If this is the kind of SQL Server stuff you love learning about, you’ll love my training. I’m offering a 75% discount to my blog readers if you click from here. I’m also available for consulting if you just don’t have time for that and need to solve performance problems quickly.

Query Tuning SQL Server 2019 Part 3: Who Died And Made You The Optimizer?

Be Yourself


We’ve got a problem, Sam Houston. We’ve got a problem with a query that has some strange issues.

It’s not parameter sniffing, but it sure could feel like it.

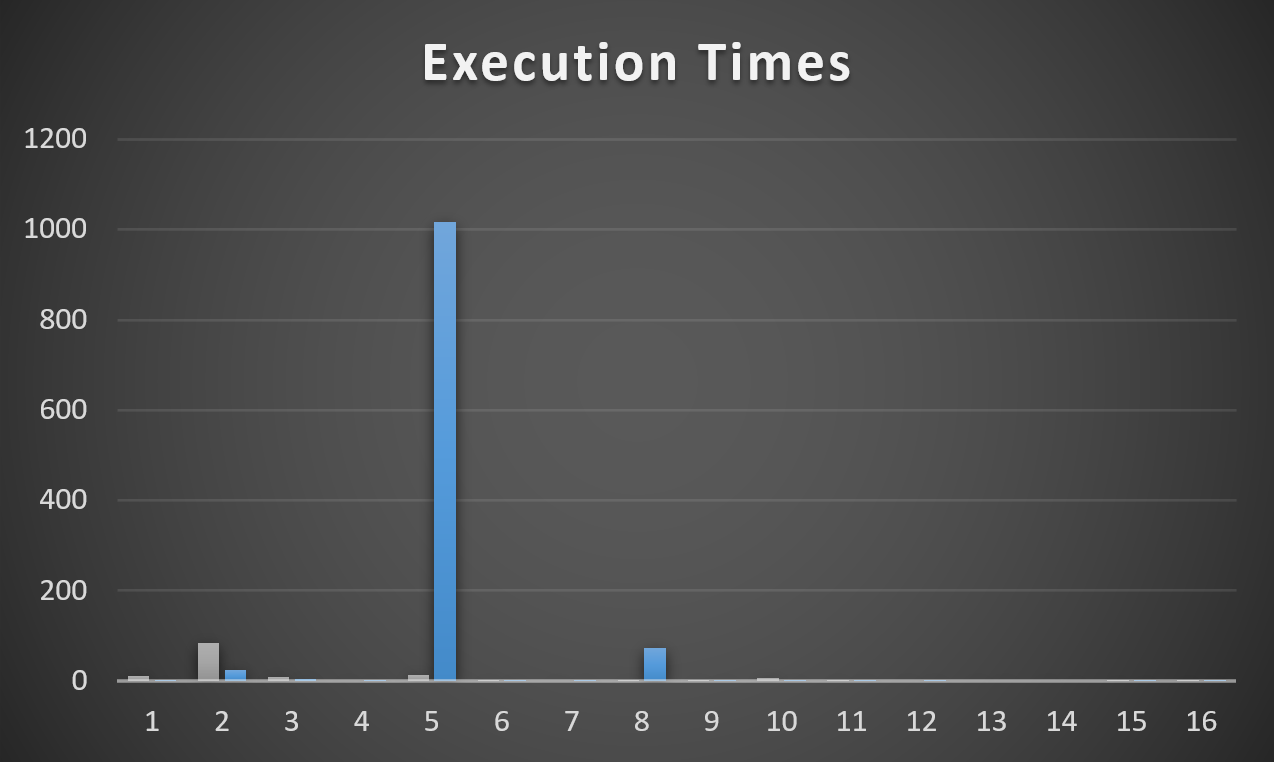
  • When the procedure compiles and runs with VoteTypeId 5, it runs for 12 minutes
  • Other VoteTypeIds run well with the same plan that VoteTypeId 5 gets
  • When VoteTypeId 5 runs with a “small” plan, it does okay at 10 seconds

Allow me to ruin a graph to illustrate. The Y axis is still seconds, but… it goes up a little higher now.

SQL Server Query Execution Times
weigh-in

The Frustration (A Minor Digression)


Here’s where life can be tough when it comes to troubleshooting actual parameter sniffing.

If you’re relying solely on the plan cache, you’re screwed. You’ll see the plan, and the compile value, but you won’t have the runtime value anywhere that “caused” the problem. In other words, the set of parameters that were adversely affected by the query plan that didn’t fit.

There are some things that can help, like if you’re watching it happen live, or if you have a monitoring tool that might capture runtime parameters.

OR IF YOU USE SP UNDERSCORE HUMANEVENTS.

Like I said, this isn’t parameter sniffing, but it feels like it.

It could extra-feel like it because you might see a misbehaving query, and a compile-time parameter that runs quickly on its own when you test it, e.g. VoteTypeId 6.

It would be really hard to tell that even if a plan were to compile specifically for a different parameter, it would still run for 12 minutes.

Heck, that’d even catch me off-guard.

But that’s what we have here: VoteTypeId 5 gets a bad plan special for VoteTypeId 5.

Examiner


Let’s dig in on what’s happening to cause us such remarkable grief. There has to be a reason.

I don’t need more grief without reason; I’ve already got a public school education.

SQL Server Query Plan
I WANT TO KNOW

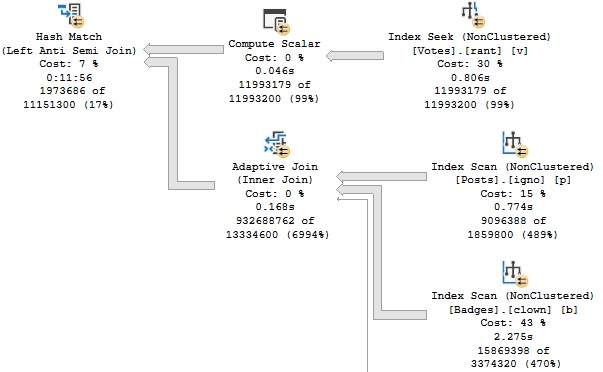
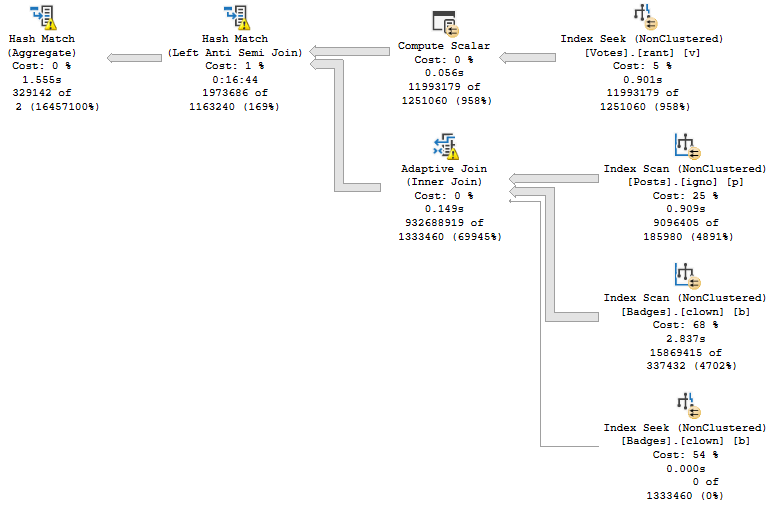
If we were to summarize the problem here: that Hash Match Left Anti Semi Join runs for 12 minutes on its own.

No other operator, or group of operators, is responsible for a significant amount of time comparatively.

Magnifier


Some things to note:

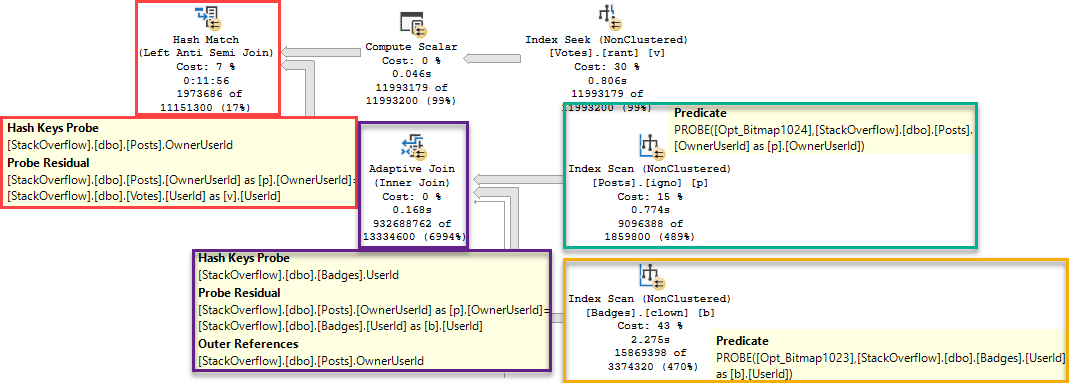
  • The bad estimates aren’t from predicates, they’re from Batch Mode Bitmaps
  • Those bad estimates end up producing a much larger number of rows from the Adaptive Join
  • The Hash Match ends up needing to probe 932 million rows


SQL Server Query Plan
el disastero

Taking 12 minutes to probe 932 million rows is probably to be expected, now that I think about it.

If the optimizer had a good estimate from the Bitmaps here, it may have done the opposite of what a certain Pacific Island Dwelling Bird said:

Getting every nuance of this sort of relational transformation correct can be tricky. It is very handy that the optimizer team put the effort in so we do not have to explore these tricky rewrites manually (e.g. by changing the query text). If nothing else, it would be extremely tedious to write all the different query forms out by hand just to see which one performed better in practice. Never mind choosing a different version depending on current statistics and the number of changes to the table.

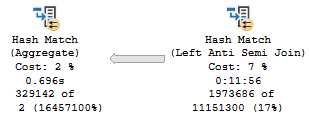
In this case, the Aggregate happens after the join. If the estimate were correct, or even in the right spacetime dimension, this would be fine.

We can gauge the general efficiency of it by looking at when this plan is used for other parameters that produce numbers of rows that are closer to this estimate.

SQL Server Query Plan
huey

If the optimizer had made a good guess for this parameter, it may have changed the plan to put an aggregate before the join.

Unfortunately we have very little control over estimates for Bitmaps, and the guesses for Batch Mode Bitmaps are a Shrug of Atlassian proportions.

Finisher


We’ve learned some things:

  1. This isn’t parameter sniffing
  2. Batch Mode Bitmaps wear pants on their head
  3. Batch Mode Bitmaps set their head-pants on fire
  4. Most of the time Batch Mode performance covers this up
  5. The plan for VoteTypeId 5 is not a good plan for VoteTypeId 5
  6. The plan for VoteTypeId 5 is great for a lot of other VoteTypeIds

In tomorrow’s post, we’ll look at how we can fix the problem.

Thanks for reading!

Going Further


If this is the kind of SQL Server stuff you love learning about, you’ll love my training. I’m offering a 75% discount to my blog readers if you click from here. I’m also available for consulting if you just don’t have time for that and need to solve performance problems quickly.

Query Tuning SQL Server 2019 Part 2: Big Databases, Big Ideas

Are We Still Friends?


When I first wrote this demo, I called it dbo.ParameterSniffingMonstrosity.

Because , you know, it’s really terrible.

CREATE OR ALTER PROCEDURE dbo.VoteSniffing( @VoteTypeId INT )
AS
SET XACT_ABORT, NOCOUNT ON;
    BEGIN
        SELECT   ISNULL(v.UserId, 0) AS UserId,
                 SUM(CASE WHEN v.CreationDate >= '20190101'
                          AND  v.CreationDate < '20200101'
                          THEN 1
                          ELSE 0
                     END) AS Votes2019,
                 SUM(CASE WHEN v.BountyAmount IS NULL
                          THEN 0
                          ELSE 1
                     END) AS TotalBounty,
                 COUNT(DISTINCT v.PostId) AS PostCount,
                 @VoteTypeId AS VoteTypeId
        FROM     dbo.Votes AS v
        WHERE    v.VoteTypeId = @VoteTypeId
        AND      NOT EXISTS
                (   
                    SELECT 1/0
                    FROM dbo.Posts AS p
                    JOIN dbo.Badges AS b 
                        ON b.UserId = p.OwnerUserId 
                    WHERE  p.OwnerUserId = v.UserId
                    AND    p.PostTypeId = 1 
                )
        GROUP BY v.UserId;
    END;
GO

The only parameter is for VoteTypeId, which has some pretty significant skew towards some types, especially in the full size Stack Overflow database.

SQL Server Query Results
Ask me about my commas

It’s like, when people tell you to index the most selective column first, well.

  • Sometimes it’s pretty selective.
  • Sometimes it’s not very selective

But this is exactly the type of data that causes parameter sniffing issues.

With almost any data set like this, you can draw a line or three, and values within each block can share a common plan pretty safely.

But crossing those lines, you run into issues where either little plans do far too much looping and seeking and sorting for “big” values, and big plans do far too much hashing and scanning and aggregating for “little” values.

This isn’t always the exact case, but generally speaking you’ll observe something along these lines.

It’s definitely not the case for what we’re going to be looking at this week.

This week is far more interesting.

That’s why it’s a monstrosity.

Fertilizer


The indexes that I create to support this procedure look like so — I’ve started using compression since at this point in time, 2016 SP1 is commonplace enough that even people on Standard Edition can use them — and they work quite well for the majority of values and query plans.

CREATE INDEX igno
ON dbo.Posts 
    (OwnerUserId, PostTypeId)
    WHERE PostTypeId = 1 
WITH(MAXDOP = 8, SORT_IN_TEMPDB = ON, DATA_COMPRESSION = ROW);
GO

CREATE INDEX rant
ON dbo.Votes 
    (VoteTypeId, UserId, PostId)
INCLUDE 
    (BountyAmount, CreationDate) 
WITH(MAXDOP = 8, SORT_IN_TEMPDB = ON, DATA_COMPRESSION = ROW);
GO 

CREATE INDEX clown ON dbo.Badges( UserId ) 
WITH(MAXDOP = 8, SORT_IN_TEMPDB = ON, DATA_COMPRESSION = ROW);
GO

If there are other indexes you’d like to test, you can do that locally.

What I want to point out is that for many values of VoteTypeId, the optimizer comes up with very good, very fast plans.

Good job, optimizer.

In fact, for any of these runs, you’ll get a good enough plan for any of the other values. They share well.

EXEC dbo.VoteSniffing @VoteTypeId = 4;
EXEC dbo.VoteSniffing @VoteTypeId = 6;
EXEC dbo.VoteSniffing @VoteTypeId = 7;
EXEC dbo.VoteSniffing @VoteTypeId = 9;
EXEC dbo.VoteSniffing @VoteTypeId = 11;
EXEC dbo.VoteSniffing @VoteTypeId = 12;
EXEC dbo.VoteSniffing @VoteTypeId = 13;
EXEC dbo.VoteSniffing @VoteTypeId = 14;
EXEC dbo.VoteSniffing @VoteTypeId = 15;
EXEC dbo.VoteSniffing @VoteTypeId = 16;

VoteTypeIds 1, 2, 3, 5, 8, and 10 have some quirks, but even they mostly do okay using one of these plans.

There are two plans you may see occur for these.

Plan 1

SQL Server Query Plan
teeny tiny

Plan 2

SQL Server Query Plan
it has adapted

Particulars & Peculiars


Plan 1 is first generated when the proc is compiled with VoteTypeId 4, and Plan 2 is first generated when the proc is compiled with VoteTypeId 6.

There’s a third plan that only gets generated when VoteTypeId 2 is compiled first, but we’ll have to save that for another post, because it’s totally different.

Here’s how each of those plans works across other possible parameters.

SQL Server Query Execution Times
this is my first graph

Plan 1 is grey, Plan 2 is blue. It’s pretty easy to see where each one is successful, and then not so much. Anything < 100ms got a 0.

The Y axis is runtime in seconds. A couple are quite bad. Most are decent to okay.

Plans for Type 2 & 8 obviously stick out, but for different plans.

This is one of those things I need to warn people about when they get wrapped up in:

  • Forcing a plan (e.g. via Query Store or a plan guide)
  • Optimizing for unknown
  • Optimizing for a specific value
  • Recompiling every time (that backfires in a couple cases here that I’m not covering right now)

One thing I need to point out is that Plan 2 doesn’t have an entry here for VoteTypeId 5. Why?

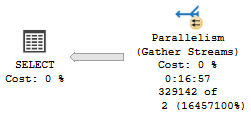
Because when it inherits the plan for VoteTypeId 6, it runs for 17 minutes.

SQL Server Query Plan
singalong

This is probably where you’re wondering “okay, so what plan does 5 get when it runs on its own? Is this the mysterious Plan 4 From Outer Space?”

Unfortunately, the plan that gets generated for VoteTypeId 5 is… the same one that gets generated for VoteTypeId 6, but 6 has a much smaller memory grant.

If you’re not used to reading operator times in execution plans, check out my video here.

Since this plan is all Batch Mode operators, each operator will track its time individually.

The Non-Switch


VoteTypeId 5 runtime, VoteTypeId 6 compile time

If I were to put a 17 minute runtime in the graph (>1000 seconds), it would defeat the purpose of graphing things.

Note the Hash Match has, by itself, 16 minutes and 44 seconds of runtime.

SQL Server Query Plan
pyramids

VoteTypeId 5 runtime, and compile time

This isn’t awesome, either.

The Hash Join, without spilling, has 12 minutes and 16 seconds of runtime.

SQL Server Query Plan
lost

Big Differentsiz


You have the same plan shape and operators. Even the Adaptive Join follows the same path to hash instead of loop.

Sure, the spills account for ~4 minutes of extra time. They are fairly big spills.

But the plan for VoteTypeId 5, even when compiled specifically for VoteTypeId 5… sucks, and sucks royally.

There are some dismally bad estimates, but where do they come from?

We just created these indexes, and data isn’t magically changing on my laptop.

TUNE IN TOMORROW!

Thanks for reading

Going Further


If this is the kind of SQL Server stuff you love learning about, you’ll love my training. I’m offering a 75% discount to my blog readers if you click from here. I’m also available for consulting if you just don’t have time for that and need to solve performance problems quickly.

Query Tuning SQL Server 2019 Part 1: Changing Databases

Teeth To Grit


I’ve always had trouble standing still on SQL Server versions, but most companies don’t. Hardly anyone I talk to is on SQL Server 2017, though these days SQL Server 2016 seems more common than SQL Server 2012, so at least there’s that. Mostly I’m happy to not see SQL Server 2014. God I hate SQL Server 2014.

Despite the lack of adoption, I’ve been moving all my training material to SQL Server 2019. Heck, in a few years, my old posts might come in handy for you.

But during that process, I kept running into the same problem: The demos generally still worked for the OLTP-ish queries, but for the report-ish queries Batch Mode On Rowstore (BMOR, from here) was kicking butt (most of the time anyway, we’re gonna look at some hi-jinks this week).

The problem, so far as I could tell, was that the Stack Overflow 2013 database just wasn’t enough database for SQL Server 2019 (at least with my hardware). My laptop is quad core (8 with HT) @2.9GHz, with 64GB of RAM, and max server memory set to 50GB. The SO2013 database is… just about 50GB.

While it’s fun to be able to create performance problems even with the whole database in memory, it doesn’t match what lot of people are dealing with in real life.

Especially you poor saps on Standard Edition.

My options seemed to be:

  • Drop max server memory down
  • Use a VM with lower memory
  • Use the full size Stack Overflow database

Flipping and Flopping


Each of these has problems, though.

Dropping max server memory down is okay for the buffer pool, but SQL Server (it seems especially with column store/batch mode) is keen to use memory above that for other things like memory grants.

A lot of the interesting struggle I see on client servers between the buffer pool and query memory grants didn’t happen when I did that.

Using a VM with lower memory, while convenient, just didn’t seem as fun. Plus, part of the problem is that, while I make fun of other sample databases for being unrealistically tiny, at least they have relatively modern dates in some of them.

I was starting to feel really goofy having time stop on January 31st, 2013.

I suppose I could have updated all the CreationDate columns to modernize things, but who knows what that would have thrown off.

Plus, here’s a dirty little secret: all the date columns that start with “Last” that track stuff like when someone last logged in, or when a post was last active/edited, they don’t stop at 2013-12-31. They extend up to when the database was originally chopped down to size, in 2017 or so. I always found that a bit jarring, and I’d have to go and add time to them, too, to preserve the gaps.

It all starts to feel a bit like revisionist history.

The End Is Thigh


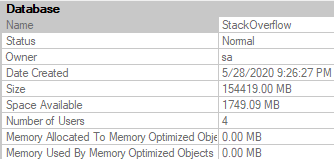
In the end, I settled on using the most recent version available here, but with a couple of the tables I don’t regularly use in demos cut out: PostHistory, and PostLinks. Once you drop those out, a 360GB database drops down to a much more manageable 150Gb or so.

If you’d like to get a copy, here’s the magnet link.

SQL Server Database Properties
Four users, huh?

The nice thing is that the general cadence of the data is the same in many ways and places, so it doesn’t take a lot to adjust demos to work here. Certain Post and Vote Types, User Ids, Reputations, etc. remain skewed, and outliers are easy to find. Plus, at 3:1 data to memory, it’s a lot harder to keep everything safely in the buffer pool.

This does present different challenges, like index create time to set up for things, database distribution, etc.

But if I can give you better demos, that seems worth it.

Plus, I hear everything is in the cloud now anyway.

Alluding To


In the process of taking old demos and seeing how they work with the new database, I discovered some interesting stuff that I want to highlight a little bit. So far as I can tell, they’re not terribly common (yet), but that’s what makes them interesting.

If you’re the kind of person who’s looking forward to SQL Server 2019’s performance features solving some problems for you auto-magick-ally, these may be things you need to watch out for, and depending on your workload they may end up being quite a bit more common than I perceive.

I’m going to be specifically focusing on how BMOR (and to some extent Adaptive Joins) can end up not solving performance issues, and how you may end up having to do some good ol’ fashion query tuning on your own.

In the next post, we’ll look at how one of my favorite demos continues to keep on giving.

Thanks for reading!

Going Further


If this is the kind of SQL Server stuff you love learning about, you’ll love my training. I’m offering a 75% discount to my blog readers if you click from here. I’m also available for consulting if you just don’t have time for that and need to solve performance problems quickly.

In SQL Server Lock Waits Come From Blocking, Not Locks Being Taken By Queries

Waiting Game


In SQL Server, troubleshooting blocking problems is a pain. It’s one of those things you really have to be monitoring for pretty actively in order to catch the full extent of it.

You might catch glimpses of it in sp_WhoIsActive or sp_BlitzWho, but it’s really hard to get the full picture and blocking chain for the duration of the event.

This is much easier done via dedicated monitoring tools, where the GUI will often give you a tree view of the blocking.

Does Query Store Help?


In SQL Server 2017, we got some high level wait stats associated with queries.

These are generally more helpful to identify which queries were being blocked, but still not who was doing the blocking.

Regular wait stats (i.e. from sys.dm_os_wait_stats) have no association to the queries that caused them.

If you’re on SQL Server 2017 or better, and you’re using Query Store, you can get a look at those waits with a query like this:

SELECT   qsws.wait_category_desc,
         SUM(qsws.total_query_wait_time_ms) / 1000. AS total_query_wait_time_s,
         AVG(qsws.avg_query_wait_time_ms) / 1000. AS avg_query_wait_time_s,
         MAX(qsws.max_query_wait_time_ms) / 1000. AS max_query_wait_time_s
FROM     sys.query_store_wait_stats AS qsws
GROUP BY qsws.wait_category_desc
ORDER BY total_query_wait_time_s DESC;

The view of your wait stats is far less detailed, but at least it’s only this one database. Look, at least you get that.

With that out of the way, let’s take that simple query and make a couple minor adjustments to get some other information out.

WITH qs_waits AS (
SELECT   qsws.wait_category_desc,
         qsws.plan_id,
         SUM(qsws.total_query_wait_time_ms) / 1000. AS total_query_wait_time_s,
         AVG(qsws.avg_query_wait_time_ms) / 1000. AS avg_query_wait_time_s,
         MAX(qsws.max_query_wait_time_ms) / 1000. AS max_query_wait_time_s
FROM     sys.query_store_wait_stats AS qsws
WHERE qsws.wait_category_desc = 'Lock'
GROUP BY qsws.wait_category_desc, qsws.plan_id
)
SELECT qsw.*,
       r.*,
       p.query_sql_text,
       TRY_CONVERT(XML, p.query_plan) AS query_plan
FROM qs_waits AS qsw
OUTER APPLY
(
    SELECT TOP (1) qsp.plan_id,
                   qsp.query_plan,
                   qsqt.query_sql_text
    FROM sys.query_store_plan AS qsp
    JOIN sys.query_store_query AS qsq
        ON qsq.query_id = qsp.query_id
    JOIN sys.query_store_query_text AS qsqt
        ON qsq.query_text_id = qsqt.query_text_id
    WHERE qsw.plan_id = qsp.plan_id
    ORDER BY qsp.last_execution_time DESC
) AS p
OUTER APPLY
(
    SELECT TOP (1) qsrs.avg_duration / 1000. AS avg_duration, 
                   qsrs.avg_cpu_time / 1000. AS avg_cpu_time
    FROM sys.query_store_runtime_stats AS qsrs
    WHERE qsrs.plan_id = p.plan_id
    ORDER BY qsrs.last_execution_time DESC
) AS r;

There we go.

Nice, clean, simple, but most important totally intuitive. I love how easy it is to quickly get the information you want.

?

Lookin’ For Locks


That query will get information about queries which waited on Locks — that’s why we’re getting plan_id up in our CTE.

After that, we’re getting the plan and text of any queries that waited on locks, and a couple vanity metrics.

SQL Server Query Results
Growing Away

Only one query waited on locks. Make a couple notes here, though:

  • avg_query_wait_time is 21 seconds
  • avg_query_duration is 21 seconds
  • avg_cpu_time is 0.12 seconds

My workload is Highly Contrived™ so the avg wait and query duration line up. In real life, you probably won’t have queries that were only ever waiting on locks to be released.

But it’s worth making some comparisons like this when you’re having blocking problems, especially when you tie wait times and durations in with cpu time.

If cpu is very low but duration is high, generally, you’ve found blocked queries.

SQL Server Query Plan
Collectiving

Looking at the text and plan, we can also reasonably surmise that this read query wasn’t blocking anything.

But Still…


This doesn’t tell us what query was blocking the select. If you want to figure that out, you’ve got some options:

Sure, you could also go digging through DMVs to find modification queries that last ran around the same time, but I’ve hit a lot of dead ends there.

A lot of this pain would go away if SQL Server were optimistic by default, or if you’re allowed to enable an optimistic isolation level.

And remember: Queries taking locks don’t register locking waits. Only queries being blocked register locking waits.

Thanks for reading!

Going Further


If this is the kind of SQL Server stuff you love learning about, you’ll love my training. I’m offering a 75% discount to my blog readers if you click from here. I’m also available for consulting if you just don’t have time for that and need to solve performance problems quickly.

SQL Server Index Choice and Batch Mode On Rowstore

A/B Testing


Let’s look at a pretty simple query against the Votes table:

SELECT v.VoteTypeId, 
       MIN(v.CreationDate) AS min_creation_date,
       MAX(v.CreationDate) AS max_creation_date,
       COUNT_BIG(*) AS records
FROM dbo.Votes AS v
GROUP BY v.VoteTypeId
ORDER BY v.VoteTypeId;

There are only two columns involved:

  • VoteTypeId, which we’re grouping on
  • CreationDate, which we’re finding min and max values for

There are two different ways to approach this:

CREATE INDEX even_steven 
    ON dbo.Votes(VoteTypeId, CreationDate);

CREATE INDEX steven_even 
    ON dbo.Votes(CreationDate, VoteTypeId);

But first, let’s look at the query with just the clustered index, which is on the Id column, not mentioned at all in the query.

We’ll call this our baseline.

SQL Server Query Plan
You’re a great time.

This takes 2 seconds.

Even Steven


With an index on VoteTypeId, CreationDate, what happens?

SQL Server Query Plan
Well that uh. Took 5 seconds.

It’ll take 5 seconds no matter how many times I run it.

This might sound like a very good index though, because even though we don’t have a where clause looking for VoteTypeIds, we’re grouping by them.

Having CreationDate next in the index key should make it really easy to find a min and max value for each VoteTypeId, because CreationDate will be in order.

And you know what? That sort of works out. We get a Stream Aggregate in the plan without a Sort operator.

But it still sucks: Why?

Steven Even


With this index, we go right back to… What we had before.

SQL Server Query Plan
Mediocrity has many names.

We went through all the trouble of adding indexes, to have one be slower, and one not get us any faster than just using the clustered index.

What gives?

Teenage Angst


I’ve been avoiding something a little bit, dear reader. You see, I’m using SQL Server 2019.

The first plan and the third plan — the ones that finished in 2 seconds — they both used batch mode on rowstore. That’s an Enterprise Edition optimizer feature available in compat level 150.

If you were to run this on SQL Server 2017 or earlier, you would find no measurable difference between any one of these queries.

And look, batch mode on row store does represent a good improvement in many cases for large aggregation queries — the type of queries that would benefit from columnstore in general — and maybe in places where you’re unable to use columnstore today because you’re also using triggers, cursors, Replication, or another feature that it disagrees with.

If you suddenly saw a 60% improvement in some of your “big” queries, you’d probably be pretty happy. I’m not saying it comes for free, or that it’s a magickal world where everything is perfect for every query now.

You can only get that if you have PLAN GUIDES FOR EVERY QUERY. H ah aa ah ah ha a.

But let’s consider something else


It only kicked in when our indexes were lacking.

When we had a “good index”, SQL Server chose a plan with no batch-y mode-y at all.

If you’ve carefully crafted some indexes over the years, even a sure shot for the type of query you want to get some batch mode love may not see it.

Remember: It only gets used if your query is tall enough to ride.

Thanks for reading!

Going Further


If this is the kind of SQL Server stuff you love learning about, you’ll love my training. I’m offering a 75% discount to my blog readers if you click from here. I’m also available for consulting if you just don’t have time for that and need to solve performance problems quickly.

Using Exchange Demand Partitioning to Improve Parallel Query Scalability In SQL Server

One of our SQL Server workloads runs many concurrent parallel queries on a possibly already busy server. Other work occurring on the server can have dramatic effects on parallel query runtimes. One way to improve scalability of parallel query runtimes is to achieve query plans with operators that allow a dynamic amount of work to be completed by each parallel worker thread. For example, exchange operators with a partitioning type of hash or round robin force a typically even amount of work to be completed by each worker thread. If a worker thread happens to be on a busy scheduler then query runtime may increase due to the longer runtime of the worker thread that is competing for CPU resources. Serial zones in parallel query plans can of course have the same problem. Batch mode operators, exchange operators with a partitioning type of broadcast or demand, and the parallel page supplier are all examples of operators which can do a dynamic amount of work per thread. Those are the operators that I prefer to see in query plans for this workload.

Very little has been written about exchange operators with a partitioning type of demand, so I forgive you for not hearing of it before today. There is a brief explanation available here, an example of using demand partitioning to improve some query plans involving partitioned tables, and a Stack Exchange answer for someone comparing round robin and demand partitioning. You have the honor of reading perhaps the fourth blog post about the subject.

Start


The demos are somewhat dependent on hardware so you may not see identical results if you are following along. I’m testing on a machine with 8 CPU and with max server memory was set to 6000 MB. Start with a table with a multi-column primary key and insert about 34 million rows into it:

DROP TABLE IF EXISTS #;
CREATE TABLE # (
ID BIGINT NOT NULL,
ID2 BIGINT NOT NULL,
STRING_TO_AGG VARCHAR(MAX),
PRIMARY KEY (ID, ID2)
);

INSERT INTO # WITH (TABLOCK)
SELECT RN, v.v, REPLICATE('REPLICATE', 77)
FROM (
SELECT TOP (4800000) ROW_NUMBER() OVER (ORDER BY (SELECT NULL)) RN
FROM master..spt_values
CROSS JOIN master..spt_values t2
) q
CROSS JOIN (VALUES (1), (2), (3), (4), (5), (6), (7)) v(v);

The query tuning exercise is to insert the ID column and a checksum of the concatenation of all the STRING_TO_AGG values for each ID value ordered by ID2. This may seem like an odd thing to do but it is based upon a production example with an adjustment to not write as much data as the real query. Not all of us have SANs in our basements, or even have a basement. Use the following for the target table:

DROP TABLE IF EXISTS ##;

CREATE TABLE ## (
ID BIGINT NOT NULL,
ALL_STRINGS_CHECKSUM INT
);

Naturally we use SQL Server 2019 CU4 so the STRING_AGG function is available to us. Here is one obvious way to write the query:

INSERT INTO ## WITH (TABLOCK)
SELECT ID, CHECKSUM(STRING_AGG(STRING_TO_AGG , ',') WITHIN GROUP (ORDER BY ID2))
FROM #
GROUP BY ID
OPTION (MAXDOP 8);

The above query takes about 63 seconds on my machine with a cost of 2320.57 optimizer units. The query optimizer decided that a serial plan was the best choice:

SQL Server Query Plan

This is a rather lame result for a query tuning exercise so I will assume that I know better and force a parallel query plan with undocumented trace flag 8649. SQL Server warns us that the estimated cost is 4816.68 optimizer units but surely doesn’t expect a detail like that to stop me. The adjusted query executes in 75 seconds:

SQL Server Query Plan

My arrogance is checked. The parallel query is slower than the serial version that the query optimizer wanted us to have. The problem is the hash exchange operator. It is an order preserving exchange with a high MAXDOP and wide rows. This is the worst possible situation for exchange performance. How else can we write the query? Batch mode is not available for STRING_AGG so that’s out. Does anyone remember anything about tuning row mode queries?

The Dark Side


Query hints along with carefully constructed T-SQL are the pathway to many abilities, some considered to be unnatural. We can give the classic Parallel Apply query pattern made famous by Adam Machanic a shot to solve this problem. Perhaps you are thinking that there is no driving table for the outer side of a nested loop join, but we can create one by sampling the clustered index of the base table. I’ll skip that part here and just use what I know about the data to divide it into 96 equal ranges:

DROP TABLE IF EXISTS ###;
CREATE TABLE ### (s BIGINT NOT NULL, e BIGINT NOT NULL);

INSERT INTO ###
VALUES
(1, 50000),
(50001, 100000),
(100001, 150000),
(150001, 200000),
(200001, 250000),
(250001, 300000),
(300001, 350000),
(350001, 400000),
(400001, 450000),
(450001, 500000),
(500001, 550000),
(550001, 600000),
(600001, 650000),
(650001, 700000),
(700001, 750000),
(750001, 800000),
(800001, 850000),
(850001, 900000),
(900001, 950000),
(950001, 1000000),
(1000001, 1050000),
(1050001, 1100000),
(1100001, 1150000),
(1150001, 1200000),
(1200001, 1250000),
(1250001, 1300000),
(1300001, 1350000),
(1350001, 1400000),
(1400001, 1450000),
(1450001, 1500000),
(1500001, 1550000),
(1550001, 1600000),
(1600001, 1650000),
(1650001, 1700000),
(1700001, 1750000),
(1750001, 1800000),
(1800001, 1850000),
(1850001, 1900000),
(1900001, 1950000),
(1950001, 2000000),
(2000001, 2050000),
(2050001, 2100000),
(2100001, 2150000),
(2150001, 2200000),
(2200001, 2250000),
(2250001, 2300000),
(2300001, 2350000),
(2350001, 2400000),
(2400001, 2450000),
(2450001, 2500000),
(2500001, 2550000),
(2550001, 2600000),
(2600001, 2650000),
(2650001, 2700000),
(2700001, 2750000),
(2750001, 2800000),
(2800001, 2850000),
(2850001, 2900000),
(2900001, 2950000),
(2950001, 3000000),
(3000001, 3050000),
(3050001, 3100000),
(3100001, 3150000),
(3150001, 3200000),
(3200001, 3250000),
(3250001, 3300000),
(3300001, 3350000),
(3350001, 3400000),
(3400001, 3450000),
(3450001, 3500000),
(3500001, 3550000),
(3550001, 3600000),
(3600001, 3650000),
(3650001, 3700000),
(3700001, 3750000),
(3750001, 3800000),
(3800001, 3850000),
(3850001, 3900000),
(3900001, 3950000),
(3950001, 4000000),
(4000001, 4050000),
(4050001, 4100000),
(4100001, 4150000),
(4150001, 4200000),
(4200001, 4250000),
(4250001, 4300000),
(4300001, 4350000),
(4350001, 4400000),
(4400001, 4450000),
(4450001, 4500000),
(4500001, 4550000),
(4550001, 4600000),
(4600001, 4650000),
(4650001, 4700000),
(4700001, 4750000),
(4750001, 4800000);

I can now construct a query that gets a parallel apply type of plan:

INSERT INTO ## WITH (TABLOCK)
SELECT ca.*
FROM ### driver
CROSS APPLY (
	SELECT TOP (987654321987654321) ID, CHECKSUM(STRING_AGG(STRING_TO_AGG , ',') WITHIN GROUP (ORDER BY ID2)) ALL_STRINGS_CHECKSUM
	FROM # WITH (FORCESEEK)
	WHERE ID BETWEEN driver.s AND driver.e
	GROUP BY ID
) ca
OPTION (MAXDOP 8, NO_PERFORMANCE_SPOOL, FORCE ORDER);

This is an unnatural query plan. The query optimizer assigned it a cost of 36248.7 units. I had to add the TOP to get a valid query plan with an index seek. Removing the TOP operator results in error 8622. Naturally such things won’t stop us and running the query results in an execution time between 15 – 19 seconds on my machine which is the best result yet.

SQL Server Query Plan

This query plan has an exchange partitioning type of round robin. Recall such exchange types can lead to trouble if there’s other work executing on one of the schedulers used by a parallel worker thread. So far I’ve been testing these MAXDOP 8 queries with nothing else running on my 8 core machine. I can make a scheduler busy by running a MAXDOP 1 query that has no real reason to yield before exhausting its 4 ms quantum. Here is one way to accomplish that:

SELECT TOP (1) t1.high + t2.high + t3.high + t4.high
FROM master..spt_values t1
CROSS JOIN master..spt_values t2
CROSS JOIN master..spt_values t3
CROSS JOIN master..spt_values t4
ORDER BY t1.high + t2.high + t3.high + t4.high
OPTION (MAXDOP 1, NO_PERFORMANCE_SPOOL);

Wait stats for this query if you don’t believe me:

SQL Server Wait Stats

Running this query at the same time as the parallel query can apply a large performance penalty to the parallel query. The parallel query can take up to 48 seconds to execute if even a single worker thread has to share time on a scheduler with another. That is, the query ran 3 times slower when I added a single MAXDOP 1 query to the workload. Looking at thread details for the parallel query:
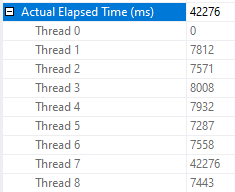
SQL Server Threads

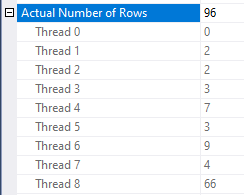
As you can see, one of the worker threads took a significantly longer amount of time to complete its work compared to the other threads. There is no logged wait statistic for this kind of performance problem in which the other parallel worker threads complete their work much earlier than when the query finishes. If there’s no worker thread then there is no wait associated with the query. The only way to catch this is to look at actual row distribution or the CPU time to elapsed time ratio.

You may be wondering why the query is worse than twice as slow as before. After all, if all workers do an equal amount of work but one now gets access to half as much CPU as before it seems reasonable to expect the runtime to double instead of triple. The workers of the parallel query have many reasons they might yield before exhausting their full 4 ms quantum – an I/O wait for example. The MAXDOP 1 SELECT query is designed to not yield early. What is very likely happening is that the MAXDOP 1 query gets a larger share of the scheduler’s resources than 50%. SQL Server 2016 made adjustments to try to limit this type of situation but by its very nature I don’t see how it could ever lead to a perfect sharing of a scheduler’s resources.

Demanding Demand Partitioning


We can get an exchange operator with demand based partitioning by replacing the driving temp table with a derived table. Full query text below:

INSERT INTO ## WITH (TABLOCK)
SELECT ca.*
FROM (
VALUES
(1, 50000),
(50001, 100000),
(100001, 150000),
(150001, 200000),
(200001, 250000),
(250001, 300000),
(300001, 350000),
(350001, 400000),
(400001, 450000),
(450001, 500000),
(500001, 550000),
(550001, 600000),
(600001, 650000),
(650001, 700000),
(700001, 750000),
(750001, 800000),
(800001, 850000),
(850001, 900000),
(900001, 950000),
(950001, 1000000),
(1000001, 1050000),
(1050001, 1100000),
(1100001, 1150000),
(1150001, 1200000),
(1200001, 1250000),
(1250001, 1300000),
(1300001, 1350000),
(1350001, 1400000),
(1400001, 1450000),
(1450001, 1500000),
(1500001, 1550000),
(1550001, 1600000),
(1600001, 1650000),
(1650001, 1700000),
(1700001, 1750000),
(1750001, 1800000),
(1800001, 1850000),
(1850001, 1900000),
(1900001, 1950000),
(1950001, 2000000),
(2000001, 2050000),
(2050001, 2100000),
(2100001, 2150000),
(2150001, 2200000),
(2200001, 2250000),
(2250001, 2300000),
(2300001, 2350000),
(2350001, 2400000),
(2400001, 2450000),
(2450001, 2500000),
(2500001, 2550000),
(2550001, 2600000),
(2600001, 2650000),
(2650001, 2700000),
(2700001, 2750000),
(2750001, 2800000),
(2800001, 2850000),
(2850001, 2900000),
(2900001, 2950000),
(2950001, 3000000),
(3000001, 3050000),
(3050001, 3100000),
(3100001, 3150000),
(3150001, 3200000),
(3200001, 3250000),
(3250001, 3300000),
(3300001, 3350000),
(3350001, 3400000),
(3400001, 3450000),
(3450001, 3500000),
(3500001, 3550000),
(3550001, 3600000),
(3600001, 3650000),
(3650001, 3700000),
(3700001, 3750000),
(3750001, 3800000),
(3800001, 3850000),
(3850001, 3900000),
(3900001, 3950000),
(3950001, 4000000),
(4000001, 4050000),
(4050001, 4100000),
(4100001, 4150000),
(4150001, 4200000),
(4200001, 4250000),
(4250001, 4300000),
(4300001, 4350000),
(4350001, 4400000),
(4400001, 4450000),
(4450001, 4500000),
(4500001, 4550000),
(4550001, 4600000),
(4600001, 4650000),
(4650001, 4700000),
(4700001, 4750000),
(4750001, 4800000)
) driver( s, e)
CROSS APPLY (
	SELECT TOP (987654321987654321) ID, CHECKSUM(STRING_AGG(STRING_TO_AGG , ',') WITHIN GROUP (ORDER BY ID2)) ALL_STRINGS_CHECKSUM
	FROM # WITH (FORCESEEK)
	WHERE ID BETWEEN CAST(driver.s AS BIGINT) AND CAST(driver.e AS BIGINT)
	GROUP BY ID
) ca
OPTION (MAXDOP 8, NO_PERFORMANCE_SPOOL, FORCE ORDER);

Query performance is effectively random. The query was observed to execute as quickly as 15 seconds and as slowly as 45 seconds. In some situations there was an incredible amount of skew in row distributions between threads:

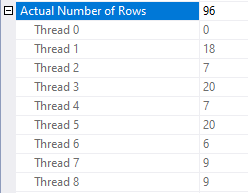
SQL Server Threads

SQL Server Threads

SQL Server Threads

This is an unexpected situation if there are no other queries running on the server. Query performance is most disappointing.

Is there a trace flag?


Yes! The problem here is that the nested loop join uses the prefetch optimization. Paul White writes:

One of the available SQL Server optimizations is nested loops prefetching. The general idea is to issue asynchronous I/O for index pages that will be needed by the inner side — and not just for the current correlated join parameter value, but for future values too.

That sounds like it might be wildly incompatible with a demand exchange operator. Querying sys.dm_exec_query_profiles during query execution proves that the demand exchange isn’t working as expected: worker threads no longer fully process the results associated with their current row before requesting the next one. That is what can lead to wild skew between the worker threads and as a result query performance is effectively random.

Documented trace flag 8744 disables this optimization. Adding it to the query using QUERYTRACEON results in much more stable performance. The query typically finishes in about 15 seconds. Here is an example thread distribution:
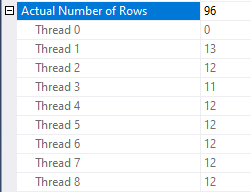
SQL Server Threads

If you fight the ISV fight like I do, you may not be able to enable trace flags for individual queries. If you’re desperate you could try artificially lowering the cardinality estimate from the derived table. An OPTIMIZE FOR query hint with a direct filter is my preferred way to accomplish this. I like to set the cardinality estimate equal to MAXDOP but I have no real basis for doing this. Here is the full query text:

DECLARE @filter BIGINT = 987654321987654321;
INSERT INTO ## WITH (TABLOCK)
SELECT ca.*
FROM (
VALUES
(1, 50000),
(50001, 100000),
(100001, 150000),
(150001, 200000),
(200001, 250000),
(250001, 300000),
(300001, 350000),
(350001, 400000),
(400001, 450000),
(450001, 500000),
(500001, 550000),
(550001, 600000),
(600001, 650000),
(650001, 700000),
(700001, 750000),
(750001, 800000),
(800001, 850000),
(850001, 900000),
(900001, 950000),
(950001, 1000000),
(1000001, 1050000),
(1050001, 1100000),
(1100001, 1150000),
(1150001, 1200000),
(1200001, 1250000),
(1250001, 1300000),
(1300001, 1350000),
(1350001, 1400000),
(1400001, 1450000),
(1450001, 1500000),
(1500001, 1550000),
(1550001, 1600000),
(1600001, 1650000),
(1650001, 1700000),
(1700001, 1750000),
(1750001, 1800000),
(1800001, 1850000),
(1850001, 1900000),
(1900001, 1950000),
(1950001, 2000000),
(2000001, 2050000),
(2050001, 2100000),
(2100001, 2150000),
(2150001, 2200000),
(2200001, 2250000),
(2250001, 2300000),
(2300001, 2350000),
(2350001, 2400000),
(2400001, 2450000),
(2450001, 2500000),
(2500001, 2550000),
(2550001, 2600000),
(2600001, 2650000),
(2650001, 2700000),
(2700001, 2750000),
(2750001, 2800000),
(2800001, 2850000),
(2850001, 2900000),
(2900001, 2950000),
(2950001, 3000000),
(3000001, 3050000),
(3050001, 3100000),
(3100001, 3150000),
(3150001, 3200000),
(3200001, 3250000),
(3250001, 3300000),
(3300001, 3350000),
(3350001, 3400000),
(3400001, 3450000),
(3450001, 3500000),
(3500001, 3550000),
(3550001, 3600000),
(3600001, 3650000),
(3650001, 3700000),
(3700001, 3750000),
(3750001, 3800000),
(3800001, 3850000),
(3850001, 3900000),
(3900001, 3950000),
(3950001, 4000000),
(4000001, 4050000),
(4050001, 4100000),
(4100001, 4150000),
(4150001, 4200000),
(4200001, 4250000),
(4250001, 4300000),
(4300001, 4350000),
(4350001, 4400000),
(4400001, 4450000),
(4450001, 4500000),
(4500001, 4550000),
(4550001, 4600000),
(4600001, 4650000),
(4650001, 4700000),
(4700001, 4750000),
(4750001, 4800000)
) driver( s, e)
CROSS APPLY (
	SELECT TOP (987654321987654321) ID, CHECKSUM(STRING_AGG(STRING_TO_AGG , ',') WITHIN GROUP (ORDER BY ID2)) ALL_STRINGS_CHECKSUM
	FROM # WITH (FORCESEEK)
	WHERE ID BETWEEN CAST(driver.s AS BIGINT) AND CAST(driver.e AS BIGINT)
	GROUP BY ID
) ca
WHERE driver.s <= @filter
OPTION (OPTIMIZE FOR (@filter = 350001), MAXDOP 8, NO_PERFORMANCE_SPOOL, FORCE ORDER);

Query performance is the same as with TF 8744:

SQL Server Query Plan


Does this query do better than round robin partitioning when there is a busy MAXDOP 1 query running at the same time? I ran it a few times and it completed in about 15-16 seconds every time. One of the worker threads does less work and the others cover for it:
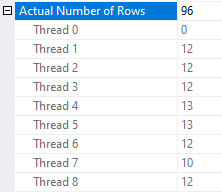
SQL Server Threads

In this example the nested loop join only gets the prefetch optimization if the cardinality estimate is more than 25 rows. I do not know if that number is a fixed part of the algorithm for prefetch eligibility but it certainly feels unwise to rely on this behavior never changing in a future version of SQL Server. Note that prefetching is a trade-off. For some workloads you may be better off with round robin partitioning and prefetching compared to demand without prefetching. It’s hard to imagine a workload that would benefit from demand with prefetching but perhaps I’m not being creative enough in my thinking.

Final Thoughts


In summary, the example parallel apply query that uses demand partitioning performs 2-3 times better the query that uses round robin partitioning when another serial query is running on the server. The nested loop prefetch optimization does not work well witth exchange operator demand partitioning and should be avoided via a trace flag or other tricks if demand partitioning is in use.

There are a few things that Microsoft could do to improve the situation. A USE HINT that disables nested loop prefetching would be most welcome. I think that there’s also a fairly strong argument to make that a query pattern of a nested loop join with prefetching with a first child of a demand exchange operator is a bad pattern that the query optimizer should avoid if possible. Finally, it would be nice if there was a type of wait statistic triggered when some of a parallel query’s workers finish their work earlier than others. The problematic queries here have very little CXPACKET waits and no EXECSYNC waits. Imagine that I put a link to UserVoice requests here and imagine yourself voting for them.

Thanks for reading!

Going Further


If this is the kind of SQL Server stuff you love learning about, you’ll love my training. I’m offering a 75% discount to my blog readers if you click from here. I’m also available for consulting if you just don’t have time for that and need to solve performance problems quickly.

How Too Many Indexes Can Hurt SQL Server’s Transaction Log

Watch It


Going Further


If this is the kind of SQL Server stuff you love learning about, you’ll love my training. I’m offering a 75% discount to my blog readers if you click from here. I’m also available for consulting if you just don’t have time for that and need to solve performance problems quickly.
How Are Table Variables Different In SQL Server 2019?

WallaWallaBingBang


Going Further


If this is the kind of SQL Server stuff you love learning about, you’ll love my training. I’m offering a 75% discount to my blog readers if you click from here. I’m also available for consulting if you just don’t have time for that and need to solve performance problems quickly.
Yet Another Post About Local Variables In SQL Server

If I Ruled The World


Normally, I link people to this post by Kendra and this post by Paul when I need to point them to information about what goes wrong with local variables. They’re both quite good, but I wanted something a little more specific to the situation I normally see with people locally, along with some fixes.

First, some background:

In a stored procedure (and even in ad hoc queries or within dynamic SQL, like in the examples linked above), if you declare a variable within that code block and use it as a predicate later, you will get either a fixed guess for cardinality, or a less-confidence-inspiring estimate than when the histogram is used.

The local variable effect discussed in the rest of this post produces the same behavior as the OPTIMIZE FOR UNKNOWN hint, or executing queries with sp_prepare. I have that emphasized here because I don’t want to keep qualifying it throughout the post.

That estimate will be based on the number of rows in the table, and the “All Density” of the column multiplied together, for single equality predicates. The process for multiple predicates depends on which cardinality estimation model you’re using.

That can be viewed by using DBCC SHOW_STATISTICS.

CREATE INDEX flubber
    ON dbo.Posts(OwnerUserId);

DBCC SHOW_STATISTICS(Posts, flubber);
SQL Server Statistics
Injury

For example, this query using a single local variable with a single equality:

DECLARE @oui INT = 22656;
SELECT COUNT(*) FROM dbo.Posts AS p WHERE p.OwnerUserId = @oui;

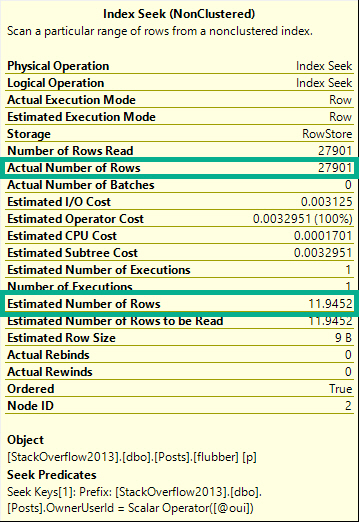
Will get an estimate of 11.9-ish, despite 27,901 rows matching over here in reality.

SQL Server Query Plan Tool Tip
Poo

Which can be replicated like so, using the numbers from the screenshot up yonder.

SELECT (6.968291E-07 * 17142169) AS [?]

Several Different Levels

You can replicate the “All Density” calculation by doing this:

SELECT (1 / 
         CONVERT(FLOAT, COUNT(DISTINCT p.OwnerUserId))
         ) AS [All Density]
FROM Posts AS p
GO

Notice I didn’t call the estimate “bad”. Even though it often is quite bad, there are some columns where the distribution of values will be close enough to this estimate for it not to matter terribly for plan shape, index choice, and overall performance.

Don’t take this as carte blanche to use this technique; quite the opposite. If you’re going to use it, it needs careful testing across a variety of inputs.

Why? Because confidence in estimates decreases as they become based on less precise information.

In these estimates we can see a couple optimizer rules in action:

  • Inclusion: We assume the value is there — the alternative is ghastly
  • Uniformity: The data will have an even distribution of unique values

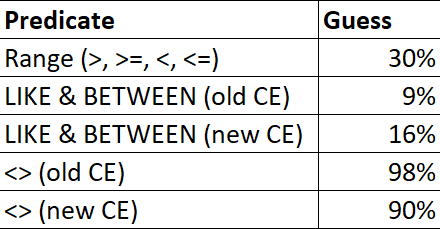
For ranges (>, >=, <, <=), LIKE, BETWEEN, and <>, there are different fixed guesses.

SQL Server Query Plans
Destined for Lateness

These numbers may change in the future, but up through 2019 this is what my testing resulted in.

Heck, maybe this behavior will be alterable in the future :^)

No Vector, No Estimate

A lot of people (myself included) will freely interchange “estimate” and “guess” when talking about this process. To the optimizer, there’s a big difference.

  • An estimate represents a process where math formulas with strange fonts that I don’t understand are used to calculate cardinality.
  • A guess represents a breakdown in that process, where the optimizer gives up, and a fixed number is used.

Say there’s no “density vector” available for the column used in an equality predicate. Maybe you have auto-create stats turned off, or stats created asynchronously is on for the first compilation.

You get a guess, not an estimate.

ALTER DATABASE StackOverflow2013 SET AUTO_CREATE_STATISTICS OFF;
GO 

DECLARE @oui INT = 22656;
SELECT COUNT(*) FROM dbo.Posts AS p WHERE p.OwnerUserId = @oui;
SELECT COUNT(*) FROM dbo.Posts AS p WHERE p.OwnerUserId = @oui OPTION(USE HINT('FORCE_LEGACY_CARDINALITY_ESTIMATION'));
GO 

ALTER DATABASE StackOverflow2013 SET AUTO_CREATE_STATISTICS ON;
GO

Using the new cardinality estimator (CE), which Microsoft has quite presumptuously started calling the Default CE, I get a guess of 4,140.

Using the legacy CE, which maybe I’ll start referring to as the Best CE, to match the presumptuousness of Microsoft, I get a guess of 266,409.

Though neither one is particularly close to the reality of 27,901 rows, we can’t expect a good guess because we’re effectively poking the optimizer in the eyeball by not allowing it to create statistics, and by using a local variable in our where clause.

These things would be our fault, regardless of the default-ness, or best-ness, of the estimation model.

If you’re keen on calculating these things yourself, you can do the following:

SELECT POWER(CONVERT(FLOAT, 17142169), 0.75) AS BEST_CE;
SELECT SQRT(CONVERT(FLOAT, 17142169)) AS default_ce_blah_whatever;

Other Guesses?

There may be additional circumstances where you’ll get a 10% cardinality estimate for equality predicates too, if you read this post by the lovely and talented Fabiano Amorim.

Take these two queries:

SELECT COUNT_BIG(*) 
FROM dbo.Posts AS p 
WHERE p.CreationDate = p.CommunityOwnedDate;

SELECT COUNT_BIG(*) 
FROM dbo.Posts AS p 
WHERE p.CreationDate = p.CommunityOwnedDate 
OPTION(USE HINT('FORCE_LEGACY_CARDINALITY_ESTIMATION'));

The so-called “default” CE thinks 1,714,220 rows will match for a column-equals-column comparison, and the “legacy” CE thinks 6.44248 rows will match, assuming that histograms are available for both of these queries.

How many actually match? 59,216.

I never said this was easy, HOWEVER!

Ahem.

The “legacy” CE estimate comes from advanced maths that only people who vape understand, while the so-called “default” CE just guesses ten percent, in true lazybones fashion. “You treat your stepmother with respect, Pantera!“, as a wise man once said.

Second, what we want to happen:

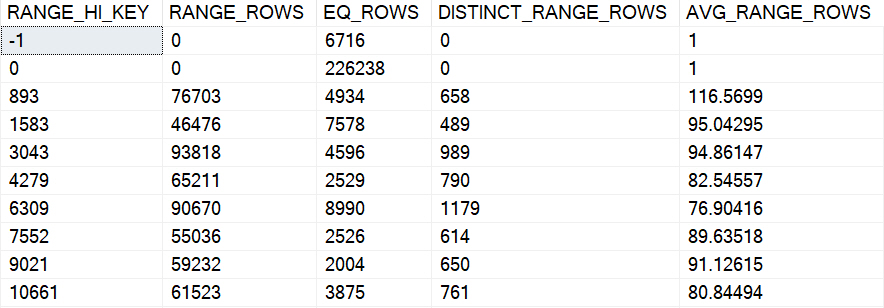
Code that uses literals, parameters, and other sniff-able forms of predicates use the statistics histogram, which typically has far more valuable information about data distribution for a column. No, they’re not always perfect, and sure, estimates can still be off if we use this, but that’s a chance I’m willing to take.

Even if they’re out of date. Maybe. Maybe not.

Look, just update those statistics.

SQL Server Statistics
American Histogram X

Like I mentioned before, these estimates typically have higher confidence levels because they’re often based on more precise details about the data.

If I had to rank them:

  1. Direct histogram step hits for an equality
  2. Intra-step hits for an equality
  3. Direct histogram step hits for a range
  4. Intra-step hits for a range
  5. Inequalities (not equals to)
  6. Joins
  7. 1000 other things
  8. All the goofy stuff you people do to make this more difficult, like wrapping columns in functions, mismatching data types, using local variables, etc.

Of course, parameterized code does open us up to parameter sniffing issues, which I’m not addressing in this post. My only goal here is to teach people how to get out of performance jams caused by local variables giving you bad-enough estimates. Ha ha ha.

Plus, there’s a lot of negativity out there already about parameter sniffing. A lot of the time it does pretty well, and we want it to happen.

Over-Under


The main issues with the local variable/density vector estimates is that they most often don’t align well with reality, and they’re almost certainly a knee-jerk reaction to a parameter sniffing problem, or done out of ignorance to the repercussions. It would be tedious to walk through all of the potential plan quality issues that could arise from doing this, though I did record a video about one of them here.

Instead of doing all that stuff, I’d rather walk through what works and what doesn’t when it comes to fixing the problem.

But first, what doesn’t work!

Temporary Objects Don’t Usually Work

If you put the value of the local variable in a #temp table, you can fall victim to statistics caching. If you use a @table variable, you don’t get any column-level statistics on what values go in there (even with a recompile hint or trace flag 2453, you only get table cardinality).

There may be some circumstances where a #temp table can help, or can get you a better plan, but they’re probably not my first stop on the list of fixes.

  • The #temp table will require a uniqueness constraint to work
  • This becomes more and more difficult if we have multiple local variables to account for
  • And if they have different data types, we need multiple #temp tables, or wide tables with a column and constraint per parameter

From there, we end up with difficulties linking those values in our query. Extra joins, subqueries, etc. all have potential consequences.

Inline Table Valued Functions Don’t Work

They’re a little too inline here, and they use the density vector estimate. See this gist for a demo.

Recompile Can Work, But Only Do It For Problem Statements

It has to be a statement-level recompile, using OPTION(RECOMPILE). Putting recompile as a stored procedure creation option will not allow for parameter embedding optimizations, i.e. WITH RECOMPILE.

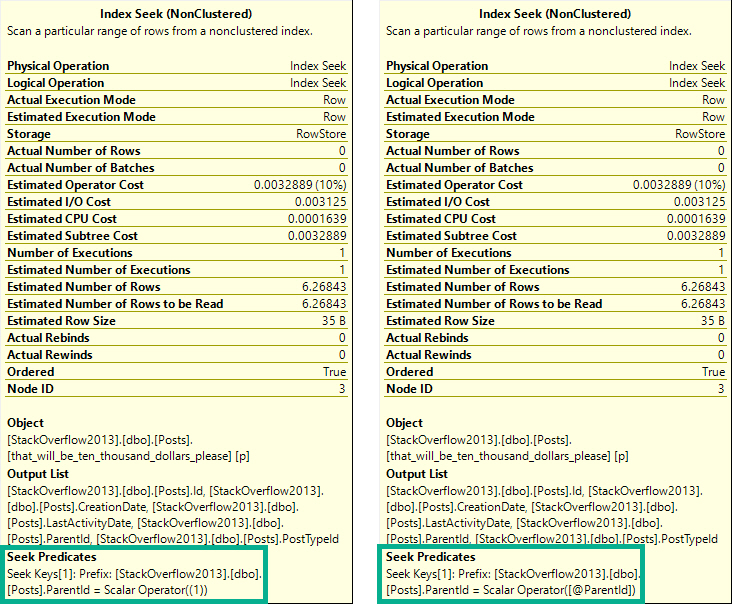
SQL Server Query Plan Tool Tips
One of these things is not like the other.

The tool tip on the left is from a plan with a statement-level recompile. On the right is from a plan with a procedure-level recompile. In the statement-level recompile plan, we can see the scalar operator is a literal value. In the procedure-level recompile, we still see @ParentId passed in.

The difference is subtle, but exists. I prefer statement-level recompiles, because it’s unlikely that every statement in a procedure should or needs to be recompiled, unless it’s a monitoring proc or something else with no value to the plan cache.

Targeting specific statements is smarterer.

Erer.

A more detailed examination of this behavior is at Paul’s post, linked above.

Dynamic SQL Can Work

Depending on complexity, it may be more straight forward to use dynamic SQL as a receptacle for your variables-turned-parameters.

CREATE PROCEDURE dbo.game_time(@id INT) 
AS BEGIN 
    DECLARE @id_fix INT; 
    SET @id_fix = CASE WHEN @id < 0 THEN 1 ELSE @id END; 
    
    DECLARE @sql NVARCHAR(MAX) = N''; 
    SET @sql += N'SELECT COUNT(*) FROM dbo.Posts AS p WHERE p.OwnerUserId = @id;'; 
    
    EXEC sys.sp_executesql @sql, N'@id INT', @id_fix 
END;

Separate Stored Procedures Can Work

If you need to declare variables internally and perform some queries to assign values to them, passing them on to separate stored procedures can avoid the density estimates. The stored procedure occurs in a separate context, so all it sees are the values passed in as parameters, not their origins as variables.

In other words, parameters can be sniffed; variables can’t.

CREATE PROCEDURE dbo.game_time(@id INT)
AS
BEGIN
    DECLARE @id_fix INT;
    SET @id_fix = CASE WHEN @id < 0 THEN 1 ELSE @id END;
    
    EXEC dbo.some_new_proc @id_fix;
END;

Just pretend the dynamic SQL from above occupies the stored procedure dbo.some_new_proc here.

Optimizing For A Value Can Work

But choosing that value is hard. If one is feeling ambitious, one could take the local parameter value, compare it to the histogram on one’s own, then choose a value on one’s own that, one, on their own, could use to determine if a specific, common, or nearby value would be best to optimize for, using dynamic SQL that one has written on one’s own.

Ahem.

CREATE PROCEDURE dbo.game_time(@id INT) 
AS BEGIN 
    DECLARE @id_fix INT; 
    SET @id_fix = CASE WHEN @id < 0 THEN 1 ELSE @id END; 
    
    DECLARE @a_really_good_choice INT;
    SET @a_really_good_choice = 2147483647; --The result of some v. professional code IRL.

    DECLARE @sql NVARCHAR(MAX) = N''; 
    SET @sql += N'SELECT COUNT(*) FROM dbo.Posts AS p WHERE p.OwnerUserId = @id OPTION(OPTIMIZE FOR(@id = [a_really_good_choice]));'; 
    SET @sql = REPLACE(@sql, N'[a_really_good_choice]', @a_really_good_choice);

    EXEC sys.sp_executesql @sql, N'@id INT', @id_fix;
END; 
GO


Wrapping Up


This post aimed to give you some ways to avoid getting bad density vector estimates with local variables. If you’re getting good guesses, well, sorry you had to read all this.

When I see this pattern in client code, it’s often accompanied by comments about fixing parameter sniffing. While technically accurate, it’s more like plugging SQL Server’s nose with cotton balls and Lego heads.

Sometimes there will be several predicate filters that diminish the impact of estimates not using the histogram. Often a fairly selective predicate evaluated first is enough to make this not suck too badly. However, it’s worth learning about, and learning how to fix correctly.

Thanks for reading!

Going Further


If this is the kind of SQL Server stuff you love learning about, you’ll love my training. I’m offering a 75% discount to my blog readers if you click from here. I’m also available for consulting if you just don’t have time for that and need to solve performance problems quickly.