The SQL Server Documentation About Parallelism Is Misleading

Free Work


Recently I answered a question on Stack Exchange that forced me to read the Microsoft documentation about query parallelism.

When I first read the question, and wrote the answer, I thought for sure that the OP was just misreading things, but no… the documentation was indeed misleading.

And then I had to read more of the documentation, and then I had to write demos to show what I’m talking about.

If you’re on the docs team and you’re reading this, don’t get mad because it’s in a blog post instead of a pull request. I made one of those, too.

Y’all have a lot of work to do, and putting all of this into a pull request or issue would have been dismal for me.

If you want to follow along, you can head to this link.

Constructs


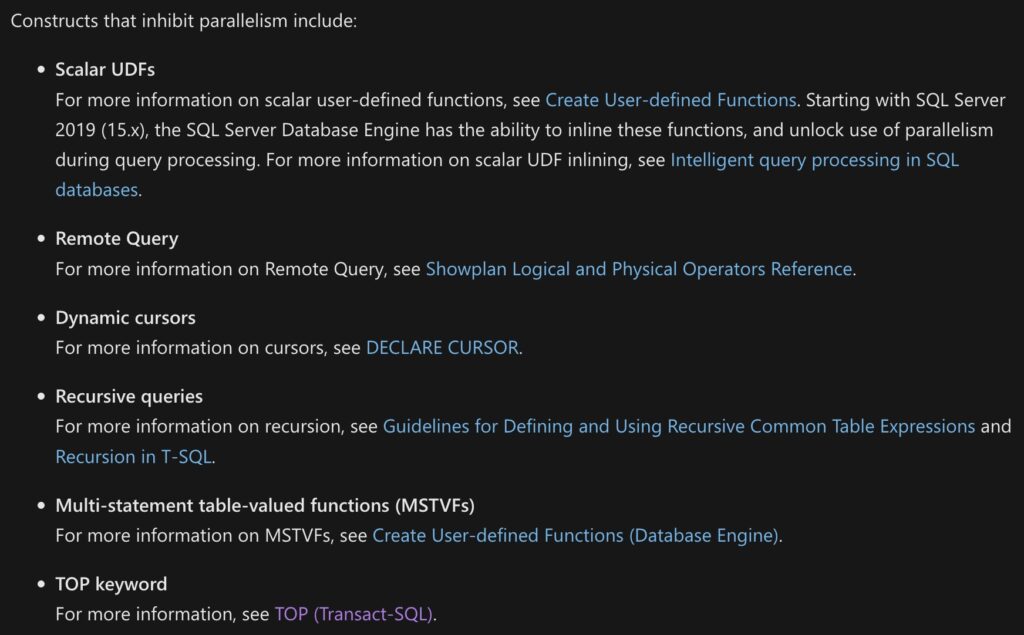
The section with the weirdest errors and omissions is right up at the top. I’m going to post a screenshot of it, because I don’t want the text to appear here in a searchable format.

That might lead people not reading thoroughly to think that I condone any of it, when I don’t.
SQL Server Documentation
0 for 6

Let’s walk through these one by one.

Scalar UDFs


While it’s true that scalar UDFs that can’t be inlined will force the query that calls them to run single-threaded, the work done inside of the scalar UDF is still eligible for parallelism.

This is important, because anyone looking at query wait stats while troubleshooting might see CX* waits for an execution plan that is forced to run single threaded by a UDF.

Here’s a function written with a Common Table Expression, which prevents UDF inlining from taking place.

CREATE OR ALTER FUNCTION
    dbo.AnteUp
(
    @UserId int
)
RETURNS integer
WITH SCHEMABINDING
AS
BEGIN
    DECLARE
        @AnteUp bigint = 0;

    WITH
        x AS
    (
        SELECT
            p.Score
        FROM dbo.Posts AS p
        WHERE p.OwnerUserId = @UserId
          UNION ALL
        SELECT
            c.Score
        FROM dbo.Comments AS c
        WHERE c.UserId = @UserId
    )
    SELECT
        @AnteUp =
            SUM(CONVERT(bigint, x.Score))
    FROM x AS x;

    RETURN @AnteUp;
END;

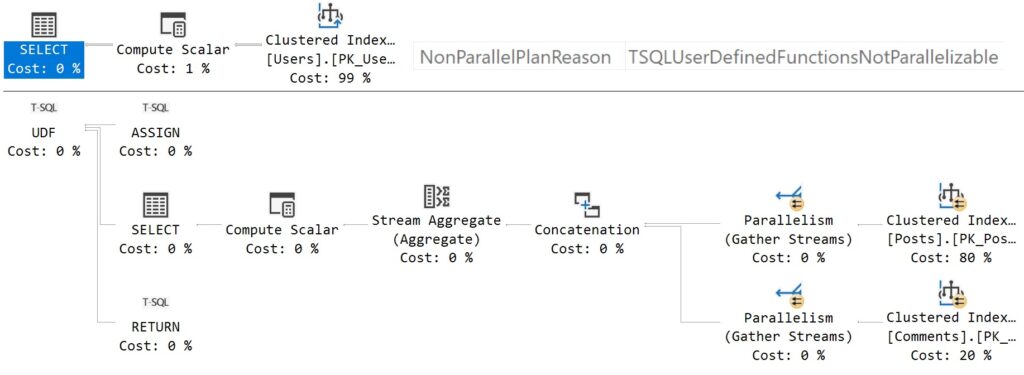
Getting the estimated execution plan for this query will show us a parallel zone within the function body.

SELECT
    u.DisplayName,
    TotalScore =
        dbo.AnteUp(u.AccountId)
FROM dbo.Users AS u
WHERE u.Reputation >= 500000;

If you get an actual execution plan, you can’t see the work done by the scalar UDF. This is sensible, since the function can’t be inlined, and the UDF would run once per row, which would also return a separate query plan per row.

For functions that suffer many invocations, SSMS may crash.
SQL Server Query Plan
query and function

The calling query runs single threaded with a non-parallel execution plan reason, but the body of the function scans both tables that it touches in a parallel zone.

The documentation is quite imprecise in this instance, and many of the others in similar ways.

Remote Queries


This one is a little tough to prove, and I’ll talk about why, but the parallelism restriction is only on the local side of the query. The portion of the query that executes remotely can use a parallel execution plan.

The reasons why this is hard to prove is that getting the execution plan for the remote side of the query doesn’t seem to be an easy thing to accomplish.

I couldn’t find a cached execution plan for my attempts, nor could I catch the query during execution with a query plan attached to it using the usual methods.

Here’s what I did instead:

  • Create a loopback linked server
  • Clear wait stats
  • Query wait stats
  • Run my linked server/openquery query
  • Query wait stats again

Here’s the linked server:

DECLARE 
    @ServerName sysname = 
    (
        SELECT 
            CONVERT
            (
                sysname, 
                SERVERPROPERTY(N'ServerName')
            )
    );

EXEC sp_addlinkedserver 
    @server = N'loop',
    @srvproduct = N' ',
    @provider = N'SQLNCLI', 
    @datasrc = @ServerName;
GO

Here’s the query stuff:

DBCC SQLPERF('sys.dm_os_wait_stats', CLEAR);
GO 

SELECT
    dows.wait_type,
    dows.waiting_tasks_count,
    dows.wait_time_ms,
    dows.max_wait_time_ms,
    dows.signal_wait_time_ms
FROM sys.dm_os_wait_stats AS dows
WHERE dows.wait_type LIKE N'CX%'
ORDER BY dows.wait_time_ms DESC;
GO 

SELECT TOP (1000)
    u.Id
FROM loop.StackOverflow2013.dbo.Users AS u
ORDER BY
    u.Reputation
GO
SELECT 
    u.*
FROM
OPENQUERY
(
    loop,
    N'
        SELECT TOP (1000)
            u.Id,
            u.Reputation
        FROM loop.StackOverflow2013.dbo.Users AS u
        ORDER BY
        	u.Reputation;
    '
) AS u;
GO

SELECT
    dows.wait_type,
    dows.waiting_tasks_count,
    dows.wait_time_ms,
    dows.max_wait_time_ms,
    dows.signal_wait_time_ms
FROM sys.dm_os_wait_stats AS dows
WHERE dows.wait_type LIKE N'CX%'
ORDER BY dows.wait_time_ms DESC;

You can quote in/out either the linked server or the OPENQUERY version, but each time a consistent amount of parallel query waits were returned by the second wait stats query.

Given that this is a local instance with no other activity, I’m pretty confident that I’m right here.

Dynamic Cursors


It is true that dynamic cursors will prevent a parallel execution plan, but the documentation leaves out that fast forward cursors will also do that.

That does get noted in the table of non-parallel execution plan reasons decoder ring a little further down, but it’s odd here because only one type of cursor is mentioned, and the cursor documentation itself doesn’t say anything about which cursors inhibit parallelism.

Bit odd since there’s a note that tells you that you can learn more by going there.

DECLARE
    ff CURSOR FAST_FORWARD
FOR
SELECT TOP (1)
    u.Id
FROM dbo.Users AS u
ORDER BY u.Reputation DESC

OPEN ff;

FETCH NEXT 
FROM ff;

CLOSE ff;
DEALLOCATE ff;

Anyway, this cursor gives us this execution plan:

SQL Server Cursor Query Plan
out of luck

Which has a non parallel execution plan reason that is wonderfully descriptive.

Recursive Queries


This is only partially true. The “recursive” part of the CTE cannot use a parallel execution plan (blame the Stack Spool or something), but work done outside of the recursive common table expression can.

Consider this query, with a recursive CTE, and then an additional join outside of the portion that achieved maximum recursion.

WITH
    p AS
(
    SELECT
        p.Id,
        p.ParentId,
        p.OwnerUserId,
        p.Score
    FROM dbo.Posts AS p
    WHERE p.Id = 184618

    UNION ALL

    SELECT
        p2.Id,
        p2.ParentId,
        p2.OwnerUserId,
        p2.Score
    FROM p
    JOIN dbo.Posts AS p2
      ON p.Id = p2.ParentId
)
SELECT
    p.*,
    u.DisplayName,
    u.Reputation
FROM p
JOIN dbo.Users AS u
  ON u.Id = p.OwnerUserId
ORDER BY p.Id;

In this execution plan, the join to the Users table is done in a parallel zone after the recursive common table expression “completes”:

SQL Server Query Plan
that’s a thing.

These do not force a totally serial execution plan, as the documentation suggests.

Multi-Statement Table Valued Functions


This is another area where the documentation seems to indicate that a completely serial execution plan is forced by invoking a multi-statement table valued function, but they don’t do that either.

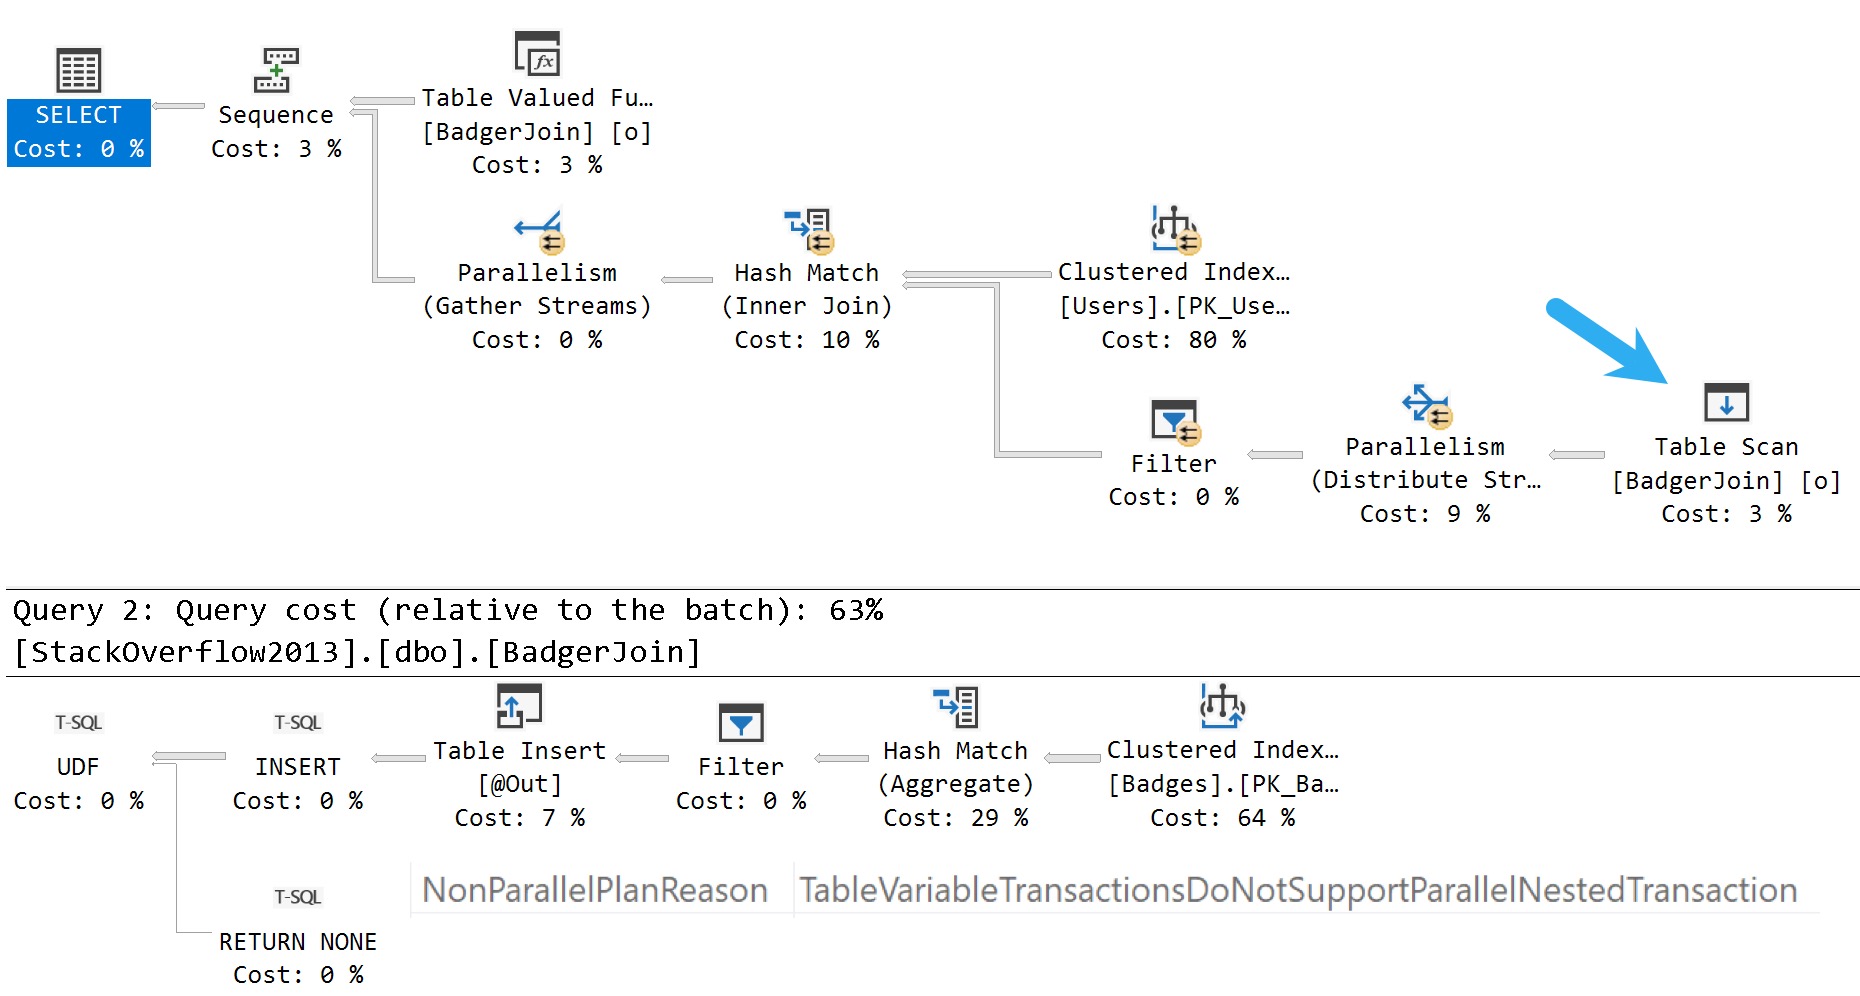
They only force a serial zone in the execution plan, both where the table variable is populated, and later returned by the functions. Table variables read from outside of multi-statement table valued functions, and even table variables used elsewhere in the function’s body may be read from in a parallel zone, but the returned table variable does not support that.

Here’s a function:

CREATE OR ALTER FUNCTION
    dbo.BadgerJoin
(
    @h bigint
)
RETURNS
    @Out table
(
    UserId int,
    BadgeCount bigint
)
AS
BEGIN
    INSERT INTO
        @Out
    (
        UserId,
        BadgeCount
    )
    SELECT
        b.UserId,
        BadgeCount =
            COUNT_BIG(*)
    FROM dbo.Badges AS b
    GROUP BY b.UserId
    HAVING COUNT_BIG(*) > @h;
    RETURN;
END;

Here’s a query that calls it:

SELECT
    u.Id,
    o.*
FROM dbo.Users AS u
JOIN dbo.BadgerJoin(0) AS o
    ON o.UserId = u.Id
WHERE u.LastAccessDate >= '20180901';

And here’s the query execution plan:
SQL Server Query Plan
hard knocks life

Again, only a serial zone in the execution plan. The table variable modification does force a serial execution plan, but that is more of a side note and somewhat unrelated to the documentation.

Completion is important.

Top


Finally, the TOP operator is documented as causing a serial execution plan, but it’s only the TOP operator that doesn’t support parallelism.

Consider this query:

SELECT
    *
FROM
(
    SELECT TOP (1)
        u.*
    FROM dbo.Users AS u
    ORDER BY 
        u.Reputation DESC,
        u.Id
) AS u
INNER JOIN
(
    SELECT TOP (1)
        u.*
    FROM dbo.Users AS u
    ORDER BY 
        u.Reputation DESC,
        u.Id
) AS u2
  ON u.Id = u2.Id
ORDER BY
    u.Reputation,
    u2.Reputation;

Both of the derived selects happen fully in parallel zones, but there is a gather streams operator prior to each top operator, to end each parallel zone.

SQL Server Query Plan
DOUBLE TOP!

It would be a little silly to re-parallelize things after the tops going into the nested loops join, but you probably get the point.

You may see some query execution plans where there is a parallel zone, a gather streams operator, a top operator, and then a distribute streams operator to reinitialize parallelism out in the wild.

This is almost no different than global aggregates which also cause serial zones in query plans. Take this query for example:

SELECT 
    s = SUM(x.r)
FROM 
(
    SELECT 
        r = COUNT(*)
    FROM dbo.Users AS u
    WHERE u.Age < 18

    UNION ALL

    SELECT 
        r = COUNT(*)
    FROM dbo.Users AS u
    WHERE u.Age IS NULL
) AS x;

Which gives us this query plan, where each count operation (stream aggregate) occurs in a serial zone immediately after gather streams.

SQL Server Query Plan
vlad

But no one’s getting all riled up and shouting that from the docs pages.

Afterthoughts


There are some other areas where the documentation is off, and it’s a shame that Microsoft didn’t choose to link to the series of index build strategy posts that it has had published locally since ~2006 or so.

But hey. It’s not like the internet is forever, especially when it comes to Microsoft content.

I’ve also submitted a pull request to address other issues in the documentation.

Thanks for reading!

Going Further


If this is the kind of SQL Server stuff you love learning about, you’ll love my training. I’m offering a 75% discount to my blog readers if you click from here. I’m also available for consulting if you just don’t have time for that, and need to solve database performance problems quickly. You can also get a quick, low cost health check with no phone time required.

Why Parallel Queries are Sometimes Slow In SQL Server

You may have noticed large variations in elapsed time for parallel queries while performing query tuning or observing a production workload. This post reviews some of the possible explanations for those variations. I’m testing on SQL Server 2022 RC0 but this behavior can be observed on all currently supported versions of SQL Server.

The Setup

The test data is very simple. Insert ten million sequential integers into a single column table with a clustered index:

CREATE TABLE dbo.ParallelTest (
Id BIGINT NOT NULL,
CONSTRAINT PK_ParallelTest PRIMARY KEY (Id)
);

INSERT INTO dbo.ParallelTest (Id)
SELECT [value]
FROM GENERATE_SERIES(1, 10000000);

Now consider the following query:

SELECT SUM(a.ID + b.ID) s
FROM dbo.ParallelTest a
INNER JOIN dbo.ParallelTest b ON a.ID = b.ID
OPTION (USE HINT ('DISALLOW_BATCH_MODE'));

The query optimizer naturally picks a merge join for this query. The self-joined tables obviously have the same row count and the data is already sorted. That makes this query an ideal candidate for a serial merge join from the optimizer’s point of view . The USE HINT in the query isn’t particularly important and the example works without it, but its presence will be explained later. Here’s what the query plan looks like for me:

The query takes 2721 ms of CPU time and elapsed time to execute on my machine. It’s reasonable for CPU and elapsed time to match here because there’s nothing for the query to wait on. It’s the only user query running against the SQL instance. Next I’ll force a parallel merge join query plan by changing the query hints to the following:

SELECT SUM(a.ID + b.ID) s
FROM dbo.ParallelTest a
INNER JOIN dbo.ParallelTest b ON a.ID = b.ID
OPTION (MAXDOP 8, MERGE JOIN, USE HINT('ENABLE_PARALLEL_PLAN_PREFERENCE', 'DISALLOW_BATCH_MODE'));

I chose MAXDOP 8 because my test machine has 8 physical CPU cores. This is an unnatural query plan with a higher parallel cost than serial cost. The query optimizer only picked it because it was forced to. Note the presence of the exchange operators with a relatively high estimated cost:

The parallel query takes 6465 ms of CPU time and 1723 ms of elapsed time to execute on my machine. It finished about 33% faster than the serial query but CPU time more than doubled. The exchange operators added a large overhead for this query. Next I’ll run the same query again but I’ll make one of my CPUs busier than before. Consider the following infinite loop coded as a stored procedure:

CREATE OR ALTER PROCEDURE #p AS
SET NOCOUNT ON;
DECLARE @i INT;
WHILE 1 = 1
SET @i = 0;
GO

EXEC #p;

This code does not accomplish anything besides efficiently using CPU resources, which is exactly what I need for my test. I’m running the merge query at MAXDOP 8 on a machine with 8 CPU cores so I’m pretty much guaranteed to see scheduler contention for some of the workers of the parallel query. They will compete for CPU resources with the infinite loop.

Take a moment to predict the performance penalty that the parallel query will experience due to the busy scheduler. Will it be 2X slower? 3X slower? Worse? For a few hints, recall that hash distributed exchange operators will generally try to force an equal amount of work to each thread. Also recall that a parallel merge join requires order-preserving exchange operators. I’ve included Erik running at MAXDOP 8 to hopefully prevent you from accidentally seeing the answer before you’ve finalized your prediction.

With the busy scheduler, the query now takes 6818 ms of CPU time and 31745 ms of elapsed time to execute on my machine. The same code is over 18X slower simply due to the highly efficient stored procedure that’s running on the same SQL instance. Here are the query wait stats in case they are of interest:

<Wait WaitType=”CXPACKET” WaitTimeMs=”454673″ WaitCount=”5262″ />
<Wait WaitType=”CXSYNC_PORT” WaitTimeMs=”32539″ WaitCount=”41″ />
<Wait WaitType=”CXSYNC_CONSUMER” WaitTimeMs=”43″ WaitCount=”14″ />

scheduler_ring_buffer_recorded

This is an inappropriately brief introduction to a complex topic, but workers cooperate with each other by sharing time on schedulers. Under normal conditions, a worker will execute code on the scheduler for up to 4 milliseconds before yielding. The worker yields in case there’s another worker waiting to execute on the scheduler. When there’s not the original worker immediately starts executing code again. An example of when a worker yields early is if it needs to wait for an I/O operation.

scheduler_ring_buffer_recorded is the name of a debug extended event that you should probably never use. I often don’t follow my own advice, so I used it to get an idea of how often workers were yielding to the scheduler for the merge join queries. I only looked at action types of “SCHEDULER_NONPREEMPTIVE_RESUME” and I admit that this analysis is quite approximate. For the MAXDOP 1 query, there was a total of 705 events over 2872 milliseconds. In other words, the average time spent on the scheduler before yielding is close to the 4 ms soft maximum. This should be expected for the serial query if all of the data is in the buffer pool. There is no memory grant for the query (the reason for the USE HINT) and there’s not really any reason to yield early.

The parallel query had significantly more yields. Looking at one worker thread as an example, it had 14862 events over 1714 milliseconds. In other words, it had around 35 times the number of scheduler yields compared to the MAXDOP 1 query. The higher number of yields is a performance liability when competing with workers from other queries on the same scheduler. The infinite loop stored procedure dominates the workers from the parallel and gets around 97% of the cpu time on the scheduler. That’s a big part of why the parallel query is 18X slower than before.

Note that you can also get this information by looking at the yield_count column of the sys.dm_of_schedulers DMV, but those numbers are server wide and aren’t isolated to one query. With that said, I did get reasonably similar results when comparing that column to the extended event results.

To summarize, parallel query performance overhead isn’t as simple as just the direct overhead of the exchange operators. A query changing from serial to parallel can result in completely different interactions between the workers and the scheduler. The serial query executed its code 4 milliseconds at a time. The parallel query had to yield significantly more often. This type of change isn’t something that you can directly observe in a query plan.

Why Parallel Queries are Sometimes Slow

There are many reasons why a parallel query may not be as efficient as you hoped. I find these to be the most common:

1) There is an overhead associated with parallel exchange operators which is not present in serial queries. Moving data between worker threads requires additional CPU time which adds to the overall execution time of the query. I believe this is what is described by the following quote from the documentation:

Simple queries, frequently found in transaction processing applications, find the additional coordination required to execute a query in parallel outweigh the potential performance boost.

2) There’s some kind of additional coordination required between threads which delays query completion. For example, an order-preserving repartition streams operator is generally worse for performance than one that doesn’t need to preserve order. A different type of example can be seen in my blog post about slow parallel scans caused by cloud storage.

3) Work may be unevenly distributed between worker threads. For example, an eager index spool can only be built with one thread. Other threads may be idle while that temporary index is built. For a different example, a filtered parallel scan of a table may not output the same number of rows to all threads. All else being equal, a parallel query that cannot use all of the CPUs allowed by MAXDOP is not as efficient as one that can.

4) Work may be evenly distributed between worker threads but some of the CPUs are busier than others. Some parallel queries are as slow as their busiest CPU, even when queries are evenly sharing time on the scheduler. Of course, dramatic performance penalties can be seen when the parallel query gets an uneven amount of time on the scheduler (like in the demo in this blog post).

Mitigations

Individual parallel query performance can degrade due to contention on a single scheduler that’s used by one or more of its workers. You are more likely to run into problems with higher DOP or a higher number of concurrent queries. Lowering MAXDOP decreases the odds that you’ll run into the worst type of contention because the query uses fewer schedulers. Decreasing the number of queries decreases contention per scheduler which also helps.

To explain it in a different way, the simplest way to reduce problems with parallel queries is to have fewer worker threads per scheduler. This is of course a balancing act, but it’s one that you must perform for some workloads. Set Cost Threshold for Parallelism and server/database/resource governor MAXDOP appropriately. When possible, don’t run too many concurrent queries for your hardware.

For very important queries for which performance is critical, consider changing to a type of parallelism that isn’t as susceptible to scheduler contention issues. The two most common methods are a parallel apply pattern, perhaps using demand partitioning, or batch mode execution.

Batch mode is yet another complicated topic that I’m not going to explain here, but it uses a fundamentally different method of parallelism compared to row-mode execution which is generally much more robust against problems caused by busy schedulers. Below is a comparison of elapsed times with and without the infinite loop stored procedure running:

The elapsed time of the parallel batch mode query only changes slightly. This is also a nice property when considering overall server scalability.

Final Thoughts

I was going to originally blog about DOP feedback, but it’s taking a while for my feedback to kick in. Thanks for reading!

What’s The Point Of DOP Feedback In SQL Server 2022?

Loud Engine


If you’re ever on a long flight and want something to fall asleep to, ask a DBA how to set MAXDOP.

Sometimes I even ask myself that question when I’m tossing and turning at night.

There are a lot of things to consider when fixing settings globally across a workload. For parallelism, it’s less about individual query performance, and more about overall server/workload performance

After all, letting every query go as absolutely parallel as possible is only good up to a point; that point is usually when you start regularly running out of worker threads, or your CPUs could double as crematoriums.

Setting MAXDOP is about limiting the damage that a parallel workload can do to a server. The expectation is that a query running at DOP 8 will run 8x faster than a query running at DOP 1.

But setting MAXDOP for every query isn’t something you catch even the most persnickety performance tuners doing. Perhaps some of the more critical ones, but you know…

Let Me Rust


I’m not going to demo DOP feedback in this post, I’m just going to show you the situation that it hopes to improve upon.

To do that, I’m going to run a simple aggregation query at different degrees of parallelism, and show you the changes in query timing.

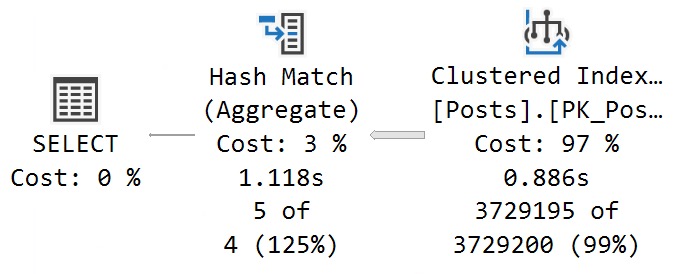
At DOP 1:

The query runs for 1.1 seconds, with 886ms consumed while scanning the Posts table.

SQL Server Query Plan
DOPPER DON

At DOP 2:

The query runs just about twice as fast, starting with the scan of the Posts table taking about half as long. This is good scaling. Add one CPU, go twice as fast as you did with one CPU.

SQL Server Query Plan
Rip Van Winkle

At DOP 4:

The gets about twice as fast again! The scan of the Posts table is now down to 263ms, and the query in total is at 330ms. Adding in two more cores seems a good choice, here.

SQL Server Query Plan
Bed Rock

At DOP 8:

The query no longer continues to get 2x faster. This isn’t a knock against DOP 8 in general; my query just happens to hit a wall around DOP 4. With 4 additional CPUs, we only save ~130ms at the end of the day.

SQL Server Query Plan
Anubis

Why This Is Cool


This new feature will help DBAs have to worry less about getting MAXDOP absolutely right across the board. Who knows, we may even see a day where MAXDOP is left at zero.

But you’d never skip that installer step, would you?

Anyway, for anyone out there who is paranoid about setting DOP too high, this should help your queries find a more approximately-good middle ground.

Hopefully it works as advertised.

Thanks for reading!

Going Further


If this is the kind of SQL Server stuff you love learning about, you’ll love my training. I’m offering a 75% discount to my blog readers if you click from here. I’m also available for consulting if you just don’t have time for that and need to solve performance problems quickly.

SQL Server 2022 Finally Adds Actual Non Parallel Plan Reasons To Query Plans

Wayback Machine


SQL Server query plans have had, forever, pretty generic reasons embedded in the XML for why your query was prevented from going parallel.

Not for things like it not breaking the Cost Threshold For Parallelism barrier, which should be obvious to the end user, but certainly for things like scalar UDFs, etc.

The thing is, the reason always seemed to be “Could Not Generate Valid Parallel Plan” for most of them, even though more explicit reasons were available.

They started cropping up, as things do, in Azure SQL DB, and have finally made it to the box product that we all know and mostly love.

Let’s explore some of them! Because that’s what we do.

Generate Valid Blog Post


First, some intrinsic functions prevent a parallel plan. You can always see the reason (if one exists) if you look in the properties of the root operator in the query plan.

SQL Server Query Plan Properties
not for you!

Some Intrinsic Functions

An easy one to validate this with is OBJECT_NAME

SELECT
    c = OBJECT_NAME(COUNT_BIG(*))
FROM dbo.Posts AS p;

For this, we’ll see this show up:

NonParallelPlanReason="NonParallelizableIntrinsicFunction"

Setting MAXDOP To One

This was one of the few reasons that was generally available going back to SQL Server 2012:

SELECT
    c = COUNT_BIG(*)
FROM dbo.Posts AS p
OPTION(MAXDOP 1);

And obviously:

NonParallelPlanReason="MaxDOPSetToOne"

Table Variable Modifications

Here’s a sneaky one that I’ve been trying to warn folks about forever:

DECLARE
    @c table 
(
    c bigint
);

INSERT
    @c
(
    c
)
SELECT
    c = COUNT_BIG(*)
FROM dbo.Posts AS p;

Bit of a mouthful, but hopefully this makes things quite perfectly clear:

NonParallelPlanReason="TableVariableTransactionsDoNotSupportParallelNestedTransaction"

Fast Forward Cursors

There’s always some hijinks about with cursors, but here you go:

DECLARE 
    @c bigint;

DECLARE 
    c CURSOR 
    FAST_FORWARD 
FOR 
SELECT
    c = COUNT_BIG(*)
FROM dbo.Posts AS p;

OPEN c;

FETCH NEXT 
FROM 
    c
INTO 
    @c;

CLOSE c;
DEALLOCATE c;
GO

This is another reason that I have seen around for a while too, but we may as well be thorough:

NonParallelPlanReason="NoParallelFastForwardCursor"

Scalar Functions That Can’t Be Inlined

Shocking, I know! I know.

CREATE OR ALTER FUNCTION
    dbo.c
(
    @c bigint
)
RETURNS bigint
WITH SCHEMABINDING, RETURNS NULL ON NULL INPUT
AS  
BEGIN
    DECLARE /*Ruin UDF inlining with one weird trick*/
        @gd datetime = GETDATE();    
    RETURN @c;
END;
GO 

SELECT
    c = dbo.c(COUNT_BIG(*))
FROM dbo.Posts AS p;

And from the XML:

NonParallelPlanReason="TSQLUserDefinedFunctionsNotParallelizable"

Groovy


Fun stuff is always in XML. Just think about all the best times in your life. I bet XML was involved.

Now when you look at it, it will tell you what’s screwing up parallel plan generation in your SQL Server queries.

J’accuse, as they say.

Thanks for reading!

Going Further


If this is the kind of SQL Server stuff you love learning about, you’ll love my training. I’m offering a 75% discount to my blog readers if you click from here. I’m also available for consulting if you just don’t have time for that and need to solve performance problems quickly.

Common SQL Server Consulting Advice: Setting MAXDOP And Cost Threshold For Parallelism

Dirty Work


There are three classes of administrator when it comes to parallelism settings

  • Never changed the defaults
  • Changed the defaults to something wacky
  • Changed the defaults to something safe

The beginning of this post is for the first couple of genus of administrator.

Even though Microsoft added a MAXDOP calculation to the installer starting with SQL Server 2016, I’ve seen cases where the recommended setting was wrong because hardware changed after the initial config.

As an example: Your VM admin created the smallest possible machine to get things set up for you, and added CPU and memory later on, and you ended up with MAXDOP set to 1.

The installer still doesn’t let you change Cost Threshold For Parallelism at setup, which is plum bizarre. I get why making a recommendation here is hard (and I’ll talk about that later on), but you should at least give folks the option.

I want to add this here, before we get too far along: The point of adjusting these values is not “because there’s too much parallelism” or “because there’s too much CX… waits”. The goal is to increase concurrency by only allowing queries that benefit from parallelism to use it, because parallel queries can reserve many CPU threads (DOP * parallel branches), and if you throw enough of them at a server you can end up running out of worker threads, and hitting THREADPOOL waits.

Some folks do Good Enough© with the stock advice of a max degree of parallelism of 4 to 8, and cost threshold for parallelism of 50. Others have a harder time finding a sweet spot that properly balances performance and concurrency.

But you need to start somewhere.

If you truly have no idea how to change these settings, review these example commands, but don’t just blindly run them.

EXEC sys.sp_configure
    @configname = 'show advanced options',
    @configvalue = 1;
RECONFIGURE;

EXEC sys.sp_configure
    @configname = 'cost threshold for parallelism',
    @configvalue = 50;
RECONFIGURE;

EXEC sys.sp_configure
    @configname = 'max degree of parallelism',
    @configvalue = 8;
RECONFIGURE;

Read the rest of the post first.

Evaluating


The easy way to see your settings and if they’re relatively sane is like so:

SELECT
    c.name,
    c.value,
    c.value_in_use,
    c.description,
    socket_count = 
        CASE c.name
             WHEN N'max degree of parallelism'
             THEN osi.socket_count
             ELSE NULL
        END, 
    cores_per_socket = 
        CASE c.name
             WHEN N'max degree of parallelism'
             THEN osi.cores_per_socket
             ELSE NULL
        END
FROM sys.configurations AS c
CROSS JOIN
(
    SELECT 
        osi.socket_count,
        osi.cores_per_socket
    FROM sys.dm_os_sys_info AS osi
) AS osi
WHERE c.name IN 
(
    N'cost threshold for parallelism',
    N'max degree of parallelism'
);

Whenever I query sys.configurations, I get the value and value in use, because sometimes folks forget to run RECONFIGURE; after they change something.

But back to the point! Whatcha got here?

  • Is Cost Threshold For Parallelism a number higher than 5 and lower than 200?
  • Is Max Degree Of Parallelism an even number between 4 and 8?

If so, you probably don’t need to make any changes here, unless something else is going on.

And hey, if you’ve got one of those really awful vendor products that tells you to set MAXDOP to one, you should be using database scoped configurations for that, these days.

For most folks, this will get you to an okay place. You may have some other considerations based on the number of cores and/or sockets, and that can get pretty confusing.

Changing these setting will clear out the plan cache, so you should be a little careful when you do it, but you don’t need to restart or anything.

Thinking Harder About Cost Threshold For Parallelism


Many folks who end up here are already pretty sophisticated when it comes to SQL Server, and I’d hate to leave them hanging.

Let’s talk more about each setting, and how they interact with your server and queries.

First up, alphabetically, is cost threshold for parallelism. Right now, you can only set it at the server level. You can technically remove it from the equation by:

  • Setting MAXDOP to 1
  • Using undocumented trace flag 8649, or…
  • Using undocumented query hint ENABLE_PARALLEL_PLAN_PREFERENCE to force a parallel plan

It would be neat if you could set it at the database level, like MAXDOP, but whatever.

One thing that comes up consistently when talking about this setting is that folks often see parallel queries with costs lower than the cost threshold for parallelism. All that means is that the serial query plan broke the threshold, and the parallel plan was chosen because it was cheaper. Cheaper can be lower than cost threshold for parallelism.

When a query executes, assuming there isn’t some parallelism-inhibiting factor in place (scalar UDFs, table variable inserts, etc.), it has to “cost” more than this threshold for a parallel plan to get considered. If it does, and the optimizer can come up with a parallel plan that’s cheaper than the serial plan, then you can pretty well count on it being chosen.

This is where things get tricky! Right off the bat!

See, query costs are all estimates, and there’s no actual counterpart to them in your query plans. If you’re anything like me, you’ve probably seen some low “cost” queries run for a really long time.

Many things contribute to pinning this setting down being difficult:

  • Incorrect assumptions about too much of a CX wait (this goes for MAXDOP too)
  • Untuned workloads having consistently high cost queries
  • Wasting time looking at the plan cache for average costs
  • Changing the setting not having an appreciable effect
  • Misunderstanding what costs actually mean

What does it all mean for you? Well, usually increasing the setting from the default — which is 5 — to a meaningfully higher number, will reduce the total number of queries that are eligible for a parallel plan.

This doesn’t mean performance is doomed for those queries, heck, they may not have needed a parallel plan to begin with. The optimizer is pretty good at costing queries generally. But it’s not perfect, and that’s where generalized workload settings need to be overridden or changed.

Having fewer queries be eligible for gobbling up a whole bunch of CPU threads is one way of increasing overall concurrency. Individual query performance may change for better or worse, and you may need to raise or lower the number you picked here, but that’s part of the process.

Thinking Harder About Max Degree Of Parallelism


The second option you have to address concurrency and performance issues stemming from parallelism is setting an upper limit on the number of cores, and threads per parallel branch that a parallel query is allowed to engage and acquire.

In a way, this setting is a little easier to settle on than Cost Threshold for Parallelism, but there are some things you should be aware of:

  • The parallel version of a plan isn’t just the serial version with parallelism; you can end up with a very different set of operators
  • The optimizer may choose a serial plan if DOP is set too low for a parallel plan to make sense
  • Whatever you set DOP to, parallel plans will use at least one extra coordinator thread to manage DOP threads
  • Leaving this set to zero is only really dangerous on servers with > 8 cores
  • Setting this to an odd number is generally not a good global setting, though it can be useful in edge cases for a single query

There have been times when I’ve suggested MAXDOP of 4 on servers with a single 8 core processor, but that was mostly a temporary fix until some more meaningful tuning work could be done.

It’s okay to use these settings as band aids, just don’t let them be habit-forming.

How can you tell if a parallel query plan is effective, and how can you decide if you need higher or lower DOP? Great question(s)! Look at you. I’m so proud.

  • If your parallel and serial plans have roughly equivalent CPU and duration, the parallel plan isn’t better
  • If your parallel plan isn’t anywhere near DOP faster than your serial query, the parallel plan probably isn’t better
  • If your parallel plan hits exchange spills or deadlocks, buckle up, you’re in for a fun day (of MAXDOP 1 hints)
  • If your parallel plan gets slower as you touch more data, you might want to try hinting a higher DOP

I know, it sounds kooky, but this is all stuff I have to think about and mess with when I’m tuning queries for clients. Many times, it seems like an attractive concept to force a parallel plan on a slow query, but the end result isn’t necessarily better.

It’s sort of like when I expect a query to use a nested loops join, but it doesn’t. If you hint the query to do the loop join, you might get a missing index request that lead the optimizer to think that a different join type was cheaper. Or you might just find out the optimizer was wrong. Again.

Getting back to the main point, though: parallelism is a very effective equalizer for the right kind of queries. It just doesn’t necessarily help every query.

Slug Away


To summarize and recap a little bit, here. Most SQL Server users out there will do fine following basic advice about cost threshold for parallelism and max degree of parallelism.

There will be outliers, edge cases, and times when you need to work outside of those settings for particular queries to run optimally. Heck, if a client tells me they’re running a data warehouse, the last thing I’m going to get hung up on is cost threshold for parallelism.

If you change those settings away from the defaults, and you’re still for some reason dissatisfied with the amount of CX_ waits on your server, try focusing on the queries that are going parallel and tuning them to reduce their estimated costs to lower numbers.

Sometimes those waits really are your fault.

Thanks for reading!

Going Further


If this is the kind of SQL Server stuff you love learning about, you’ll love my training. I’m offering a 75% discount to my blog readers if you click from here. I’m also available for consulting if you just don’t have time for that and need to solve performance problems quickly.

Software Vendor Mistakes With SQL Server: Not Getting Parallel Inserts Into #Temp Tables

Do That, But Faster


Serial zones in parallel plans can leave a lot of performance on the table. One of the best ways to see that is with insert queries that do a lot of work. A big contrast between @table variables and #temp tables is that the former fully disallows parallelism in modification queries, and the latter do not.

The story gets a little more complicated when inserting into a columnstore index, but this post isn’t really about that.

Let’s look at some scenarios where a fully parallel insert is allowed, and then not allowed.

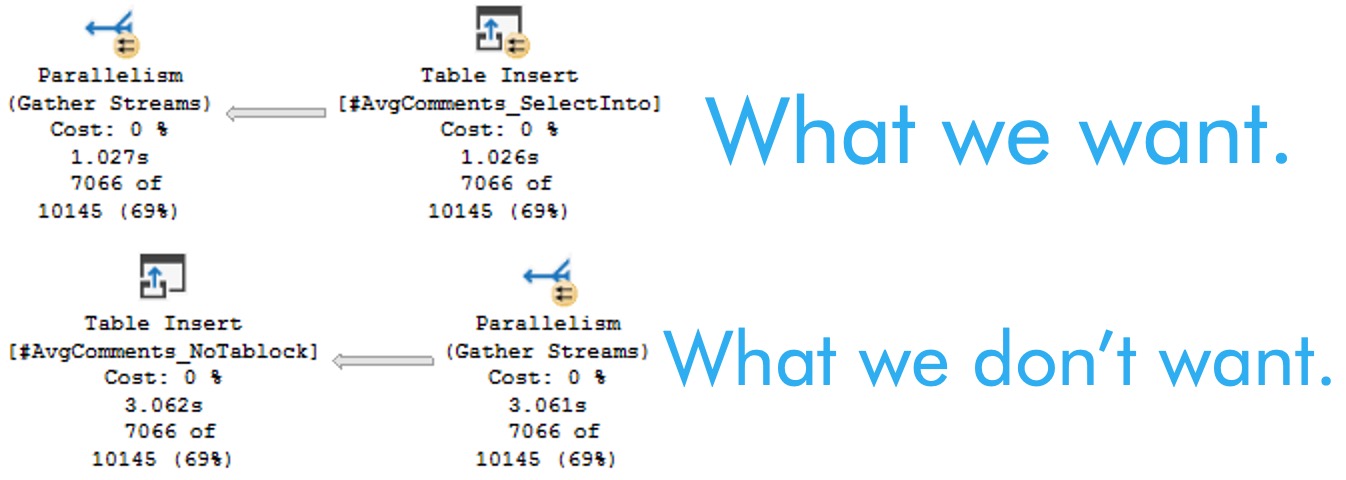
The thing to keep an eye out for is the insert operator being in the serial zone. For the purposes of this thread:

SQL Server Query Plan
attention, please

Works: SELECT INTO


As long as you don’t do anything too goofy here, a fully parallel insert will “always” be allowed, here.

Goofy things will be explained later in the post.

--This will "always" work, as long as you don't do 
--anything listed below in the "broken" select
SELECT
    C.UserId,
    SumScore = 
        SUM(C.Score)
INTO
    #AvgComments_SelectInto
FROM 
    dbo.Comments AS C
GROUP BY 
    C.UserId
HAVING 
    SUM(C.Score) > 200;

DROP TABLE #AvgComments_SelectInto;

Works: INSERT, with TABLOCK


Rather than selecting directly into a table, here we’re gonna create the table and issue an insert statement with the tablock hint.

--This *will* get you a fully parallel insert, unless goofiness is involved.
CREATE TABLE
    #AvgComments_Tablock
(
    UserId int,
    SumScore int
);

INSERT 
    #AvgComments_Tablock WITH (TABLOCK)
(
    UserId, 
    SumScore
)
SELECT 
    C.UserId,
    AvgScore = 
        SUM(C.Score)
FROM 
    dbo.Comments AS C
GROUP BY 
    C.UserId
HAVING 
    SUM(C.Score) > 200

DROP TABLE #AvgComments_Tablock

Doesn’t Work: INSERT, without TABLOCK


Without the tablock hint, this will get you the plan we don’t want, where the insert operator is outside the parallel zone.

--This will not get you a fully parallel insert
CREATE TABLE
    #AvgComments_NoTablock
(
    UserId int,
    SumScore int
);

INSERT 
    #AvgComments_NoTablock 
(
    UserId, 
    SumScore
)
SELECT
    C.UserId,
    SumScore = 
        SUM(C.Score)
FROM 
    dbo.Comments AS C
GROUP BY 
    C.UserId
HAVING 
    SUM(C.Score) > 200;

DROP TABLE #AvgComments_NoTablock;

Doesn’t Work: A Whole Laundry List Of Stuff


Basically any one thing quoted out has the ability to deny the parallel insert that we’re after.

If you’re doing any of this stuff, like, bye.

--SET ROWCOUNT Any_Number;
--ALTER DATABASE StackOverflow2013 
--    SET COMPATIBILITY_LEVEL = Anything_Less_Than_130;
CREATE TABLE
    #AvgComments_BrokenTablock
(
    --Id int IDENTITY,
    UserId int,
    SumScore int,
    --INDEX c CLUSTERED(UserId)
    --INDEX n NONCLUSTERED(UserId)
);

--Also, if there's a trigger or indexed view on the target table
--But that's not gonna be the case with #temp tables
INSERT 
    #AvgComments_BrokenTablock WITH (TABLOCK)
(
    UserId, 
    SumScore
)
--The rules here are a little weird, so
--be prepared to see weird things if you use OUTPUT
--OUTPUT Inserted.*
--To the client or
--INTO dbo.some_table
--INTO @table_varible
SELECT
    --Id = IDENTITY(bigint, 1, 1),
    --dbo.A_Scalar_UDF_Not_Inlined_By_Froid
    C.UserId,
    SumScore = 
        SUM(C.Score)
FROM 
    dbo.Comments AS C
--Any reference to the table you're inserting into
--Not exists is just an easy example of that
--WHERE NOT EXISTS
--(
--    SELECT
--	    1/0
--	FROM #AvgComments_BrokenTablock AS A
--	WHERE A.UserId = C.UserId
--)
GROUP BY 
    C.UserId
HAVING 
    SUM(C.Score) > 200;

DROP TABLE #AvgComments_BrokenTablock;

Explainer


There are many good reasons to want a fully parallel insert, but you need to make sure that the bottleneck isn’t earlier in the plan.

If it is, you may not see the full performance gains from getting it.

In general, it’s a good strategy when building larger #temp tables, but at this point I add a tablock hint to every #temp table insert at first to test things out.

Thanks for reading!

Going Further


If this is the kind of SQL Server stuff you love learning about, you’ll love my training. I’m offering a 75% discount to my blog readers if you click from here. I’m also available for consulting if you just don’t have time for that and need to solve performance problems quickly.

An Undocumented Restriction For Parallel Inserts In SQL Server That Can Kill Performance

Insert Card


I’d like to start this post off by thanking my co-blogger Joe Obbish for being lazy and not blogging about this when he first ran into it three years ago.

Now that we’re through with pleasantries, let’s talk turkey.

Over in this post, by Arvind Shyamsundar, which I’m sure Microsoft doesn’t consider official documentation since it lacks a GUID in the URL, there’s a list of… things about parallel inserts.

  • Just as it is with SQL Server 2016, in order to utilize the parallel insert in Azure SQL DB, do ensure that your compatibility level is set to 130. In addition, it is recommended to use a suitable SKU from the Premium service tier to ensure that the I/O and CPU requirements of parallel insert are satisfied.
  • The usage of any scalar UDFs in the SELECT query will prevent the usage of parallelism. While usage of non-inlined UDFs are in general ‘considered harmful’ they end up actually ‘blocking’ usage of this new feature.
  • Presence of triggers on the target table and / or indexed views which reference this table will prevent parallel insert.
  • If the SET ROWCOUNT clause is enabled for the session, then we cannot use parallel insert.
  • If the OUTPUT clause is specified in the INSERT…SELECT statement to return results to the client, then parallel plans are disabled in general, including INSERTs. If the OUTPUT…INTO clause is specified to insert into another table, then parallelism is used for the primary table, and not used for the target of the OUTPUT…INTO clause.
  • Parallel INSERT is used only when inserting into a heap without any additional non-clustered indexes. It is also used when inserting into a Columnstore index.
  • Watch out when IDENTITY or SEQUENCE is present!

In the actual post, some of these points are spread out a bit; I’ve editorially condensed them here. Some of them, like OUTPUT and UDFs, I’ve blogged about a bazillion times over here.

Others may come as a surprise, like well, the rest of them. Hm.

But there’s something missing from here, too!

Lonesome


Let’s create a #temp table, here.

DROP TABLE IF EXISTS 
    #parallel_insert;

CREATE TABLE
    #parallel_insert
(
    id int NOT NULL
)

Now let’s look at a parallel insert. I’m using an auxiliary Numbers table for this demo because whatever it’s my demo.

INSERT
    #parallel_insert WITH (TABLOCK)
(
    id
)
SELECT
    n.Number
FROM dbo.Numbers AS n
JOIN dbo.Numbers AS n2
    ON n2.Number = n.Number
OPTION
(
    USE HINT('ENABLE_PARALLEL_PLAN_PREFERENCE')
);

The query plan does exactly what we want it to do, and stays parallel through the insert.

SQL Server Query Plan
heavy bags

Referential


If we drop and re-create the #temp table, and then run this insert instead, that doesn’t happen:

INSERT
    #parallel_insert WITH (TABLOCK)
(
    id
)
SELECT
    n.Number
FROM dbo.Numbers AS n
JOIN dbo.Numbers AS n2
    ON n2.Number = n.Number
AND NOT EXISTS
    (
        SELECT
            1/0
        FROM #parallel_insert AS p
        WHERE p.id = n.Number
    )
OPTION
(
    USE HINT('ENABLE_PARALLEL_PLAN_PREFERENCE')
);

Note that the not exists is against an empty table, and will not eliminate any rows. The optimizer estimates this correctly, and yet…

SQL Server Query Plan
collect call

The insert is in a fully serial zone. This happens because we reference the table that we’re inserting into in the select portion of the query. It’s no longer just the target for the select to insert into.

Zone Out


If you’re tuning queries like this and hit situations where this limitation kicks in, you may need to use another #temp table to stage rows first.

I’m not complaining about this limitation. I can only imagine how difficult it would be to guarantee correct results in these situations.

I do want to point out that the fully parallel insert finishes in around 250ms, and the serial zone insert finishes in 1.4 seconds. This likely isn’t the most damning thing, but in larger examples the difference can be far more profound.

Thanks for reading!

Going Further


If this is the kind of SQL Server stuff you love learning about, you’ll love my training. I’m offering a 75% discount to my blog readers if you click from here. I’m also available for consulting if you just don’t have time for that and need to solve performance problems quickly.

Wait Stats During Exchange Spills In SQL Server Parallel Query Plans

Inorganic


Lots of people say these are rare — and perhaps they are becoming more so — but I still see them with some frequency. That’s not a terribly strong indictment of SQL Server, but that’s not the point of this blog or of my work.

Exchange spills are particularly interesting, and I’ve written about them a couple times:

For each query we run, we’re gonna execute the query, and then this query to look at session level wait stats.

SELECT
    desws.*
FROM sys.dm_exec_session_wait_stats AS desws
WHERE desws.session_id = @@SPID
ORDER BY desws.wait_time_ms DESC;

Turns Out


The first thing to understand here is that the memory grant itself doesn’t matter. That’s why there’s no hint for it on this query, as there have been in the others.

WITH 
    precheck AS 
(
    SELECT
        u.Id, 
        p.Id AS PostId,
        p.AcceptedAnswerId,
        n = 
            ROW_NUMBER() OVER
            (
                ORDER BY
            	    u.Id
            )
    FROM dbo.Users AS u
    JOIN dbo.Posts AS p
        ON p.OwnerUserId = u.Id
    WHERE  u.CreationDate > '20110825' 
    AND    u.Reputation > 100 
    AND    p.PostTypeId = 1
)
SELECT 
    u.*, 
    p.*
FROM precheck p
JOIN dbo.Users AS u
    ON p.Id = u.Id
WHERE ISNULL(p.n, u.Id) = 0
ORDER BY u.Id, u.Reputation
OPTION(USE HINT('ENABLE_PARALLEL_PLAN_PREFERENCE'), MERGE JOIN);

We do need to ask for a parallel merge join, because parallel merge joins were a mistake and should not have optimizer support.

Thanks for watching.

Back Brain


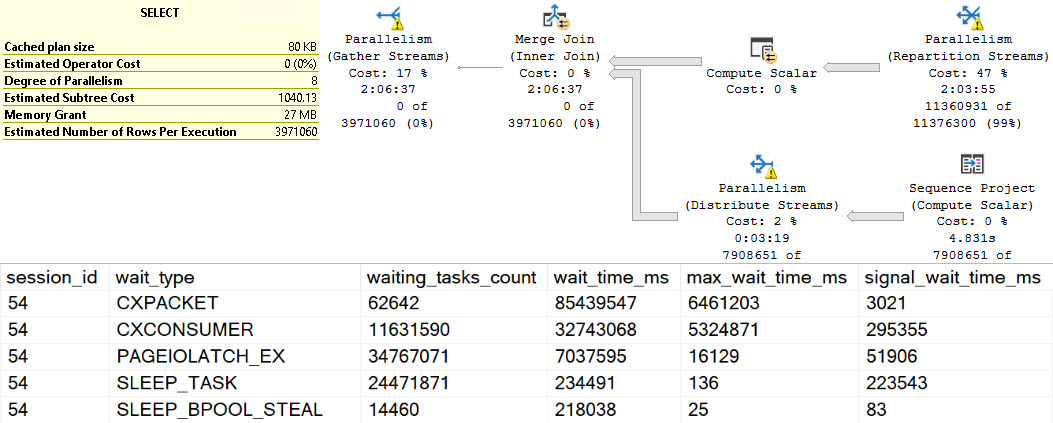
The waits here are interesting. At the top, we have perhaps high expected waits on parallelism, because the spills are encountered at parallel exchanges.

SQL Server Query Plan
ouch

There are quite high waits on PAGEIOLATCH_EX, SLEEP_TASK, and SLEEP_BPOOL_STEAL rounding out the top five. This is quite interesting, because I’ve never explicitly thought of PAGEIOLATCH_EX waits in the context of exchange spills. Normally, I think of them when queries read pages from disk into memory for modification.

Going down the line, SLEEP_TASK is familiar from our time spent with hash spills, but SLEEP_BPOOL_STEAL is so far undocumented anywhere.

One can make some inferences based on the name about what it might be doing, but… It could also be a bit of a catch-all wait, like other waits that can be generated by spills.

From Me


Going further, the other interesting waits encountered here look like so:

SQL Server Query Plan
fields

If I had a Magic Eight Ball out right now, it’d probably just go into convulsions. Perhaps SLEEP_TASK (shown one above) is another clear sign of a different kind of spill, but there’s so much else going on here it’s hard to tell for certain which waits this query generated were from the spill, and which were from other portions of the query executing regularly.

Points for hitting PREEMPTIVE waits, though.

To You


You weren’t mis-reading when you saw the query plan. This really did execute for over two hours. I tried to get another exchange spill into the mix by changing the query slightly, but all I got was a very cranky Repartition Streams.

WITH 
    precheck AS 
(
    SELECT
        u.Id, 
        p.Id AS PostId,
        p.AcceptedAnswerId,
        p.Body, --New
        n = 
            ROW_NUMBER() OVER
            (
                ORDER BY
            	    u.Id
            )
    FROM dbo.Users AS u
    JOIN dbo.Posts AS p WITH(INDEX = p)
        ON p.OwnerUserId = u.Id
    WHERE  u.CreationDate > '20110825' 
    AND    u.Reputation > 100 
    AND    p.PostTypeId = 1
)
SELECT 
    u.*, 
    p.*
FROM precheck p
JOIN dbo.Users AS u
    ON p.Id = u.Id
WHERE ISNULL(p.n, u.Id) = 0
ORDER BY u.Id, u.Reputation
OPTION(USE HINT('ENABLE_PARALLEL_PLAN_PREFERENCE'), MERGE JOIN);

And it ran for an extra 45 or so minutes, too.

SQL Server Query Plan
discard


Ugly Baby


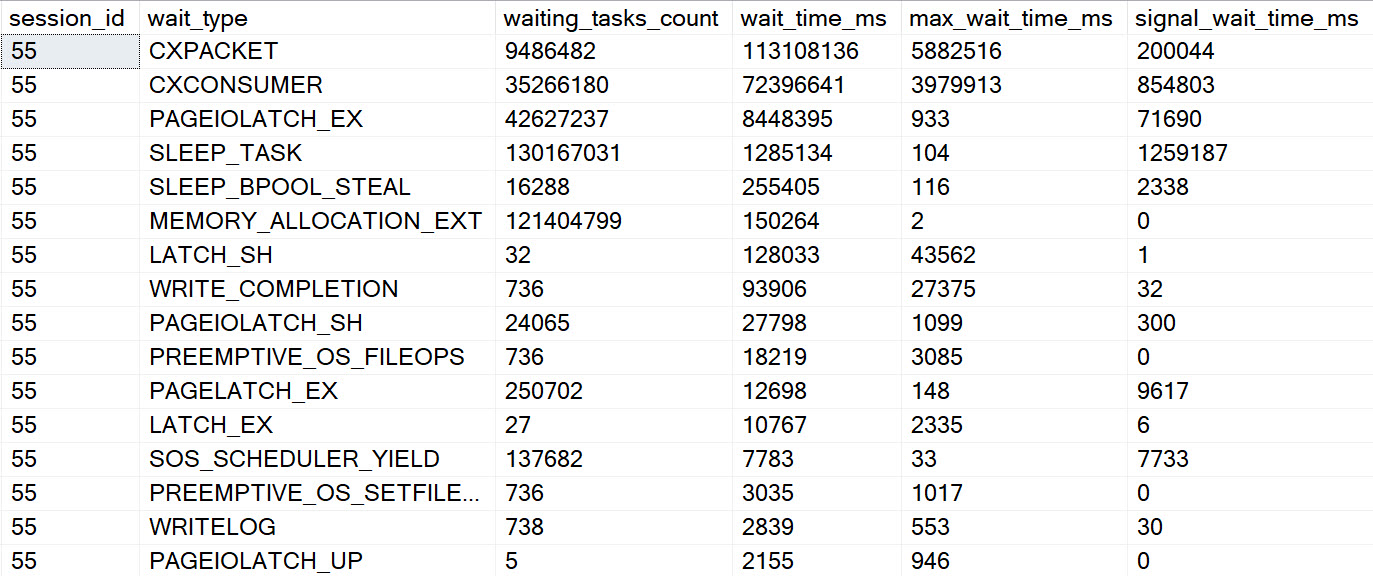
The results for this second query wait stats wise are just an amplified version of the original, of course.

SQL Server Wait Stats
gun tricks

Obviously dragging the Body column around had a rather profound influence on things.

Whole And Wet


These waits are perhaps less obvious than other spills, though one could make reasonable assumptions about SLEEP_TASK waits here as well.

I’d be concerned about any query emitting high amounts of it, or any server with high amounts of it compared to uptime.

It seems unfortunate that there’s no wait directly tied to hash spills, but perhaps when we’re all living in some quantum batch mode reality in the cloud it won’t matter at all.

Thanks for reading!

Going Further


If this is the kind of SQL Server stuff you love learning about, you’ll love my training. I’m offering a 75% discount to my blog readers if you click from here. I’m also available for consulting if you just don’t have time for that and need to solve performance problems quickly.

How Many Threads Can One Query Use In SQL Server?

Overlook


Something that many people overlook about parallel plans is that while they are limited to DOP active CPUs, they can suck up way more threads.

How many more depends on how many branches can be active at the same time.

Plus the coordinator thread.

Big Query


In order to test these limits out, we need a rather large query.

Since I’m lazy, I’m using a bit of dynamic SQL to make the query I want. Along the way figuring out how many joins I could gin up before things went amok, I learned some fun things.

For example, if I used Hash Joins, I’d get an error that the Query Processor ran out of stack space, and if I used Nested Loops joins I wouldn’t get the requisite parallel exchanges necessary to have multiple parallel zones.

And if I don’t use a force order hint, I’ll end up spending a really long time waiting for a query plan to compile. It wasn’t a good time.

There’s also a tipping point with the number of joins, where if I go over a certain number, my query’s DOP gets downgraded to one.

yogurt land

Outcoming


After finding my sweet spot at 316 joins, I still had to toggle with DOP a little.

On my home server, I have 706 worker threads available.

With my 316 join query, I was able to reserve 634 worker threads.

bile

But that’s where I topped off. After that, the query would get downgraded to DOP 1 and only ask for 1 thread.

Qurious


I’m not sure if there’s some built-in cap on how many threads a query can use, or if the limit is global before downgrades start happening.

What I found more interesting was that even though the query reserves 634 workers, those workers weren’t immediately subtracted from available workers on the server.

Technically, reserved threads don’t exist yet. They haven’t been created or attached to a task. All the reservation does is prevent other queries from reserving threads beyond the configured limit.

For example, if I run two copies of the big query at the same time, one is downgraded to DOP 1, likely because it’s hinted to DOP 2 and that’s the next lowest DOP, and it can’t run at DOP 2 and reserve 634 more threads that the first query has already reserved.

Thanks for reading!

Going Further


If this is the kind of SQL Server stuff you love learning about, you’ll love my training. I’m offering a 75% discount to my blog readers if you click from here. I’m also available for consulting if you just don’t have time for that and need to solve performance problems quickly.