Returning All Rows with TABLESAMPLE In SQL Server

This post explores some undocumented behavior with TABLESAMPLE, specifically around the REPEATABLE option. TABLESAMPLE is a very useful tool to get a fast page-based sample of large tables. SQL Server uses it behind the scenes to gather sampled statistics.

Syntax


For this post we only need to be concerned with a subset of the syntax:

TABLESAMPLE SYSTEM (sample_number PERCENT )
[ REPEATABLE (repeat_seed) ]

Here’s a quote from that page about how TABLESAMPLE works internally:

TABLESAMPLE SYSTEM returns an approximate percentage of rows and generates a random value for each physical 8-KB page in the table. Based on the random value for a page and the percentage specified in the query, a page is either included in the sample or excluded.

One theory for how TABLESAMPLE works is that SQL Server generates a sequence of random values and does an allocation order scan that skips a page if the random value for that page does not meet the sample percent threshold. If REPEATABLE is used then SQL Server will generate the same sequence of random values each time, but results may be different if the table’s data has changed:

The REPEATABLE option causes a selected sample to be returned again. When REPEATABLE is specified with the same repeat_seed value, SQL Server returns the same subset of rows, as long as no changes have been made to the table. When REPEATABLE is specified with a different repeat_seed value, SQL Server will typically return a different sample of the rows in the table. The following actions to the table are considered changes: inserting, updating, deleting, index rebuilding, index defragmenting, restoring a database, and attaching a database.

How repeatable is REPEATABLE?


One might expect to get the same sample of pages with the REPEATABLE option even if the underlying data has changed but all of the pages remain in the same physical order. It also seems reasonable to think that if we add a page to the end of a table that the sample should stay the same except the new page may or may not be included in the sample. We can do some quick tests:

DROP TABLE IF EXISTS dbo.REPEATABLE_TEST;

CREATE TABLE dbo.REPEATABLE_TEST (
ID BIGINT NOT NULL IDENTITY(1, 1),
FILLER VARCHAR(7000),
PRIMARY KEY (ID)
);

INSERT INTO dbo.REPEATABLE_TEST
VALUES (REPLICATE('Z', 7000));
INSERT INTO dbo.REPEATABLE_TEST
VALUES (REPLICATE('Z', 7000));
INSERT INTO dbo.REPEATABLE_TEST
VALUES (REPLICATE('Z', 7000));
INSERT INTO dbo.REPEATABLE_TEST
VALUES (REPLICATE('Z', 7000));
INSERT INTO dbo.REPEATABLE_TEST
VALUES (REPLICATE('Z', 7000));
INSERT INTO dbo.REPEATABLE_TEST
VALUES (REPLICATE('Z', 3000));

-- returns 3 - 6
-- we skipped the first two pages 
-- and included the last four
SELECT ID
FROM dbo.REPEATABLE_TEST
TABLESAMPLE (50 PERCENT)
REPEATABLE (1);

INSERT INTO dbo.REPEATABLE_TEST
VALUES (REPLICATE('Z', 3000));

-- returns 3 - 7, same pages as before
SELECT ID
FROM dbo.REPEATABLE_TEST
TABLESAMPLE (50 PERCENT)
REPEATABLE (1);

INSERT INTO dbo.REPEATABLE_TEST
VALUES (REPLICATE('Z', 7000));

-- returns 3 - 8, includes new page
SELECT ID
FROM dbo.REPEATABLE_TEST
TABLESAMPLE (50 PERCENT)
REPEATABLE (1);

INSERT INTO dbo.REPEATABLE_TEST
VALUES (REPLICATE('Z', 7000));

-- returns 3 - 8, does not include new page
SELECT ID
FROM dbo.REPEATABLE_TEST
TABLESAMPLE (50 PERCENT)
REPEATABLE (1);

So far so good. However, the quote about REPEATABLE also calls out doing an index rebuild. We can see that our table isn’t fragmented at all with this query:

SELECT
  index_level
, page_count
, avg_fragmentation_in_percent
FROM sys.dm_db_index_physical_stats
(7, OBJECT_ID(N'dbo.REPEATABLE_TEST')
, NULL, NULL , 'DETAILED');

Result set:

a3_result_set_1

With a MAXDOP 1 rebuild I wouldn’t expect the physical order of pages to change at all. Indeed it doesn’t:

a3_result_set_1

We issue the REBUILD:

ALTER TABLE dbo.REPEATABLE_TEST REBUILD WITH (MAXDOP = 1);

However, now we get a completely different sample, despite the table still having no fragmentation. Pages 1, 2, 3, 5, and 8 are included in the results. The table has the same data and physical order as before. Why should the sample change even with the same REPEATABLE value?

Decoding REPEATABLE


Perhaps the REPEATABLE value is somehow combined with some piece of metadata with the table, similar to a salt used for encryption. The OBJECT_ID seems like a reasonable guess except that it won’t change after a rebuild. However, the HOBT_ID of the table does change after a REBUILD. We may be able to get a repeatable sample even after a REBUILD if we’re able to factor in the HOBT_ID somehow.

First let’s put 2537 pages into a new testing table:

DROP TABLE IF EXISTS dbo.REPEATABLE_SALT_TEST;

CREATE TABLE dbo.REPEATABLE_SALT_TEST (
ID BIGINT NOT NULL,
FILLER VARCHAR(7000),
PRIMARY KEY (ID)
);

INSERT INTO dbo.REPEATABLE_SALT_TEST WITH (TABLOCK)
SELECT
  ROW_NUMBER() OVER (ORDER BY (SELECT NULL))
, REPLICATE('Z', 7000)
FROM master..spt_values;

REPEATABLE allows between 1 and the maximum BIGINT value, 9223372036854775807. However, it’s easy to show through testing that a REPEATABLE value will return the same sample as REPEATABLE value + 4294967296. Perhaps picking a REPEATABLE value of hobt_id % 4294967296 will return the same sample even through a REBUILD.

SELECT hobt_id % 4294967296
FROM sys.partitions
where object_id = OBJECT_ID('REPEATABLE_SALT_TEST');

SELECT COUNT(*), MIN(ID), MAX(ID)
FROM dbo.REPEATABLE_SALT_TEST
TABLESAMPLE (50 PERCENT)
REPEATABLE (1248067584); -- use query value

I get 1306 pages sampled with a minimum value of 3 and a maximum value of 2537. After a REBUILD I get different results:

ALTER TABLE dbo.REPEATABLE_SALT_TEST
REBUILD WITH (MAXDOP = 1);

SELECT hobt_id % 4294967296
FROM sys.partitions
where object_id = OBJECT_ID('REPEATABLE_SALT_TEST');

SELECT COUNT(*), MIN(ID), MAX(ID)
FROM dbo.REPEATABLE_SALT_TEST
TABLESAMPLE (50 PERCENT)
REPEATABLE (1248133120); -- use query value

Now I get 1272 pages sampled with a minimum value of 6 and a maximum value of 2537. Through trial and error I arrived at one formula which works:

4294967296 - ((hobt_id + @salt) % 4294967296)

Where @salt is a positive integer between 1 and 4294967295. Let’s go back to our current testing table and use a @salt value of 1:

SELECT 4294967296 - ((hobt_id + 1) % 4294967296)
FROM sys.partitions
where object_id = OBJECT_ID('REPEATABLE_SALT_TEST');

SELECT COUNT(*), MIN(ID), MAX(ID)
FROM dbo.REPEATABLE_SALT_TEST
TABLESAMPLE (50 PERCENT)
REPEATABLE (3046768639);

Now I get 1268 pages sampled with a minimum value of 1 and a maximum value of 2534. After the rebuild I get the same result:

ALTER TABLE dbo.REPEATABLE_SALT_TEST
REBUILD WITH (MAXDOP = 1);

SELECT 4294967296 - ((hobt_id + 2147483648) % 4294967296)
FROM sys.partitions
where object_id = OBJECT_ID('REPEATABLE_SALT_TEST')

SELECT COUNT(*), MIN(ID), MAX(ID)
FROM dbo.REPEATABLE_SALT_TEST
TABLESAMPLE (50 PERCENT)
REPEATABLE (899219456); -- use query value

The formula can also be expressed as:

4294967296 - ((hobt_id + ABS(2147483648 - @salt)) % 4294967296)

With @salt as a positive integer from 0 to 2147483647. This is because there are repeated values in a cycle of 4294967296. More importantly, picking a @seed value of 1 always returns all pages from a table regardless of the sample size.

I admit that there is probably a simpler formula that I missed. Also, none of the above applies to columnstore tables. I doubt that it applies for partitioned rowstore tables as well but I did not test that.

Practical Applications?


There are a few interesting things that can be done with the new knowledge that we have around how REPEATABLE works.

Force an Allocation Order Scan

Normally you can only get an allocation order scan on a table with 64 pages or more unless you use TABLESAMPLE with a sample rate of less than 100%. However, now that we have a seed value that returns all rows no matter what we can force an allocation scan for any size table that returns all rows. Consider a 63 page table written to disk in the wrong order:

DROP TABLE IF EXISTS dbo.FORCE_ALLOCATION_ORDER_SCAN;

CREATE TABLE dbo.FORCE_ALLOCATION_ORDER_SCAN (
	ID BIGINT NOT NULL,
	PAGE_TURNER VARCHAR(5000) NOT NULL,
	PRIMARY KEY (ID)
);

-- add 63 pages with one row per page
-- in reverse clustered index order
DECLARE @i INTEGER = 63;
SET NOCOUNT ON;
WHILE @i > 0
BEGIN
	INSERT INTO dbo.FORCE_ALLOCATION_ORDER_SCAN
	WITH (TABLOCK)
	SELECT @i, REPLICATE('Z', 5000);

	SET @i = @i - 1;
END;

This table is very fragmented from the point of view of SQL Server:

a3_FORCE_ALLOCATION_ORDER_SCAN_frag

Now let’s find the REPEATABLE value which returns all rows:

-- returns 899088385
SELECT 4294967296 - ((hobt_id + ABS(2147483648 - 1)) % 4294967296)
FROM sys.partitions
where object_id = OBJECT_ID('SAMPLE_ALLOCATION_ORDER_TEST');

SELECT ID
FROM dbo.FORCE_ALLOCATION_ORDER_SCAN
TABLESAMPLE SYSTEM (99.99999 PERCENT )
REPEATABLE (899088385);

Here is a subset of the results:
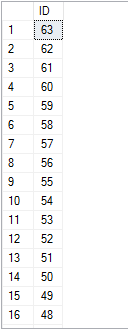
a3_FORCE_ALLOCATION_ORDER_SCAN_results

Change Cardinality Estimates

With a repeatable value that returns 100% of the rows in the table we can change the percent to change the cardinality estimate from the table as long as we don’t exceed 99.99999 PERCENT or so.

The below query has a row estimate of 1 row:

SELECT ID
FROM dbo.FORCE_ALLOCATION_ORDER_SCAN
TABLESAMPLE SYSTEM (0 PERCENT)
REPEATABLE (899088385);

Query plan:
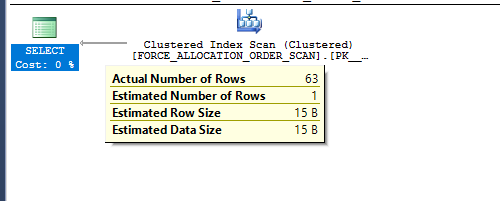
a3_1_row_estimate

And this query has an estimate of 63 rows:

SELECT ID
FROM dbo.FORCE_ALLOCATION_ORDER_SCAN
TABLESAMPLE SYSTEM (99.99999 PERCENT)
REPEATABLE (899088385);

Query plan:
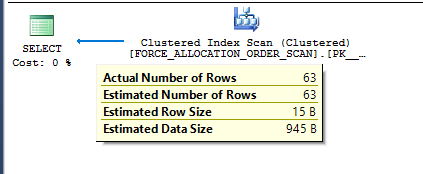
a3_63_row_estimate

Of course, if the hobt_id for the table ever changes then the results from the query will change. TOP with an OPTIMIZE FOR hint is a good alternative, but TOP PERCENT has the overhead of an added table spool.

Consistent Samples

Suppose I want to create a demo that shows TABLESAMPLE missing all pages with a 50% sample rate against a 20 page table. If I find a REPEATABLE value that works against a table on my machine it likely won’t work for the reader because it will have a different hobt_id. First I need to find a REPEATABLE value that works for my table:

DROP TABLE IF EXISTS dbo.SAMPLE_NO_ROWS;

CREATE TABLE dbo.SAMPLE_NO_ROWS (
	PAGE_TURNER VARCHAR(5000) NOT NULL
);

INSERT INTO dbo.SAMPLE_NO_ROWS WITH (TABLOCK)
SELECT TOP 20 REPLICATE('Z', 5000)
FROM master..spt_values t1;

DECLARE @random_seed BIGINT = 0,
@target_num_rows INT = 0,
@found_rows INT,
@stop INT = 0,
@dynamic_sql NVARCHAR(1000);

BEGIN

SET NOCOUNT ON;

WHILE @stop = 0
BEGIN
	SET @random_seed = @random_seed + 1;

	SET @dynamic_sql = N'SELECT @sampled_row_count = COUNT(*)
	FROM dbo.SAMPLE_NO_ROWS
	TABLESAMPLE SYSTEM (50 PERCENT)
	REPEATABLE(' + CAST(@random_seed AS NVARCHAR(20)) + ')';

	EXECUTE sp_executesql @dynamic_sql, N'@sampled_row_count int OUTPUT', @sampled_row_count = @found_rows OUTPUT;

	IF @found_rows = @target_num_rows
	BEGIN
		SET @stop = 1
	END;
END;

SELECT @random_seed;

END;

After a lengthy search I got a REPEATABLE value of 823223 on my machine. The following query returns a count of 0 rows:

SELECT COUNT(*)
FROM dbo.SAMPLE_NO_ROWS
TABLESAMPLE SYSTEM (50 PERCENT)
REPEATABLE(823223);

With a hobt_id value of 72057595285143552 we can figure out the @salt value:

SELECT 4294967296 - ((hobt_id + 3046928457) % 4294967296)
FROM sys.partitions
where object_id = OBJECT_ID('SAMPLE_NO_ROWS');

Now I can reproduce the demo from scratch:

DROP TABLE IF EXISTS dbo.SAMPLE_NO_ROWS;

CREATE TABLE dbo.SAMPLE_NO_ROWS (
	PAGE_TURNER VARCHAR(5000) NOT NULL
);

INSERT INTO dbo.SAMPLE_NO_ROWS WITH (TABLOCK)
SELECT TOP 20 REPLICATE('Z', 5000)
FROM master..spt_values t1;

SELECT 4294967296 - ((hobt_id + 3046928457) % 4294967296)
FROM sys.partitions
where object_id = OBJECT_ID('SAMPLE_NO_ROWS');

-- count of 0
SELECT COUNT(*)
FROM dbo.SAMPLE_NO_ROWS
TABLESAMPLE SYSTEM (50 PERCENT)
REPEATABLE(4294545335); -- use query value

Query plan:

a3_demo_0_rows

Final Thoughts


Many of the things that I’ll blog about won’t be suitable for production use, but this should be considered especially unsuitable. Microsoft could change the undocumented behavior described here at any time. However, until it is changed it can be useful for demos or for further experimentation. Thanks for reading!
The SQL Server Query Without an Efficient Join

Sometimes simple changes to a query can lead to dramatic changes in performance. I often find it helpful to dig into the details as much as I can whenever this happens.

Test Data


All that’s needed is a table with a clustered key defined on both columns. The first column will always have a value of 1 and the second column will increment for each row. We need two identical tables and may change the number of rows inserted into both of them for some tests. Below is SQL to follow along at home:

DROP TABLE IF EXISTS dbo.outer_tbl;
DROP TABLE IF EXISTS dbo.inner_tbl;

CREATE TABLE dbo.outer_tbl (
ID1 BIGINT NOT NULL,
ID2 BIGINT NOT NULL,
PRIMARY KEY (ID1, ID2)
);

CREATE TABLE dbo.inner_tbl (
ID1 BIGINT NOT NULL,
ID2 BIGINT NOT NULL,
PRIMARY KEY (ID1, ID2)
);

INSERT INTO dbo.outer_tbl WITH (TABLOCK)
SELECT TOP (20000)
  1
, ROW_NUMBER() OVER (ORDER BY (SELECT NULL))
FROM master..spt_values t1
CROSS JOIN master..spt_values t2;

INSERT INTO dbo.inner_tbl WITH (TABLOCK)
SELECT TOP (20000)
  1
, ROW_NUMBER() OVER (ORDER BY (SELECT NULL))
FROM master..spt_values t1
CROSS JOIN master..spt_values t2;

UPDATE STATISTICS dbo.outer_tbl
WITH FULLSCAN;
UPDATE STATISTICS dbo.inner_tbl
WITH FULLSCAN;

The Query


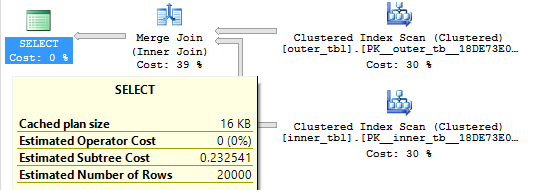
The following query will return one row from outer_tbl if there is at least one row in inner_tbl with a matching value for ID1 and ID2. For our initial data this query will return all 20000 rows. The query optimizer unsurprisingly picks a merge join and the query finishes with just 15 ms of CPU time:

SELECT *
FROM dbo.outer_tbl o
WHERE EXISTS (
	SELECT 1
	FROM dbo.inner_tbl i
	WHERE o.ID1 = i.ID1
	AND o.ID2 = i.ID2
);

Query plan:

a2 original query

Now let’s make a small change:

SELECT *
FROM dbo.outer_tbl o
WHERE EXISTS (
	SELECT 1
	FROM dbo.inner_tbl i
	WHERE o.ID1 = i.ID1
	AND o.ID2 IN (-1, i.ID2)
);

Query plan:

a2 adjusted query

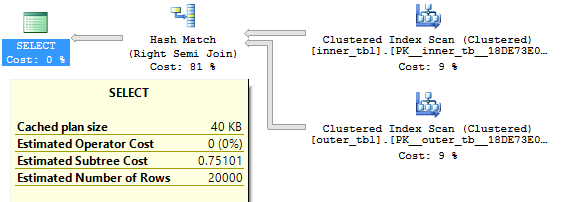
Now the query will return one row from outer_tbl if ID1 = -1 and there is at least one row in inner_tbl with a matching value for ID1 or if there is at least one row in inner_tbl with a matching value for ID1 and ID2. The query optimizer gives me a hash join and the query finishes with 11360 ms of CPU time. If I force a loop join the query finishes with 10750 ms of CPU time. If I force a merge join the query finishes with 112062 ms of CPU time. What happened?

The Problem


The problem becomes easier to see if we change both of the tables to have just one column. We know that ID1 always equals 1 for both tables so we don’t need it in the query for this data set. Here’s the new set of tables:

DROP TABLE IF EXISTS dbo.outer_tbl_single;
DROP TABLE IF EXISTS dbo.inner_tbl_single;

CREATE TABLE dbo.outer_tbl_single (
ID2 BIGINT NOT NULL,
PRIMARY KEY (ID2)
);

CREATE TABLE dbo.inner_tbl_single (
ID2 BIGINT NOT NULL,
PRIMARY KEY (ID2)
);

INSERT INTO dbo.outer_tbl_single WITH (TABLOCK)
SELECT TOP (20000)
ROW_NUMBER() OVER (ORDER BY (SELECT NULL))
FROM master..spt_values t1
CROSS JOIN master..spt_values t2;

INSERT INTO dbo.inner_tbl_single WITH (TABLOCK)
SELECT TOP (20000)
ROW_NUMBER() OVER (ORDER BY (SELECT NULL))
FROM master..spt_values t1
CROSS JOIN master..spt_values t2;

UPDATE STATISTICS dbo.outer_tbl_single
WITH FULLSCAN;
UPDATE STATISTICS dbo.inner_tbl_single
WITH FULLSCAN;

If I try to force a hash join:

SELECT *
FROM dbo.outer_tbl_single o
WHERE EXISTS (
	SELECT 1
	FROM dbo.inner_tbl_single i
	WHERE o.ID2 IN (-1, i.ID2)
)
OPTION (MAXDOP 1, HASH JOIN);

I get an error:

Msg 8622, Level 16, State 1, Line 27
Query processor could not produce a query plan because of the hints defined in this query. Resubmit the query without specifying any hints and without using SET FORCEPLAN.

That makes sense. Hash join requires an equality condition and there isn’t one. Attempting to force a merge join throws the same error. A loop join is valid but there’s a scan on the inner side of the loop:

SELECT *
FROM dbo.outer_tbl_single o
WHERE EXISTS (
	SELECT 1
	FROM dbo.inner_tbl_single i
	WHERE o.ID2 IN (-1, i.ID2)
)
OPTION (MAXDOP 1, NO_PERFORMANCE_SPOOL);

Query plan:

a2 single column loop join

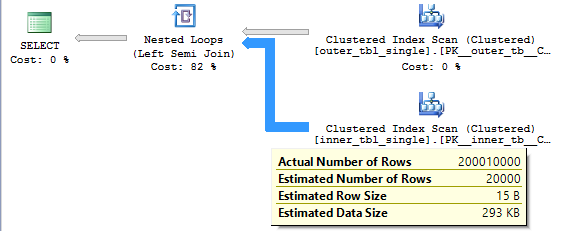
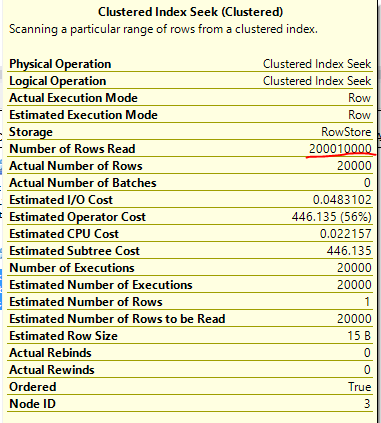
Note that we don’t need to read the 400 million (20000 * 20000) rows from the inner table. This is a semi join so the loop stops as soon as it finds a matching row. On average we should read (1 + 20000) / 2 rows from the inner table before finding a match so the query should need to read 20000 * (1 + 20000) / 2 = 200010000 rows from the inner table. This is indeed what happens:

a2 single column loop join actual

Hash Join Performance


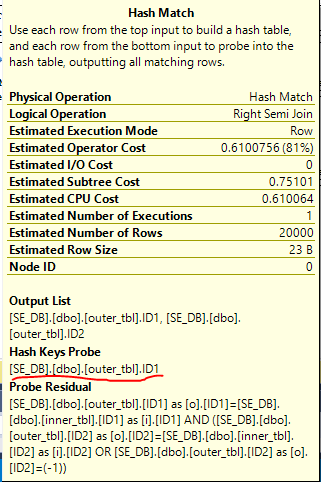
Let’s go back to the initial slow query with two columns. Why is the query eligible for a hash join? Looking at the details of the hash join we can see that the hash probe is only on the ID1 column:

a2 hash probe

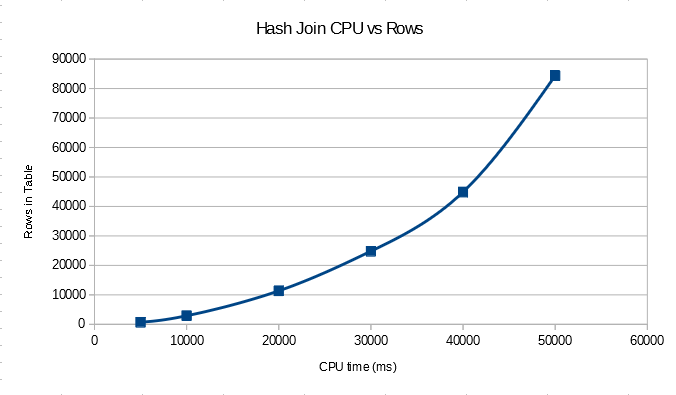
With this data set we end up with the worst possible case for a hash join. All of the rows from the build will hash to the same value and no rows from the probe will be eliminated. It’s still a semi join, so while we don’t know what the order of the hash table is we can still expect to need to (1 + 20000) / 2 entries of the hash table on average before finding the first match. This means that we’ll need to check 200010000 entries in the hash table just for this query. Since all of the work is happening in the hash join we should also expect quadratic performance for this query compared to the number of the rows in the table. If we change the number of rows in the table we see the quadratic relationship:

a2 hash rows in table vs time

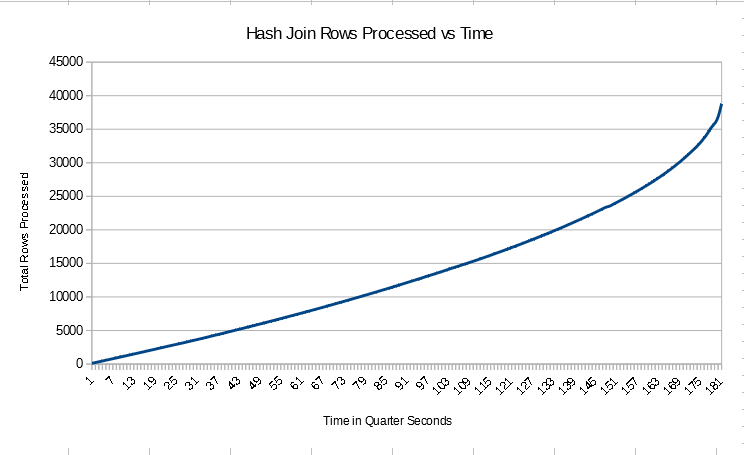
For the table scans in the query we’re likely to do allocation order scans so the data may not be fed into the hash join in index order. However I just created the tables and data is returned in order in other queries, so I’m going to assume that data is fed into the join in order in this case. You may voice your objections to this assumption in the comments. Of course, the final output of the join may not be in order. We can monitor the progress of the query in a lightweight way using sys.dm_exec_query_profiles with trace flag 7412 enabled. I tested with 40k rows in each table to get a longer running join. The number of rows processed every quarter second was not constant:

a2 hash graph 40k

In fact, the query seemed to speed up as time went on. This was unexpected. Perhaps the hash table is built in such a way that the earliest rows for a hash value are at the end of the linked list and the last values processed are at the start? That would explain why the beginning of the query had the lowest number of rows processed per second and the number of rows processed per second increased over time. This is complete speculation on my part and is very likely to be wrong.

The costing for the hash join with the new CE is disappointing. All of the information is available in the statistics to suggest that we’ll get the worst case for the hash join but the total query cost is only 0.75 optimizer units. The legacy CE does better with a total query cost of 100.75 optimizer units but the hash join is still selected.

Merge Join Performance


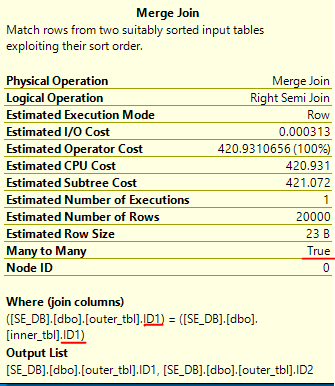
For merge join the data is only sorted by ID1 for the join:

a2 merge join

The other part of the join involving the ID2 column is processed as a residual. This is also a many-to-many join. Craig Freedman has a good explanation of how many-to-many joins can lead to a lot of extra work in the join operator:

Merge join can also support many-to-many merge joins. In this case, we must keep a copy of each row from input 2 whenever we join two rows. This way, if we later find that we have a duplicate row from input 1, we can play back the saved rows. On the other hand, if we find that the next row from input 1 is not a duplicate, we can discard the saved rows. We save these rows in a worktable in tempdb. The amount of disk space we need depends on the number of duplicates in input 2.

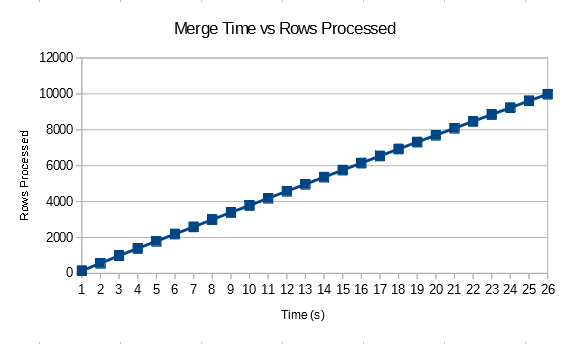
We have the maximum number of duplicates per possible. It seems reasonable to expect very bad performance along with lots of tempdb activity. Since we’re reading the data in order we might expect to see the maximum rate of rows processed per second to be at the beginning and for the query to slow down as time goes on. As ID2 increases we need to read through more and more previous rows in tempdb. My intuition does not match reality at all in this case. There’s some silly bug with sys.dm_exec_query_profiles that needs to be worked around (merge join always reports 0 rows returned), but the rows processed per second was linear:

a2 merge join graph 1

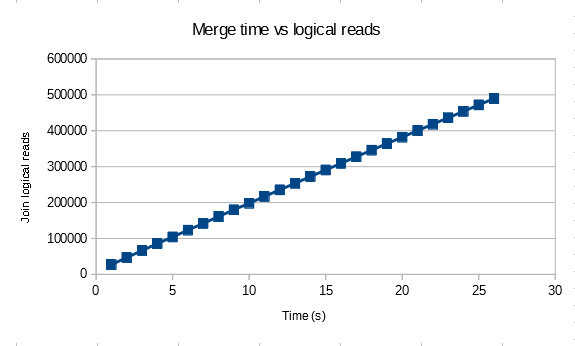
The logical reads for the join is also linear and stabilizes to 49 reads per row returned with 10k rows in the base table.

a2 merge join graph 2

The number of logical reads per row returned stabilizes to 95 when there are 20k rows in the base table. This doesn’t appear to be a coincidence. Perhaps the data stored in tempdb is stored in a format that does not preserve the original ordering. We can look at the merge_actual_read_row_count column from the DMV for the merge join to see that the number of rows read per row processed from the inner table approaches the number of rows in the table. The ramp up happens very quickly. The measurements aren’t very precise, but for the 20k row test I saw that the merge join had processed 380000 rows after just reading 20 rows from the inner table. That would explain why the logical reads and runtime of the merge join grows quadratically with the number of rows in the table but the number of rows processed per second appears to be constant for a given table size.

For the merge join the query optimizer appears to be aware of the problem. Many-to-many joins seem to have quite a bit of a penalty from a costing perspective. With the new CE we get a total query cost of 421.072 optimizer units. The legacy CE gives a very similar cost.

Loop Join Performance


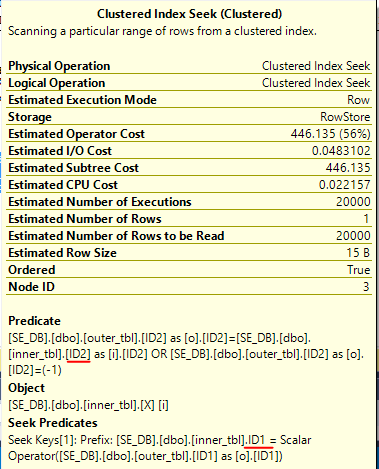
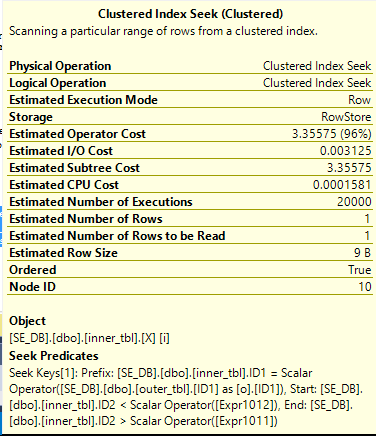
For the loop join we need to pay attention the clustered index seek in the inner part of the join:

a2 loop join operator

The -1 predicate causes trouble here as well. A filter condition will only be used as a seek predicate if it can be safely applied to every row. With the -1 check we don’t have anything to seek against for the inner table, so we only seek against ID1. As before, we should expect to read 200010000 rows from the seek. Our expectations are met:

a2 rows read

This is the first join which exposes the problem in a direct way in the XML for the actual plan which is nice. However, the performance will be quadratic with the number of rows in the table as with hash join and merge join. This is the first query that we have a shot at fixing. All that we need to do is to write the join in such a way that a seek can always be performed against the ID2 column in the inner table. The fact that the column cannot be NULL makes this possible. Consider the following query:

SELECT *
FROM dbo.outer_tbl o
WHERE EXISTS (
	SELECT 1
	FROM dbo.inner_tbl i
	WHERE o.ID1 = i.ID1
	AND i.ID2 BETWEEN (
	CASE
	WHEN o.ID2 = -1 THEN -9223372036854775808
	ELSE o.ID2
	END
	)
	AND CASE
	WHEN o.ID2 = -1 THEN 9223372036854775807
	ELSE o.ID2
	END
	)
) OPTION (MAXDOP 1, LOOP JOIN);

Note that I’m only using BETWEEN to work around a wordpress bug.

When o.ID2 = -1 the code simplifies to the following:

 WHERE o.ID1 = i.ID1
AND i.ID2 BETWEEN -9223372036854775808
AND 9223372036854775807

When o.ID2 <> -1 the code simplifies to the following:

WHERE o.ID1 = i.ID1
AND i.ID2 BETWEEN o.ID2 AND o.ID2

In other words, can we use the bounds of the BIGINT to create a seek on ID2 that can always be done:

a2 good seek

The improved query returns the results with just 47 ms of CPU time. Only 20000 rows are read from the index seek which is the best possible result for our data set. The estimated cost of the query is dramatically reduced to 3.51182 for the new CE, but that isn’t enough for it to be naturally chosen over the much less efficient hash join. That is unfortunate. As you might have guessed the LOOP JOIN hint is not necessary when using the legacy CE.

Manual Rewrites


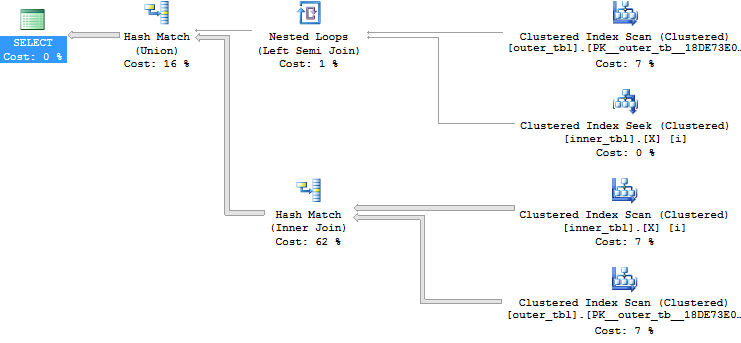
We can avoid the problem all together by changing the join condition to allow joins to work in a much more natural way. Splitting it up with a UNION finishes very quickly with our sample data set:

SELECT *
FROM dbo.outer_tbl o
WHERE EXISTS (
	SELECT 1
	FROM dbo.inner_tbl i
	WHERE o.ID1 = i.ID1
	AND o.ID2 = i.ID2
)

UNION

SELECT *
FROM dbo.outer_tbl o
WHERE o.ID2 = -1 AND EXISTS (
	SELECT 1
	FROM dbo.inner_tbl i
	WHERE o.ID1 = i.ID1
);

Query plan:

a2 union query

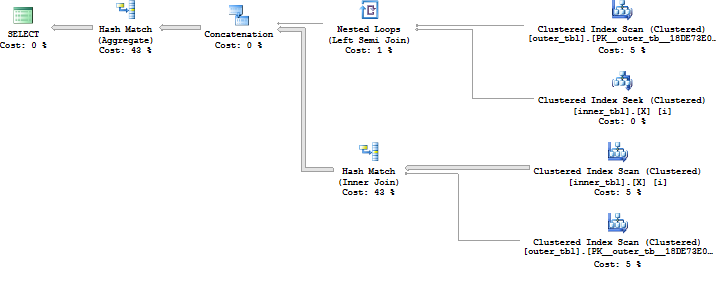
Splitting it into two semijoins does fine as well, although the hash match (aggregate) at the end is a bit more expensive for this data set than the hash match (union) employed by the other query:

SELECT *
FROM dbo.outer_tbl o
WHERE EXISTS (
	SELECT 1
	FROM dbo.inner_tbl i
	WHERE o.ID1 = i.ID1
	AND o.ID2 = -1
) OR EXISTS (
	SELECT 1
	FROM dbo.inner_tbl i
	WHERE o.ID1 = i.ID1
	AND o.ID2 = i.ID2
);

Query plan:

a2 OR query

Fully optimizing the above query is an interesting exercise but Paul White already covered the problem quite well here.

Final Thoughts


At first glance the following query is a little suspicious but the worst case performance scenario wasn’t immediately obvious (at least to me):

SELECT *
FROM dbo.outer_tbl o
WHERE EXISTS (
	SELECT 1
	FROM dbo.inner_tbl i
	WHERE o.ID1 = i.ID1
	AND o.ID2 IN (-1, i.ID2)
);

In fact, it will even perform well for some data sets. However, as the number of duplicate rows for a single ID grows we can end up with a triangular join. I found it interesting that all three join types scaled in the same way. Thanks for reading!

Manipulating Cardinality Estimates with SQL Server T-SQL Scalar UDFs

For this post I’m using the legacy cardinality estimator on SQL Server 2016 SP1.

The Problem


Scalar user defined functions are evil but sometimes necessary. The following scenario will sound a bit contrived but it’s based on a real world problem. Suppose that end users can filter the amount of data returned by a query by inputting values into a UDF that does some kind of translation. Below is a sample schema:

CREATE TABLE dbo.Example (
ID BIGINT NOT NULL,
NOT_ID VARCHAR(100) NOT NULL,
PRIMARY KEY (ID));

INSERT INTO dbo.Example WITH (TABLOCK)
(ID, NOT_ID)
SELECT TOP (1000000)
  ROW_NUMBER() OVER (ORDER BY (SELECT NULL))
, REPLICATE('Example', 14)
FROM master..spt_values t1
CROSS JOIN master..spt_values t2;

GO

CREATE FUNCTION dbo.MY_FAVORITE_UDF (@ID BIGINT)
RETURNS BIGINT AS
BEGIN
	RETURN @ID;
END;

Consider the following part of a much bigger query:

SELECT ID, NOT_ID
FROM dbo.Example
WHERE ID >= dbo.MY_FAVORITE_UDF(100000)
AND ID <= dbo.MY_FAVORITE_UDF(900000);

For this demo it’s not important that the UDF do anything so I must made it return the input. To keep things simple I’m not going to follow best practices around writing the query to avoid executing the UDFs for each row in the table.  With the legacy cardinality estimator we get a cardinality estimate of 30% of the rows in the base table for each unknown equality condition. This means that a BETWEEN against two UDFs will give a cardinality estimate of 9%. The important point is that the cardinality estimate will not change as the inputs for the UDFs change, except for the trivial case in which the inputs are the same. This can easily be seen by varying the inputs and looking at the estimated execution plans:

SELECT ID, NOT_ID
FROM dbo.Example
WHERE ID >= dbo.MY_FAVORITE_UDF(100000)
AND ID <= dbo.MY_FAVORITE_UDF(900000);

Query plan:

blog picture 1

SELECT ID, NOT_ID
FROM dbo.Example
WHERE ID >= dbo.MY_FAVORITE_UDF(500000)
AND ID <= dbo.MY_FAVORITE_UDF(499999);

Query plan:

blog picture 2

SELECT ID, NOT_ID
FROM dbo.Example
WHERE ID BETWEEN dbo.MY_FAVORITE_UDF(1)
AND dbo.MY_FAVORITE_UDF(1);

Query plan:

blog-picture-3.png

The cardinality estimate (CE) of just that simple query doesn’t really matter. But it could matter very much if that query was part of a larger query with other joins. The 9% estimate may not serve us well depending on the rest of the query and what end users tend to input. We might know that the end users tend to pick large or small ranges. Even if we don’t know anything about the end users, certain queries may do better with larger or smaller cardinality estimates.

Decreasing the Cardinality Estimate


Let’s suppose that we do some testing and find that a cardinality estimate of lower than 9% is the best choice for typical end user inputs. There are a few techniques available to decrease the cardinality estimate by a fixed percentage.

Method 1

First option is to use TOP PERCENT along with an OPTIMIZE FOR hint. I’m not really a fan of TOP PERCENT. The implementation always spools unless it gets optimized out with TOP (100) percent. It would be nice if it didn’t spool. Anyway, perhaps getting a different cardinality estimate is worth the spool. Below is one method to get a cardinality estimate of 3% of the base table:

DECLARE @top_percent FLOAT = 100;

SELECT TOP (@top_percent) PERCENT ID, NOT_ID
FROM dbo.Example
WHERE ID >= dbo.MY_FAVORITE_UDF(100000)
AND ID <= dbo.MY_FAVORITE_UDF(900000)
OPTION (OPTIMIZE FOR (@top_percent = 33.33333333));

Query plan:

blog picture 4

The percent value is a float so we can go almost anywhere between 0 – 9% for the final estimate. However, if we have to use scalar UDFs in this fashion there’s a chance that we’re doing it to write platform agnostic code. The TOP trick here isn’t likely to work in other platforms.

Method 2

Suppose we add another inequality against a UDF that’s guaranteed not to change the results. 0.3^3 = 0.027 so we would expect an estimate of 2.7%. That is indeed what happens:

SELECT ID, NOT_ID
FROM dbo.Example
WHERE ID >= dbo.MY_FAVORITE_UDF(100000)
AND ID <= dbo.MY_FAVORITE_UDF(900000) -- redundant filter to change CE
AND ID > dbo.MY_FAVORITE_UDF(100000) - 1;

Query plan:

blog picture 5
We can also mix things up with OR logic to make more adjustments. The query below has a fixed CE of 4.59%:

SELECT ID, NOT_ID
FROM dbo.Example
WHERE ID >= dbo.MY_FAVORITE_UDF(100000)
AND ID <= dbo.MY_FAVORITE_UDF(900000) -- redundant filter to change CE
AND (ID > dbo.MY_FAVORITE_UDF(100000) - 1
OR ID > dbo.MY_FAVORITE_UDF(100000) - 2);

Query plan:

blog picture 6

It should be possible to mix and match to get something close to the CE that you want. I need to reiterate that as the code is written this will lead to additional UDF executions per row. You can also use techniques with fixed CE that don’t involve UDFs if you’re confident that Microsoft won’t change the guesses for them (which for the legacy cardinality estimator is probably a pretty safe assumption at this point).

Increasing the Cardinality Estimate


In some cases we will want a cardinality estimate above 9%.

Method 1

The TOP PERCENT trick won’t work here since TOP on its own can’t increase a cardinality estimate. We can use OR logic with UDFs to raise the estimate. Consider this filter condition:

ID >= dbo.MY_FAVORITE_UDF(100000)
OR ID >= dbo.MY_FAVORITE_UDF(900000) - 1

The first inequality gives an estimate of 30% and the second inequality gives an estimate of (100% – 30%) * 30% = 21%. In total we would get an estimate of 51%. If we apply that twice we should get an overall estimate of 0.51 * 0.51 = 26.01% . This is indeed what happens:

SELECT ID, NOT_ID
FROM dbo.Example
WHERE (ID >= dbo.MY_FAVORITE_UDF(1)
OR ID >= dbo.MY_FAVORITE_UDF(1) - 1)
AND (ID <= dbo.MY_FAVORITE_UDF(2)
OR ID <= dbo.MY_FAVORITE_UDF(2) + 1);

Query plan:

blog picture 7

By adding more UDFs to the OR clauses we can increase the cardinality estimate further.

Method 2

For another way to do it we can take advantage of the fact that an inequality filter against a UDF has the same cardinality as the negated condition. That means that this:

SELECT ID, NOT_ID
FROM dbo.Example

EXCEPT

SELECT ID, NOT_ID
FROM dbo.Example
WHERE -- negate original expression
ID < dbo.MY_FAVORITE_UDF(100000) OR ID > dbo.MY_FAVORITE_UDF(900000);

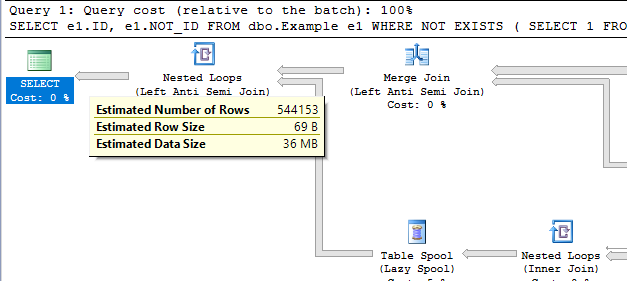
Will return the same results as the original query but have a much higher cardinality estimate. Writing it in a better way, we see a cardinality estimate of ~54.4%:

SELECT e1.ID, e1.NOT_ID
FROM dbo.Example e1
WHERE NOT EXISTS (
	SELECT 1
	FROM dbo.Example e2
	WHERE e1.ID = e2.ID
	-- negate original expression
	AND e2.ID < dbo.MY_FAVORITE_UDF(100000) OR e2.ID > dbo.MY_FAVORITE_UDF(900000)
);

Query plan:

blog picture 8
This can be adjusted up and down by adding additional UDFs. It comes with the cost of an additional join so it’s hard to think of an advantage of doing it this way.

Method 3

For a third option we can use the MANY() table-valued function developed by Adam Machanic. This function can be used to increase the cardinality estimate of a point in a plan by a whole number. If we want a cardinality estimate of 18% from the UDF it’s as easy as the following:

SELECT TOP (9223372036854775807) ID, NOT_ID
FROM dbo.Example
CROSS JOIN dbo.Many(2)
WHERE ID BETWEEN dbo.MY_FAVORITE_UDF(100000)
AND dbo.MY_FAVORITE_UDF(900000);

Query plan:

blog picture 9

I added the superfluous TOP to prevent the MANY() reference from getting moved around in the plan. This method has the disadvantage that it may not be platform-agnostic.

Hopefully you never find yourself in a situation where you need to use tricks like this. Thanks for reading!

Going Further


If this is the kind of SQL Server stuff you love learning about, you’ll love my training. I’m offering a 75% discount to my blog readers if you click from here. I’m also available for consulting if you just don’t have time for that and need to solve performance problems quickly.