The Other SolarWinds Email
If you’re running SolarWinds Database Performance Analyzer, you might have thought you dodged the SQL Sentry pricing bullet. DPA is the lighter-weight option. The one that doesn’t try to monitor your entire Microsoft ecosystem. The one that just focuses on database performance.
And then the renewal shows up and you remember that “lighter-weight” doesn’t mean “lighter on the wallet.”
What a DPA Renewal Actually Costs
DPA licenses per monitored instance, same as its sibling SQL Sentry. Pricing starts somewhere around $1,200 per instance per year, and goes up from there depending on your database platform, how many instances you’re monitoring, and how much your sales rep likes you.
And that’s just the license. SolarWinds will happily sell you professional services for implementation ($5,000 to $20,000 depending on complexity), training ($2,000 per person), and support subscriptions on top of the annual fee. It adds up in the way that things always add up when a vendor’s pricing page says “contact us.”
This is also, once again, SolarWinds. The company whose software update mechanism was compromised in the supply chain breach heard ’round the world. I know, I know, different product, different team, they’ve improved things. But the brand still carries that luggage, and your security team knows it.
What You Get for That Money
I’ll give DPA its due. The core idea behind it is solid: focus on wait-time analysis to figure out where your queries are spending their time. That’s the right way to think about database performance, and DPA was doing it before a lot of other tools caught on. The response time analysis view is genuinely useful. You can see which queries are contributing the most to total wait time, drill into what they’re waiting on, and get a sense of where your biggest problems are.
It also supports multiple database platforms, Oracle, MySQL, PostgreSQL, not just SQL Server, so if you’re a multi-platform shop, that’s a real advantage. And the anomaly detection stuff, where it learns your baseline and flags deviations, is nice when it works.
But there are some real complaints out there. The UI gets frustrating fast. Trying to navigate from a wait bar to the actual query text by hovering over hash values is the kind of experience that makes you question your career choices. The reporting isn’t as flexible as you’d want. DPA needs its own web server running somewhere, which is more infrastructure to babysit. And the agent can be a resource consumer on servers that are already tight on CPU or memory, which is a bit ironic for a performance monitoring tool.
What Free Looks Like in 2026
Here’s the thing about DPA’s wait-time approach: it’s the right idea, but it’s not a proprietary idea. SQL Server has been exposing wait statistics through DMVs since 2005, and PostgreSQL has wait events too. You don’t need to pay per-instance to see them.
PerformanceMonitor collects wait stats with delta calculations on a schedule you control, so you’re seeing what’s happening right now, not just cumulative numbers since the last restart. Trend charts show you whether a wait is getting worse over hours, days, or weeks, and 144 benign wait types are excluded by default so you’re not staring at LAZYWRITER_SLEEP wondering if something’s on fire.
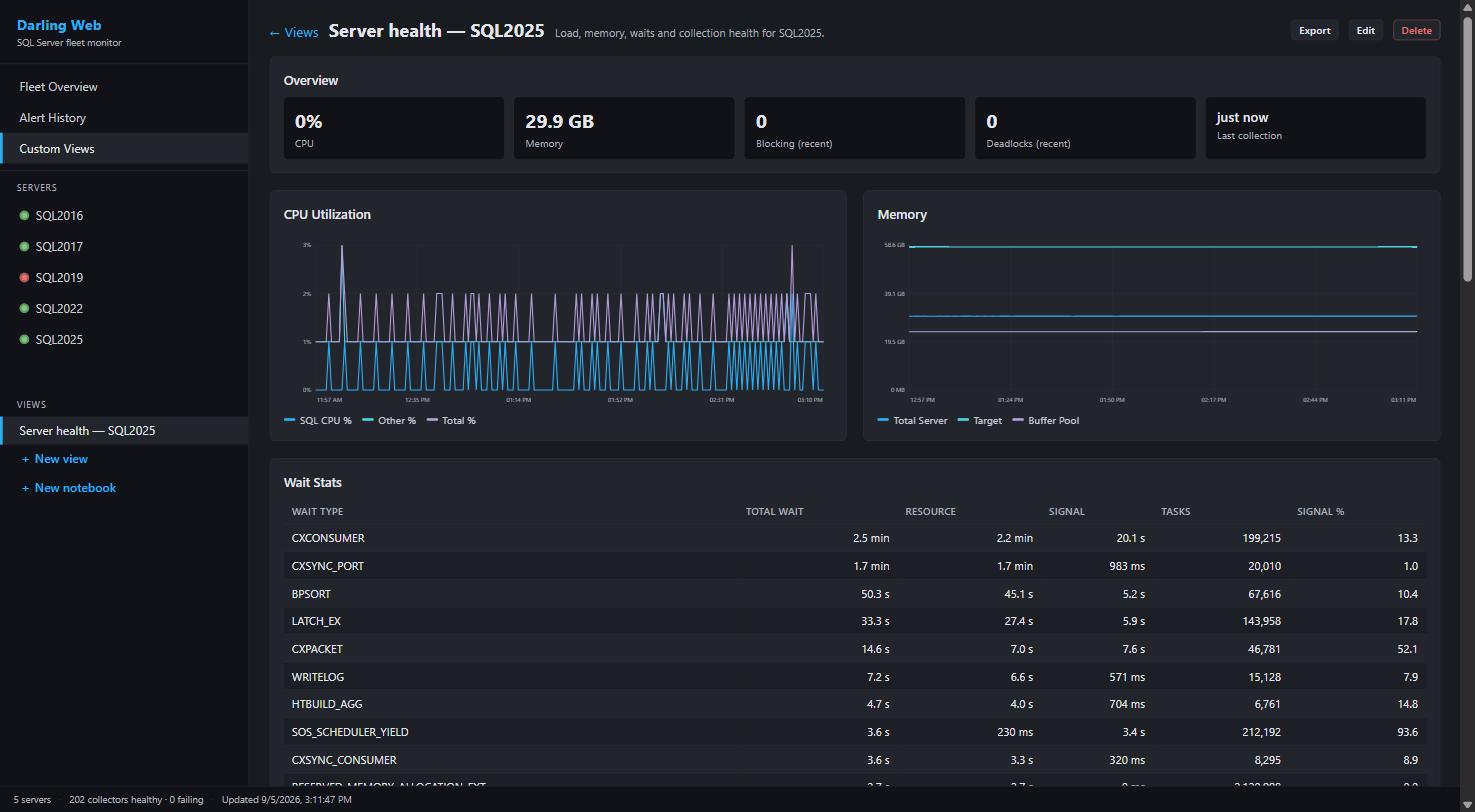
Wait stats with signal breakdown, CPU, and memory on one server health dashboard. Every number is a stored series you can trend.
And here’s the part that changes the DPA conversation specifically: the Darling edition now monitors PostgreSQL too, including Aurora and RDS, with more than 25 PostgreSQL-specific collectors. Wait events, statement stats, execution plans captured through auto_explain even on managed hosting, index usage, bloat that’s measured instead of estimated, autovacuum health, replication. If DPA was your answer for “one tool for SQL Server and Postgres,” that answer now has a free competitor. Oracle and MySQL it does not do, and I’m not going to pretend otherwise.
Beyond wait stats, you get the rest of the picture: top queries by CPU, stored procedure stats, blocking chains, deadlock analysis, memory grants, file I/O latency, TempDB, perfmon counters, and execution plan capture with a 30-rule plan analyzer. Real-time alerts over email and webhooks (Slack, Teams, PagerDuty, generic HTTP) when blocking, deadlocks, CPU, or poison waits cross your thresholds.
Two editions. Darling is a headless service with its own bundled time-series store that watches a whole fleet around the clock and serves a web dashboard to your team’s browsers, so nobody has to install anything to check on a server. Lite is the simplicity play: download it, point it at a server, data in five minutes, nothing installed on the target, nothing touching your SQL Agent, everything stored locally. If DPA’s appeal was “it’s not a platform, it’s just database monitoring,” Lite is that idea taken seriously.
The built-in MCP server means you can ask Claude or Cursor questions about your monitoring data in plain English. “What are the top wait types on my server this week” is a question you can just ask, and get an answer from your actual data. No hovering over hash values required.
What You Give Up
DPA covers Oracle and MySQL; PerformanceMonitor covers SQL Server and PostgreSQL. If you’re monitoring Oracle, that’s your answer and it isn’t me. There’s also no machine-learning anomaly baseline. There is a scheduled analysis engine that files findings, and a full alert engine with thresholds you set, but if you specifically want the self-learning kind, that’s a real difference.
But if your DPA deployment is mostly watching SQL Server and PostgreSQL, and most of what you do is look at wait stats, find expensive queries, and get alerted when something goes wrong, that’s exactly what PerformanceMonitor does. For free. With every query it runs against your servers visible in the source code.
No black box. No agent consuming resources on the box you’re trying to keep healthy. No per-instance math that makes your finance team twitch.
If Procurement Needs a Vendor
If open source needs a paper trail before it’s allowed in your shop, there’s a support subscription: $500 a year, unlimited instances, real invoices, guaranteed compatibility updates. Less than half of one DPA instance.
Before You Sign
DPA’s whole pitch is “we focus on what matters: wait time.” PerformanceMonitor focuses on the same thing, plus a lot of other stuff, on both of the engines most shops actually run, and it costs nothing.
If you’re staring at a renewal for a tool that shows you wait stats and you’re paying four or five figures a year for the privilege, maybe take an afternoon and see if the free version covers what you actually need.
It costs nothing to find out if it’s enough.
Thanks for reading.