Last Year
Kendra and I both taught solo precons, and got to talking about how much easier it is to manage large crowds when you have a little helper with you, and decided to submit two precons this year that we’d co-present.
Amazingly, they both got accepted. Cheers and applause. So this year, we’ll be double-teaming Monday and Tuesday with a couple pretty cool precons.
You can register for PASS Summit here, taking place live and in-person November 4-8 in Seattle.
Here are the details!
Day One: A Practical Guide to Performance Tuning Internals
Whether you’re aiming to be the next great query tuning wizard or you simply need to tackle tough business problems at work, you need to understand what makes a workload run fast– and especially what makes it run slowly.
Erik Darling and Kendra Little will show you the practical way forward, and will introduce you to the internal subsystems of SQL Server with a practical guide to their capabilities, weaknesses, and most importantly what you need to know to troubleshoot them as a developer or DBA.
They’ll teach you how to use your understanding of the database engine, the storage engine, and the query optimizer to analyze problems and identify what is a nothingburger best practice and what changes will pay off with measurable improvements.
With a blend of bad jokes, expertise, and proven strategies, Erik and Kendra will set you up with practical skills and a clear understanding of how to apply these lessons to see immediate improvements in your own environments.
Day Two: Query Quest: Conquer SQL Server Performance Monsters
Picture this: a day crammed with fun, fascinating demonstrations for SQL Server and Azure SQL.
This isn’t your typical training day; this session follows the mantra of “learning by doing,” with a good dose of the unexpected. Think of this as a SQL Server video game, where Erik Darling and Kendra Little guide you through levels of weird query monsters and performance tuning obstacles.
By the time we reach the final boss, you’ll have developed an appetite for exploring the unknown and leveled up your confidence to tackle even the most daunting of database dilemmas.
It’s SQL Server, but not as you know it—more fun, more fascinating, and more scalable than you thought possible.
Going Further
We’re both really excited to deliver these, and have BIG PLANS to have these sessions build on each other so folks who attend both days have a real sense of continuity.
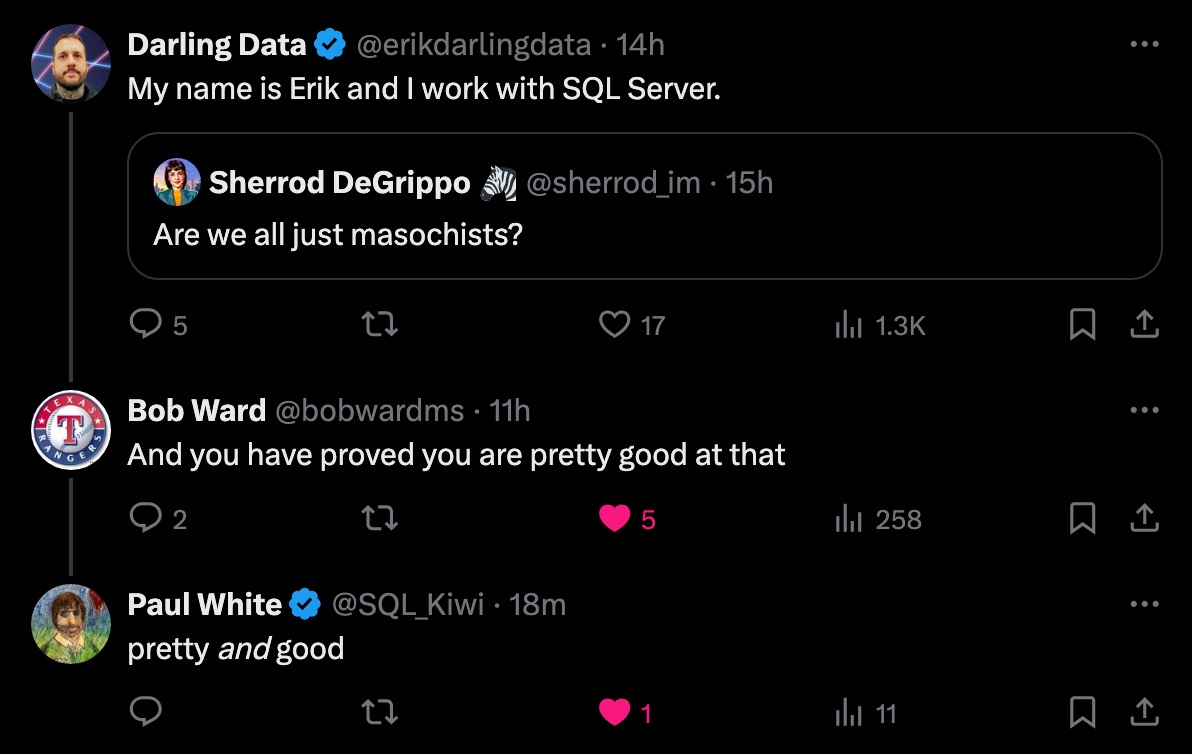
Of course, you’re welcome to pick and choose, but who’d wanna miss out on either of these with accolades like this?

You can register for PASS Summit here, taking place live and in-person November 4-8 in Seattle.
See you there!
Going Further
If this is the kind of SQL Server stuff you love learning about, you’ll love my training. I’m offering a 75% discount to my blog readers if you click from here. I’m also available for consulting if you just don’t have time for that, and need to solve database performance problems quickly. You can also get a quick, low cost health check with no phone time required.