Getting Parameter Values From A SQL Server Query Plan For Performance Tuning

Property Management


I’m a really big fan of using operator properties for a lot of things, at least visually. Where things sort of fall down for that is copying and pasting things out.

For some stuff, you still need to head down to the XML.

Let’s say you have a stored procedure that accepts a bunch of parameters. The rest of this one isn’t important, but here you go:

CREATE OR ALTER PROCEDURE 
    dbo.AwesomeSearchProcedure 
( 
    @OwnerUserId int = NULL, 
    @CreationDate datetime = NULL, 
    @LastActivityDate datetime = NULL,
    @PostTypeId int = NULL,
    @Score int = NULL,
    @Title nvarchar(250) = NULL, 
    @Body nvarchar(MAX) = NULL 
)

A Plan Appears


Let’s say we grab a query plan for this thing from the plan cache or query store. We can get the properties of the select operator and see compile time values:

EXEC dbo.AwesomeSearchProcedure 
    @OwnerUserId = 35004,
    @CreationDate = '20130101', 
    @LastActivityDate = '20140101',
    @Title = N'SQL Server';

We get this back:

SQL Server Query Plan
visio

Again — nice visually — but it doesn’t do much for us if we want to recreate executing the stored procedure to get an actual execution plan.

It’s also not terrible helpful if we want to simulate a parameter sniffing situation, because we only have the compile time values, not the run time values.

Bummer. But whatever.

XML Time!


If we right click and select “show execution plan XML”, we can scroll way down to the bottom to find the XML fragment that holds what the properties display:

<ParameterList>
  <ColumnReference Column="@iTitle" ParameterDataType="nvarchar(250)" ParameterCompiledValue="N'SQL Server'" />
  <ColumnReference Column="@iLastActivityDate" ParameterDataType="datetime" ParameterCompiledValue="'2014-01-01 00:00:00.000'" />
  <ColumnReference Column="@iCreationDate" ParameterDataType="datetime" ParameterCompiledValue="'2013-01-01 00:00:00.000'" />
  <ColumnReference Column="@iOwnerUserId" ParameterDataType="int" ParameterCompiledValue="(35004)" />
</ParameterList>

This still isn’t awesome, because we have to do some surgery on the XML itself to get values out.

It’s even worse if we have a parameterized application query, because not only do we need to make a DECLARE to assign values to these variables but we need to turn the query itself into dynamic SQL.

If we don’t do that, we’ll fall victim to a common pitfall: testing queries with local variables.

Passwords


For most things, I absolutely adore using operator properties. For some things, you still need the XML.

It’d be nice if there were some fancy copy and paste magic that would do that for you, but so far it doesn’t exist.

Thanks for reading!

Going Further


If this is the kind of SQL Server stuff you love learning about, you’ll love my training. I’m offering a 75% discount to my blog readers if you click from here. I’m also available for consulting if you just don’t have time for that and need to solve performance problems quickly.

A Resource Governor Request: Cap Total Query Memory Grants (Without Capping Other Stuff)

Easy Peas


I know what you’re gonna say: You’re gonna say, Erik, you can do this by setting the Maximum Memory Percent for each and every resource pool other than the internal one.

And I’ll tell you something wacky: That limits more than just total query memory grants, and all I want is an easy and straightforward way to tell SQL Server that I don’t want it to give up huge swaths of my buffer pool to query memory grants.

While the Memory Grant Percent setting makes it really easy to cap the total memory grant a single query can ask for, nothing does a singular job of controlling how much total memory queries can ask for as a whole, without also stifling other caches that contribute to Stolen Server Memory, like the plan cache. A very big thank you to LMNOP(b|t) for helping me figure that out.

The other downside is that you’d have to set that cap for each pool, and that’s exhausting. Tiresome. Easy to get wrong. It’d be a whole lot easier and cleaner to set that globally, without also nerfing a bunch of other potentially useful caches.

Thanks for reading!

Going Further


If this is the kind of SQL Server stuff you love learning about, you’ll love my training. I’m offering a 75% discount to my blog readers if you click from here. I’m also available for consulting if you just don’t have time for that and need to solve performance problems quickly.

Does Using TOP In A SQL Server Common Table Expression Materialize It?

Nope.


The sad news for you here is that nothing aside from selecting a CTE into a real or temporary table will materialize the result of the query within in it.

WITH 
    cte AS
(
    SELECT TOP (1)
        u.Id
    FROM dbo.Users AS u
)
SELECT
    c1.*
FROM cte AS c1
JOIN cte AS c2
    ON c1.Id = c2.Id
JOIN cte AS c3
    ON c1.Id = c3.Id;

This query will still have to touch the Users table three times. I’ve blogged about this part before, of course.

SQL Server Query Plan
butty

Bounce


You may notice something interesting in there, though, once you get past the disappointment of seeing three scans of the Users table.

Each scan is preceded by the TOP operator. This can sometimes be where people confuse the behavior of TOP in a Common Table Expression or Derived Table.

It’s not a physical manifestation of the data into an object, but (at least for now) it is a logical separation of the query semantics.

In short, it’s a fence.

The reason why it’s a fence is because using TOP sets a row goal, and the optimizer has to try to meet (but not exceed) that row goal for whatever part of the query is underneath it.

Strange


Take this query for example, which loads a bunch of work into a Common Table Expression with a TOP in it:

WITH
    Posts AS
(
    SELECT TOP (1000)
         p.*
    FROM dbo.Posts AS p
    WHERE p.PostTypeId = 1
    AND   p.Score > 500
    AND   EXISTS
          (
              SELECT
                  1/0
               FROM dbo.Users AS u
               WHERE u.Id = p.OwnerUserId
          )
    AND EXISTS
        (
            SELECT
                1/0
            FROM dbo.Badges AS b
            WHERE b.UserId = p.OwnerUserId
        )
    ORDER BY p.Score DESC
)
SELECT
    u.DisplayName,
    p.PostTypeId,
    p.Score
FROM dbo.Users AS u
JOIN Posts AS p
    ON p.OwnerUserId = u.Id
ORDER BY u.Reputation DESC;

And the plan for it looks like this:

SQL Server Query Plan
lucky one

All the work within the Common Table Expression is fenced by the top.

There are many times you can use this to your advantage, when you know certain joins or predicates can produce a very selective result.

Care Control


As a final note, just be really careful how you position your TOPs. They insert loads of semantic differences to the query.

If you don’t believe me, put a TOP in the wrong place and watch your results change dramatically.

Thanks for reading!

Going Further


If this is the kind of SQL Server stuff you love learning about, you’ll love my training. I’m offering a 75% discount to my blog readers if you click from here. I’m also available for consulting if you just don’t have time for that and need to solve performance problems quickly.

SQLBits 2022: Exactly How It Should Be

Get Together


This post is obviously biased, because I loved SQLBits well before going this year. Everyone involved just kinda gets it, and makes things as nice and easy for presenters and attendees as possible.

I can’t say enough good things about it, because it really avoids a lot of the stuff I dislike about other conferences I’ve attended. If you’ve never been, go.

Of course, this year was important for different reasons. I’ll spare you all the honey-drizzle about rebuilding the community. It’s an important group effort, but I’m not a group. I’m just me.

I want to be part of that group, and to do that there were things I had to personally accomplish:

  • Feeling like life can be normal again
  • Getting some of the humanity back into interactions

Some folks out there aren’t ready for that, or don’t need that, and that’s fine. I hope you get there eventually, if that’s something you want.

I do need that. It’s part of how I stay mentally healthy. Twitter is not a great way for me to do that, shockingly.

We’re All Clones


In two years of virtual-everything, and only online interactions, it sort of became easy to forget the people behind the words on your screen.

I burned out on virtual events really early on. It did not scratch the itch that teaching or attending in-person did.

If I’m not enjoying myself as a presenter, then the product you get as an attendee is going to suffer. That sucks for both of us.

And that’s why I’m jumping back onto in-person stuff.

Getting on stage and seeing a room full of Butts-In-Seats just does it for me. Getting out in the crowd and talking to people does it for me.

I’ll do that all day long. It doesn’t even feel like work.

Looking Forward


I’ve already booked flights and hotels for PASS in Seattle this November. I’d written that event off under the old ownership, for many obvious reasons.

That wasn’t a rash or unfair choice, either. After all, they made me pay to attend my own precon because Brent was listed as the primary speaker.

That sort of crap is how you lose a community fast.

I’m interested to see how Red Gate handles things, and hopeful that it’s as friction-free as possible, in all directions.

A well lubricated event is important.

Thanks for reading!

Going Further


If this is the kind of SQL Server stuff you love learning about, you’ll love my training. I’m offering a 75% discount to my blog readers if you click from here. I’m also available for consulting if you just don’t have time for that and need to solve performance problems quickly.

Understand Your Plan: Operator Properties

Dragging The Line


There’s a lot of stuff flying around in a query plan. Data and what not.

Sure, you can hover over operators and arrows and see some stuff, but if you really wanna see stuff — I mean REALLY wanna see stuff — you gotta get into the properties.

You can access those in two ways:

  • Hit F4 (not F5 again; you already suffered through that)
  • Right click on any operator in the query plan and hit Properties

And that, my dear friend, will unlock many mysteries in your query plans.

Start With Select


I think one of the most interesting places to start is with the root operator (select, insert, update, delete), because there’s so much in there.

Here’s an abridged list of things you can see from the properties of the root node of an Actual Execution Plan:

  • Compile metrics: CPU, duration, memory
  • Degree Of Parallelism
  • Detailed Memory Grant information
  • Stats Usage
  • Query Time Stats in CPU and duration (including UDF times)
  • Parameter compile and runtime values
  • Nonparallel Plan reasons
  • Set Options
  • Warnings
  • CPU thread usage
  • Wait Stats

There’s more in there too, but holy cow! All the stuff you can learn here is fantastic. You might not be able to solve all your problems looking here, but it’s as good a place to start as any.

Plus, this is where you can get a sense of just how long your query ran for, and start tracking down the most troublesome operators.

Follow The Time


I’ve said before that operator costs are basically useless, and you should be following the operator times to figure out where things get wonky.

For some operators, just looking at the tool tip is enough. For example, if you have an operator that piles up a bunch of execution time because of a spill, the spill details are right in front of you.

SQL Server Query Plan
contagious

But other times, operator properties expose things that aren’t surfaced at the tool tip.

Skew Manchu


Take skewed parallelism, for example. There are no visual indicators that it happened (maybe there should be, but given the warnings we get now, I’m not sure I trust that summer intern).

SQL Server Query Plan
year of the spider

But you know, it might be nice to know about stuff like this. Each thread is supposed to get an equal portion of the query memory grant, and if work is distributed unevenly, you can end up with weird, random performance issues.

This is something I almost always spot check in parallel plans. In a perfect world, duration would be CPU➗DOP. Life rarely ends up perfect, which is why it’s worth a look.

I To The O


You can also see I/O stats at the operator level, logical and physical. This is why I kinda laugh at folks who still use SET STATISTICS TIME, IO ON; — you can get that all in one place — your query plan.

SQL Server Query Plan
ding!

You can interpret things in the same way, it’s just a little easier to chew.

Thanks for reading!

Going Further


If this is the kind of SQL Server stuff you love learning about, you’ll love my training. I’m offering a 75% discount to my blog readers if you click from here. I’m also available for consulting if you just don’t have time for that and need to solve performance problems quickly.

Understand Your Plan: Query Plan Warnings

Good And Bad


The good news is that SQL Server’s query plans will attempt to warn you about problems. The bad news is that most of the warnings only show up in Actual Execution Plans. The worse news is that a lot of the warnings that try to be helpful in Estimated Execution plans can be pretty misleading.

Here’s a current full list:

<xsd:element name="SpillOccurred" type="shp:SpillOccurredType" minOccurs="0" maxOccurs="1"/>
<xsd:element name="ColumnsWithNoStatistics" type="shp:ColumnReferenceListType" minOccurs="0" maxOccurs="1"/>
<xsd:element name="SpillToTempDb" type="shp:SpillToTempDbType" minOccurs="0" maxOccurs="unbounded"/>
<xsd:element name="Wait" type="shp:WaitWarningType" minOccurs="0" maxOccurs="unbounded"/>
<xsd:element name="PlanAffectingConvert" type="shp:AffectingConvertWarningType" minOccurs="0" maxOccurs="unbounded"/>
<xsd:element name="SortSpillDetails" type="shp:SortSpillDetailsType" minOccurs="0" maxOccurs="unbounded"/>
<xsd:element name="HashSpillDetails" type="shp:HashSpillDetailsType" minOccurs="0" maxOccurs="unbounded"/>
<xsd:element name="ExchangeSpillDetails" type="shp:ExchangeSpillDetailsType" minOccurs="0" maxOccurs="unbounded"/>
<xsd:element name="MemoryGrantWarning" type="shp:MemoryGrantWarningInfo" minOccurs="0" maxOccurs="1"/>

<xsd:attribute name="NoJoinPredicate" type="xsd:boolean" use="optional"/>
<xsd:attribute name="SpatialGuess" type="xsd:boolean" use="optional"/>
<xsd:attribute name="UnmatchedIndexes" type="xsd:boolean" use="optional"/>
<xsd:attribute name="FullUpdateForOnlineIndexBuild" type="xsd:boolean" use="optional"/>

Certain of these are considered runtime issues, and are only available in Actual Execution Plans, like:

  • Spills to tempdb
  • Memory Grants

I’ve never seen the “Spatial Guess” warning in the wild, which probably speaks to the fact that you can measure Spatial data/index adoption in numbers that are very close to zero. I’ve also never seen the Full Update For Online Index Build warning.

Then there are some others like Columns With No Statistics, Plan Affecting Converts, No Join Predicate, and Unmatched Indexes.

Let’s talk about those a little.

Columns With No Statistics


I almost never look at these, unless they’re from queries hitting indexed views.

The only time SQL Server will generate statistics on columns in an indexed view is when you use the NOEXPAND hint in your query. That might be very helpful to know about, especially if you don’t have useful secondary indexes on your indexed view.

If you see this in plans that aren’t hitting an indexed view, it’s likely that SQL Server is complaining that multi-column statistics are missing. If your query has a small number of predicates, it might be possible to figure out which combination and order will satisfy the optimizer, but it’s often not worth the time involved.

Like I said, I rarely look at these. Though one time it did clue me in to the fact that a database had auto create stats disabled.

So I guess it’s nice once every 15 years or so.

Plan Affecting Converts


There are two of these:

  • Ones that might affect cardinality estimates
  • Ones that might affect your ability to seek into an index

Cardinality Affecting

The problem I have with the cardinality estimation warning is that it shows up when it’s totally useless.

SELECT TOP (1)
    Id = CONVERT(varchar(1), u.Id)
FROM dbo.Users AS u;
SQL Server Query Plan
fine2me

Like I said, misleading.

Seek Affecting

These can be misleading, but I often pay a bit more attention to them. They can be a good indicator of data type issues in comparison operations.

Where they’re misleading is when they tell you they mighta-coulda done a seek, when you don’t have an index that would support a seek.

SELECT TOP (1)
    u.Id
FROM dbo.Users AS u
WHERE u.Reputation = CONVERT(sql_variant, N'138');
SQL Server Query Plan
knot4you

Of course, without an index on Reputation, what am I going to seek to?

Nothing. Nothing at all.

No Join Predicate


This one is almost a joke, I think.

Back when people wrote “old style joins”, they could have missed a predicate, or something. Like so:

SELECT
    c = COUNT_BIG(*)
FROM dbo.Users AS u, 
     dbo.Badges AS b, 
     dbo.Comments AS c
WHERE u.Id = b.UserId;
/*Oops no join on comments!*/

Except there’s no warning in this query plan for a missing join predicate.

SQL Server Query Plan
well okay

But if we change the query to this, it’ll show up:

SELECT
    u.Id
FROM dbo.Users AS u, 
     dbo.Badges AS b, 
     dbo.Comments AS c
WHERE u.Id = b.UserId;
/*Oops no join on comments!*/
SQL Server Query Plan
greatly

But let’s take a query that has a join predicate:

SELECT TOP (1)
    b.*
FROM dbo.Comments AS c
JOIN dbo.Badges AS b
    ON c.UserId = b.UserId
WHERE b.UserId = 22656;

We still get that warning:

SQL Server Query Plan
tough chickens

We still get a missing join predicate, even though we have a join predicate. The predicate is implied here, because of the where clause.

But apparently the check for this is only at the Nested Loops Join. No attempt is made to track pushed predicates any further.

SQL Server Query Plan
run for your life

If there were, the warning would not appear.

Unmatched Indexes


If you create filtered indexes, you should know a couple things:

  • It’s always a good idea to have the column(s) you’re filter(ing) on somewhere in the index definition (key or include, whatever)
  • If query predicate(s) are parameterized on the column(s) you’re filter(ing) on, the optimizer probably won’t choose your filtered index

I say probably because recompile hints and unsafe dynamic SQL may prompt it to use your filtered index. But the bottom line here is parameters and filtered indexes are not friends in some circumstances.

Here’s a filtered index:

CREATE INDEX
    cigarettes
ON dbo.Users
    (Reputation)
WHERE
    (Reputation >= 1000000)
WITH
    (SORT_IN_TEMPDB = ON, DATA_COMPRESSION = PAGE);

And here’s a query that should use it:

SELECT 
    u.Reputation
FROM dbo.Users AS u
WHERE u.Reputation >= 1000000;

BUUUUUUUUUUUUUUUT!

SQL Server Query Plan
combine

SQL Server warns us we didn’t. This is an artifact of Simple Parameterization, which happens early on in the Trivial Plan optimization phase.

It’s very misleading, that.

Warnings And Other Drugs


In this post we covered common scenarios when plan warnings just don’t add up to much of a such. Does that mean you should always ignore them? No, but also don’t be surprised if your investigation turns up zilch.

If you’re interested in learning more about spills, check out the Spills category of my blog. I’ve got a ton of posts about them.

At this point, you’re probably wondering why people bother with execution plans. I’m sort of with you; everything up to the actual version feels futile and useless, and seems to lie to you.

Hopefully Microsoft invests more in making the types of feedback mechanisms behind gathering plans and runtime metrics easier for casual users in future versions of SQL Server.

Thanks for reading!

Going Further


If this is the kind of SQL Server stuff you love learning about, you’ll love my training. I’m offering a 75% discount to my blog readers if you click from here. I’m also available for consulting if you just don’t have time for that and need to solve performance problems quickly.

Understand Your Plan: Missing Index Requests

Just A Friend


Missing index requests aren’t perfect, and that’s okay. But you need to know where they’re not okay so you can start creating better ones.

Let’s start with some basics:

  • They really only care about the where clause
  • Joins always seem to end up in the INCLUDE list
  • Column suggestions are not in any particular order
    • Outside of being grouped into equality and inequality predicates
  • The impact is based on operator costs, which is often complete crap

There’s more, but this is a good start. Good starts are good. Nice things are nice.

And of course, the day this blog published, Microsoft published a huge update to missing index docs, by way of the fabulous Kendra Little.

Let’s move on.

Users


The Users table looks like this. It’s important for me to show you this up front, because column ordinal position in the table is important for understanding missing index requests.

SQL Server Query Plan
what-whatcha need?

Keep this in mind — the columns aren’t in alphabetical order, or how selective they are, or by data type, etc.

They’re in the order that they are when the table was created, and then if any of them were added later on.

That’s all.

Long Time


Let’s take this query:

SELECT TOP (10000)
    u.Id,
    u.AccountId,
    u.DisplayName,
    u.Reputation,
    u.Views,
    u.CreationDate
FROM dbo.Users AS u
WHERE u.Views = 0
ORDER BY u.CreationDate DESC;

Is it very useful? No. But it’ll help us paint the right picture. The query plan doesn’t matter, because it’s just a clustered index scan, and it’ll be a clustered index scan for every other permutation, too.

The missing index for this query is like so:

CREATE NONCLUSTERED INDEX [<Name of Missing Index, sysname,>]
ON [dbo].[Users] ([Views])
INCLUDE ([CreationDate],[DisplayName],[Reputation],[AccountId])

Only the Views column is in the key of the index, even though CreationDate is an order by column.

In this case, it would be beneficial to have it as the second key column, because it would be sorted for free for us after an equality predicate.

You may also notice that Id is not part of the definition too. That’s because it’s the clustered index, so it will be inherited by any nonclustered indexes we create.

Normal


Okay, now let’s look at this query, with a slightly different where clause:

SELECT TOP (10000)
    u.Id,
    u.AccountId,
    u.DisplayName,
    u.Reputation,
    u.Views,
    u.CreationDate
FROM dbo.Users AS u
WHERE u.Views = 0
AND   u.Reputation = 1
ORDER BY u.CreationDate DESC;

We’re adding another predicate on Reputation = 1 here. The missing index request now looks like this:

CREATE NONCLUSTERED INDEX [<Name of Missing Index, sysname,>]
ON [dbo].[Users] ([Reputation],[Views])
INCLUDE ([CreationDate],[DisplayName],[AccountId])

Neither one of these predicates is particularly selective (7,954,119 and 6,197,417, respectively) but Reputation ends up first in the key column list because its ordinal position in the table is first.

Frequency


How about if we add a really selective predicate to our query?

SELECT TOP (10000)
    u.Id,
    u.AccountId,
    u.DisplayName,
    u.Reputation,
    u.Views,
    u.CreationDate
FROM dbo.Users AS u
WHERE u.AccountId = 12462842
AND   u.Views = 0
ORDER BY u.CreationDate DESC;

Now our missing index request looks like this:

CREATE NONCLUSTERED INDEX [<Name of Missing Index, sysname,>]
ON [dbo].[Users] ([Views],[AccountId])

Two things happened:

  • We don’t have any included columns anymore
  • AccountId is second in the key columns

This is amusing because the missing index request machine seems to understand that this will only ever one row via the equality predicate on AccountId but it still gets enumerated as the second index key column.

In other words, it doesn’t put the most selective column first. It gives you an index designed, like other examples, based on the column’s ordinal position in the table.

Nothing else, at least not so far.

Inequality


Where missing index requests will change column order is when it comes to inequality predicates. That doesn’t just mean not equal to, oh no no no.

That covers any “range” predicate: <, <=, >, >=, <> or !=, and IS NOT NULL.

Take this query for example:

SELECT TOP (10000)
    u.Id,
    u.AccountId,
    u.DisplayName,
    u.Reputation,
    u.Views,
    u.CreationDate
FROM dbo.Users AS u
WHERE u.AccountId = 0
AND   u.Reputation < 0
AND   u.Views < 0
ORDER BY u.CreationDate DESC;

The missing index request looks like this:

CREATE NONCLUSTERED INDEX [<Name of Missing Index, sysname,>]
ON [dbo].[Users] ([AccountId],[Reputation],[Views])

Now AccountId is the leading key column, but Reputation and Views are still in ordinal position order as inequality predicates.

Wink Wink


Now, look, I started off by saying that missing index requests aren’t perfect, and that’s okay. They’re not meant to replace a well-trained person. They’re meant to help the hapless when it comes to fixing slow queries.

As you get more comfortable with indexes and how to create them to make queries go faster, you’ll start to see deficiencies in missing index requests.

But you don’t want the optimizer spending a long time in the index matching/missing index request phases. That’s a bad use of its time.

As you progress, you’ll start treating missing index requests like a crying baby: something might need attention, but it’s up to you as an adult DBA or developer to figure out what that is.

Thanks for reading!

Going Further


If this is the kind of SQL Server stuff you love learning about, you’ll love my training. I’m offering a 75% discount to my blog readers if you click from here. I’m also available for consulting if you just don’t have time for that and need to solve performance problems quickly.

Understand Your Plan: Costs (And Why You Shouldn’t Bother With Them)

Goodfor


Costs are okay for figuring out why SQL Server’s cost-based optimizer:

  • Chose a particular query plan
  • Chose a particular operator

Costs are not okay for figuring out:

  • Which queries are the slowest
  • Which queries you should tune first
  • Which missing index requests are the most important
  • Which part of a query plan was the slowest

But a lot of you believe in memes like this, which leads to my ongoing employment, so I’m not gonna try to wrestle you too hard on this.

Keep on shooting those “high cost” queries down that are part of some overnight process no one cares about while the rest of your server burns down.

I’ll wait.

Badfor


In a lot of the query tuning work I do, plan and operator costs don’t accurately reflect what’s a problem, or what’s the slowest.

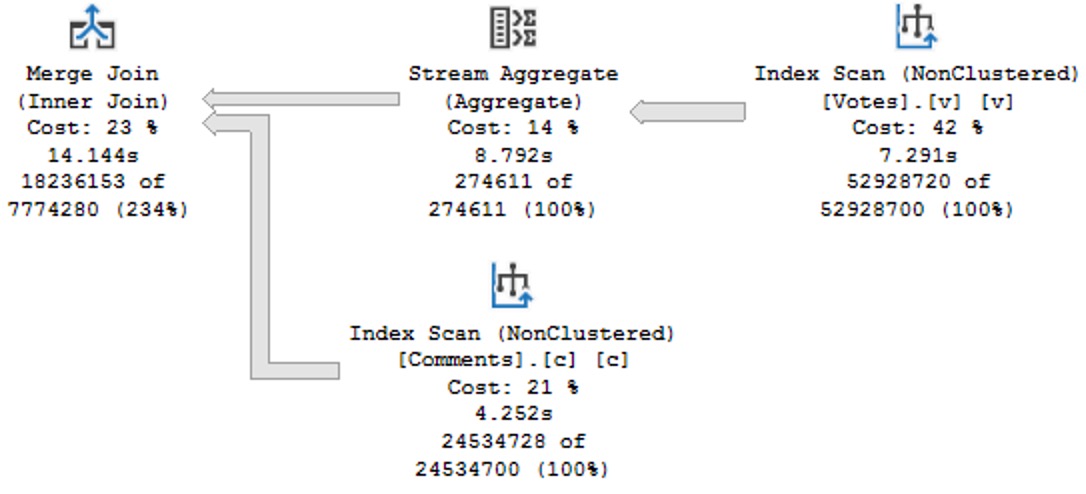
Here’s an example, from a fairly large query plan, where the operator times show nearly all the execution time in a branch full of operators where the costs aren’t particularly high.

The plan runs for ~5 seconds in total.

SQL Server Query Plan
onion

Would you suspect this branch is where ~4 of those seconds is spent? What are you gonna tune with an index seek? You people love seeks.

I’ll wait.

Time Spent


Where queries spend the most time in a plan is where you need to focus your query tuning efforts. Stop wasting time with things like costs and reads and whatnot.

If you want a good list of things not to do while troubleshooting a query, start with the bullet points in this Microsoft support blog:

  • Update the statistics and rebuild the indexes.

  • Use Recompile or MAXDOP, grant memory hint

  • Use the latest compatibility model

  • Clear buffer pool.

  • Clear procedure cache.

  • Comparing the same automatic statistics, comparing rows, etc..

  • Plan guides.

Get the query. Get the actual execution plan. Look at which operations run the longest.

Thanks for reading!

Going Further


If this is the kind of SQL Server stuff you love learning about, you’ll love my training. I’m offering a 75% discount to my blog readers if you click from here. I’m also available for consulting if you just don’t have time for that and need to solve performance problems quickly.

Understand Your Plan: Estimates And Actuals

But Really


Remember way back when maps were on paper? Some maps were so fancy they called themselves an atlas, even though you bought them at a gas station.

They were neat, and they were mostly right. If there was construction, or a road was closed for some reason, there was no way to update them fast enough to be useful.

Same deal with traffic. A route might look like the best way to go no matter what time of day you’re driving, but you wouldn’t know if it was a good idea until you started on your way.

You could hit all sorts of problems along the way, and in the age before cell phones, you wouldn’t be able to tell anyone what was happening.

Sure, you could stop at a pay phone, but everyone peed on those things and they had a bad habit of stealing your coins even if you could even remember the phone number.

I’ve said all that to say this: that’s a lot like SQL Server’s query plans today. Sure, Microsoft is making some improvements here with all the Intelligent Query Processing stuff.

Not much beyond adaptive joins are a runtime change in plan execution, though. A lot of it is stuff the optimizer adjusts between executions, like memory grants.

All Plans Are Estimates


By that I mean, win lose or draw, every execution plan you see is what the optimizer thought was the cheapest way to answer your question.

A whole lot of the time it’s right, even if it’s not perfect. There are some things I wish it were better at, for sure, like OR predicates.

For a long time I thought the costing algorithms should be less biased against random I/O, because it’s no longer a physical disk platter spinning about.

But then I saw how bad Azure storage performs, and I’m okay with leaving it alone.

Every choice in every execution plan is based on some early assumptions:

  • You’re on crappy storage
  • The data you want isn’t in the buffer pool
  • What you’re looking for exists in the data

There are some additional principles documented over here, like independence, uniformity, simple containment containment, and inclusion for the best cardinality estimator.

In the new cardinality estimator, you’ll find things like “correlation” and “base containment”. Humbug.

Plan, Actually


Estimated plans can be found in:

  • The plan cache
  • Query Store
  • Hitting CTRL + L or the “display estimated execution plan” button
  • Collecting post compilation events from Profiler or Extended Events
  • Somewhere in the middle is lightweight query profiling, which is also a total waste of time

These plans do not give you any details about where SQL Server’s plan choice was right or wrong, good or bad. Sometimes you can figure things out with them. Most of the time you’ll have to ask for an actual execution plan.

When you collect an actual execution plan, SQL Server adds in details about what happened when it executed the plan it estimated to be the cheapest. For a long time, it could still be hard to figure out where exactly you hit an issue.

That changed when Microsoft got an A+ gold star smiley face from their summer intern, who added operator times to query plans.

Actual execution plans can be found in:

  • Hitting CTRL + M or the “include actual execution plan” button
  • Collecting post execution events from Profiler or Extended Events

These are most useful when query tuning.

Reality Bites


They’re most useful because they tell the truth about what happened. Every roadblock, red light, overturned tractor trailer full of pig iron, and traffic jam that got hit along the way.

Things like:

  • Spills
  • Incorrect estimates
  • CPU time
  • Scalar UDF time
  • I/O performed
  • Wait stats (well, some of them)
  • Operator times

You get the idea. It’s a clear picture of what you might need to fix. You might not know how to fix it, but that’s what many of the other posts around here will help you with.

One thing that there’s no “actual” counterpart for are operator costs. They remain estimates. We’ll talk about those tomorrow.

Thanks for reading!

Going Further


If this is the kind of SQL Server stuff you love learning about, you’ll love my training. I’m offering a 75% discount to my blog readers if you click from here. I’m also available for consulting if you just don’t have time for that and need to solve performance problems quickly.

Understand Your Plan: Computing Scalars

Blank Slate


This is awful. It really is. It’s so awful. These operators skated by undetected for years. Acting so innocent with their 0% cost.

Subprime operators, or something.

In this post, I’m going to show you how compute scalars hide work, and how interpreting them in actual execution plans can even be tricky.

Most of the time, Compute Scalar operators are totally harmless. Most of the time.

Like this:

SELECT TOP (1)
    Id = 
        CONVERT
        (
            bigint,
            u.Id
        )
FROM dbo.Users AS u;

Has this plan:

SQL Server Query Plan
abandon

Paul White has a customarily deep and wonderful post about Compute Scalars, of course. Thankfully, he can sleep soundly knowing that my post will not overtake his for Compute Scalar supremacy.

I’m here to talk about when Compute Scalars go wild.

Mercy Seat


Compute Scalars are where Scalar User Defined Functions Hide. I know, SQL Server 2019, UDF inlining, blah blah blah.

Talk to me in five years when you finally upgrade to 2019 because your vendor just got around to certifying it.

Here’s where things get weird:

SELECT  
    @d = dbo.serializer(1)
FROM dbo.Badges AS b;
SQL Server Query Plan
wretched

Operator times in the query plan don’t match up with the Query Time Stats in the properties of the Select operator. It executed for ~108 seconds, but only ~3 seconds is accounted for.

For some reason, time isn’t tracked for variable assignment. If we use a similar query to dump the results into a #temp table, it works fine:

SELECT  
    d = dbo.serializer(1)
INTO #b
FROM dbo.Badges AS b;
SQL Server Query Plan
32 degrees

No wonder all the smart people are going over to MongoDB.

Aaron Bertrand


You know that guy? Never owned a piece of camouflage clothing. Blogs a bit. Has some wishy washy opinions about T-SQL.

Anyway, he recently wrote a couple conveniently-timed posts about FORMAT being an expensive function. Part 1, Part 2. The example here is based on his code.

SELECT  
    d = 
        CONVERT
        (
            varchar(50), 
            FORMAT
            (
                b.Date, 
                'D', 
                'en-us'
            )
        )
INTO #b
FROM dbo.Badges AS b;

Just a quick note that variable assignment of this function has the same behavior as the Scalar User Defined Function above, where operator time isn’t tracked, but it also isn’t tracked for the temp table insert:

SQL Server Query Plan
where did you go?

If you saw this query plan, you’d probably be very confused. I would be too. It helps to clarify a bit if we do the insert without the FORMAT funkiness.

SELECT  
    d = b.Date
INTO #bb
FROM dbo.Badges AS b;
SQL Server Query Plan
strange dreams

It only takes a few seconds to insert the unprocessed date. That should be enough to show you that in the prior plan, we spent ~60 seconds formatting dates.

Clams


Computer Scalar operators can really hide a lot of work. It’s a shame that it’s not tracked better.

When you’re tuning queries, particularly ones that feature Scalar User Defined Functions, you may want to take Computer Scalar costing with a mighty large grain of salt.

To recap some other points:

  • If operator times don’t match run time, check the Query Time Stats in the properties of the Select operator
  • FORMAT is nice and all, but…
  • Scalar User Defined Functions are quite poisonous

Thanks for reading!

Going Further


If this is the kind of SQL Server stuff you love learning about, you’ll love my training. I’m offering a 75% discount to my blog readers if you click from here. I’m also available for consulting if you just don’t have time for that and need to solve performance problems quickly.