Batching Modification Queries Is Great Until…

Scarecrow


I don’t mean to put anyone off from using batching to make large modifications more efficient.

In this case, more efficient doesn’t necessarily mean faster. You still have this complete unit of work to get through.

The whole point is to go a little bit easier on your server:

  • Smaller transactions sent to the log file
  • Shorter locking durations
  • Less build up of the version store (optimistic isolation levels, triggers, etc.)

But there are thing that make batching impossible, or downright tricky.

Atom Bomb


Let’s say you need to update 10 million rows, and you’re using batches of 5000 rows.

What happens when one batch throws an error?

If you were running the whole thing as a single query, the whole thing would roll back. Depending on how far along you’ve gotten, that could be pretty painful (especially for you suckers that don’t have Accelerated Database Recovery enabled).

That also kind of sucks… depending on the error, too. Not all of them mean the update violated some database rule you’ve set up via constraints.

But all that aside, there are some circumstances where maybe the entire thing should fail and roll back.

In those cases, you’ll need something that keeps track of the “before” rows.  There are ways to do this within SQL Server that don’t require you to program anything:

  • Change Data Capture
  • Change Tracking
  • Temporal Tables

If you can afford to use those, it might be a pretty “easy” way of tracking changes to your data so that you can roll it back.

But it’s up to you to write code that uses any of those things to find the old values and do the ol’ natty switcheroo.

Batchy Bomb


It is possible to save off all the rows you’ve change to another table, and then reverse the changes.

The table load and setup script is here. To use them, you can do something like this.

Then you can use Michael’s batching code, with an OUTPUT clause to your “save” table.

/*Batch update with output*/
-- From https://michaeljswart.com/2014/09/take-care-when-scripting-batches/
DECLARE
    @LargestKeyProcessed int = -1,
    @NextBatchMax int,
    @RC int = 1;
 
WHILE (@RC > 0)
BEGIN
    /*Starting place*/
    SELECT
        @NextBatchMax  = 
            MAX(x.id)
    FROM
    (
        SELECT TOP (1000) 
            aia.id
        FROM dbo.as_i_am AS aia
        WHERE aia.id >= @LargestKeyProcessed
        ORDER BY 
            aia.id ASC
    ) AS x;
    
    /*Updateroo*/
    UPDATE
        aia
        SET aia.some_date = 
                DATEADD(YEAR, 1, aia.some_date),
            aia.some_string = 
                aia.some_string + LEFT(aia.some_string, 1)
        OUTPUT 
            Deleted.id, Deleted.some_date, Deleted.some_string
        INTO
            dbo.as_i_was (id, some_date, some_string)
    FROM dbo.as_i_am AS aia
    WHERE aia.id >= @LargestKeyProcessed
    AND   aia.id <= @NextBatchMax;
    
    /*Enhance*/
    SET @RC = @@ROWCOUNT;
    SET @LargestKeyProcessed = @NextBatchMax;
END;

The only thing I’m doing different here, aside from my own tables, is using OUTPUT to dump the prior row versions into a new table.

That way, if a batch fails, I can roll things back.

Witch Errors


One thing that you should figure out is which errors you want to guard against. Lock and deadlock errors are common ones.

You can do something like this:

DECLARE
    @do_over tinyint = 0,
    @game_over tinyint = 5;
WHILE
    @do_over <= @game_over
BEGIN
    BEGIN TRY        
        SET NOCOUNT, XACT_ABORT ON;        
        UPDATE dbo.as_i_am SET some_string = REPLICATE('ack', 1) WHERE id = 138; /*do a thing*/          
        BREAK; /*exit loop if thing is successful*/       
    END TRY 
    BEGIN CATCH      
          IF ERROR_NUMBER() IN (1204, 1205, 1222) /*lock and deadlock errors*/
          BEGIN             
              SELECT
                  @do_over += 1;              
              WAITFOR DELAY '00:00:10';            
          END; 
          ELSE              
          BEGIN;
              /*log some details to a table here*/
              THROW;           
          END;    
    END CATCH;
END;

This is somewhat incomplete pseudo code, but it looks good enough to blog. Don’t judge me too harshly, just use it to get where you need to go.

Other errors, like primary key, foreign key, constraint, string truncation, and others that indicate data quality issues shouldn’t be retried.

Thanks for reading!

Going Further


If this is the kind of SQL Server stuff you love learning about, you’ll love my training. I’m offering a 75% discount to my blog readers if you click from here. I’m also available for consulting if you just don’t have time for that, and need to solve database performance problems quickly. You can also get a quick, low cost health check with no phone time required.

There’s Still Time To Catch My PASS Precon: The Professional Performance Tuning Blueprint

Workin’


If the Gods of post scheduling cooperate, this should publish on October 3rd. That means you’ve got a little more than a month to buy tickets and book travel to PASS.

And of course, if you’re going to go, I’d love it you came to my precon: The Professional Performance Tuning Blueprint.

Searching the internet for every problem isn’t cutting it.

You need to be more proactive and efficient when it comes to finding and solving database performance fires. I work with consulting customers around the world to put out SQL Server performance fires.

In this day of learning, I will teach you how to find and fix your worst SQL Server problems using the same modern tools and techniques which I use every week.

You’ll learn tons of new and effective approaches to common performance problems, how to figure out what’s going on in your query plans, and how indexes really work to make your queries faster.

Together, we’ll tackle query rewrites, batch mode, how to design indexes, and how to gather all the information you need to analyze performance.

This day of learning will teach you cutting edge techniques which you can’t find in training by folks who don’t spend time in the real world tuning performance.

Performance tuning mysteries can easily leave you stumbling through your work week, unsure if you’re focusing on the right things.

You’ll walk out of this class confident in your abilities to fix performance issues once and for all.

If you want to put out SQL Server performance fires, this is the precon you need to attend. Anyone can have a plan, it takes a professional to have a blueprint.

All attendees will get free access to my performance tuning training library, which also covers the material covered in the precon.

In-person attendees will also get a cool t-shirt. Arguably the coolest t-shirt ever made for a SQL Server conference.

SQL Server MAXDOP shirt
big eight

Dates And Times


The PASS Data Community Summit is taking place in Seattle November 15-18, 2022 and online.

You can register here, to attend online or in-person. I’ll be there in all my fleshy goodness, and I hope to see you there too!

Thanks for reading!

Going Further


If this is the kind of SQL Server stuff you love learning about, you’ll love my training. I’m offering a 75% discount to my blog readers if you click from here. I’m also available for consulting if you just don’t have time for that, and need to solve database performance problems quickly. You can also get a quick, low cost health check with no phone time required.

What To Do When Your Query Runs For Too Long To Get An Actual Execution Plan

Willfully


While I do enjoy answering questions about SQL Server performance, it can be frustrating trying to get the right set of information.

One thing that comes up pretty often when you ask for an actual execution plan, is that the query “never finishes” and one can’t be captured.

Good news! There are ways for you to get execution plans in progress with some of the actual query plan elements inside.

You don’t have to let the query run to completion, but generally if you give it a few minutes you can capture where things are going wrong.

Longer is usually better, but I understand that some queries are real crushers, and cause big server problems.

Option None: Live Query Plans


The problem with Live Query Plans is that they’re really unreliable. Many times I’ve tried to use them and the Live Plan never shows up, and worse I’ll be unable to close the SSMS tab without killing the process in Task Manager.

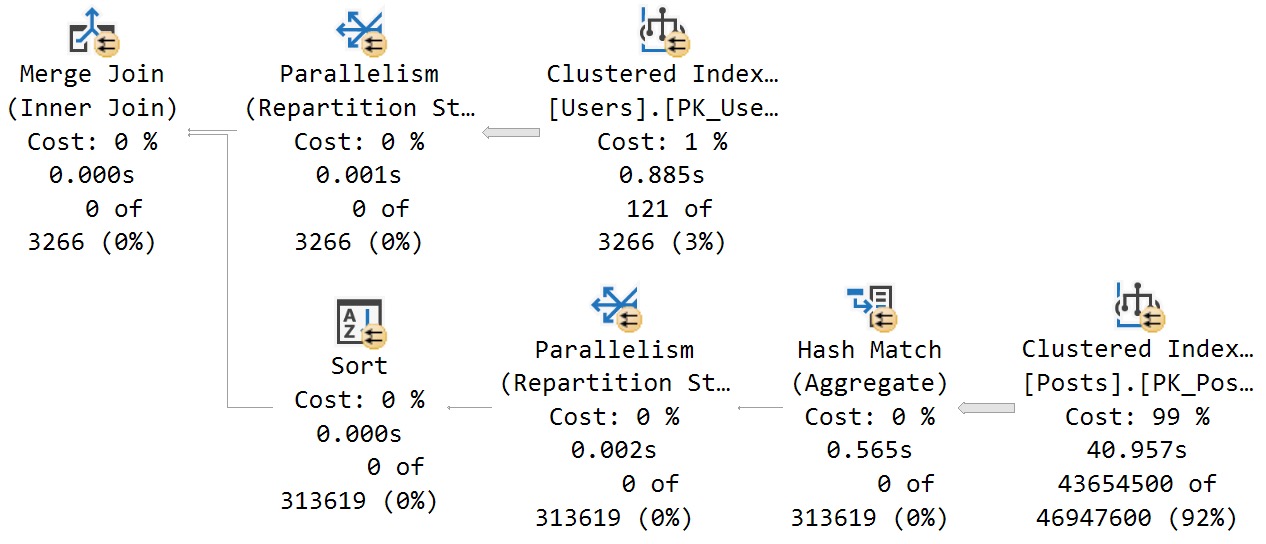
When it does work, it can be sort of confusing. Here’s a completed query with Live Plans enabled:

SQL Server Query Plans
nope.

It took about 49 seconds, but… What took 49 seconds? Repartition Streams? Clustered Index Scan? Something else?

Here’s another really confusing one:

SQL Server Query Plan
means of deduction

Apparently everything took three minutes and thirty six seconds.

Good to know.

Screw these things.

Option One: Get Plans + sp_WhoIsActive


Good ol’ sp_WhoIsActive will check to see if you have the right bits and views in your SQL Server, and return in-progress actual plans to you.

To do that, it looks at dm_exec_query_statistics_xml. That’s SQL Server 2016 and up, for those of you playing along at home. Hopefully you have it installed at home, because you sure don’t at work.

But anyway, if you enable either Actual Execution plans, OR Live Query Plans, and then run sp_WhoIsActive in another window, you’ll get much more sensible plans back. Usually.

SQL Server Query Plan
udderly

This accurately shows where time is spent in the query, which is largely in the scan of the Posts table.

Where There’s Still A Prioblem


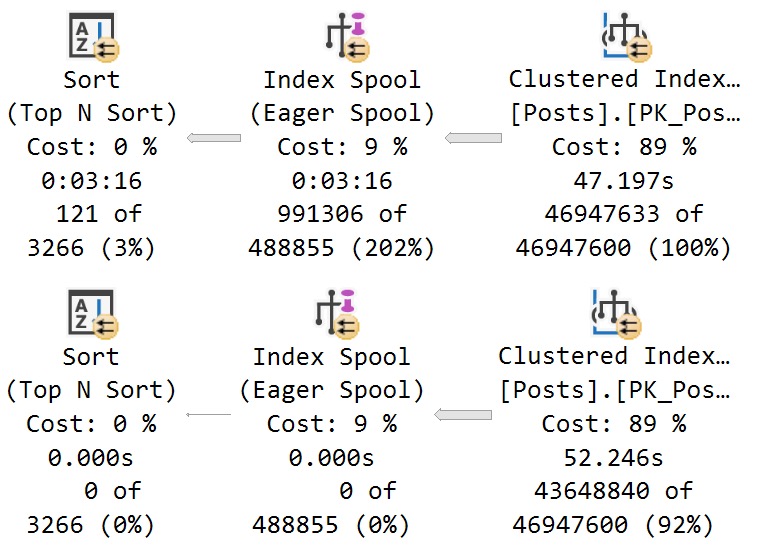
Where things fall apart is still when a spool is built. If you can follow along a bit…

SQL Server Query Plan
not even almost
  • The top query plan shows time accurately distributed amongst operators, from the Actual Plan run to completion
  • The bottom query plan shows time quite inaccurately, getting the plan from dm_exec_query_statistics_xml after the query had been running for three minutes

I guess the bottom line is if you see an Eager Index Spool in your query plan, you should fix that before asking any questions.

Thanks for reading!

Going Further


If this is the kind of SQL Server stuff you love learning about, you’ll love my training. I’m offering a 75% discount to my blog readers if you click from here. I’m also available for consulting if you just don’t have time for that, and need to solve database performance problems quickly. You can also get a quick, low cost health check with no phone time required.
SQL Server Management Studio Should Add Filters When You Get Execution Plans

Have You Heard The One…


Whenever I’m tuning a long stored procedure, I use sp_HumanEvents to grab query plans and other details about what’s going on.

The thing is… It should be a lot easier than that. Unfortunately, when you tell SSMS that you want to get actual execution plans, it gives you absolutely everything.

For code that loops or has a lot of tiny queries that run leading up to more painful queries. All that is a slog, and can result in SSMS becoming unresponsive or crashing.

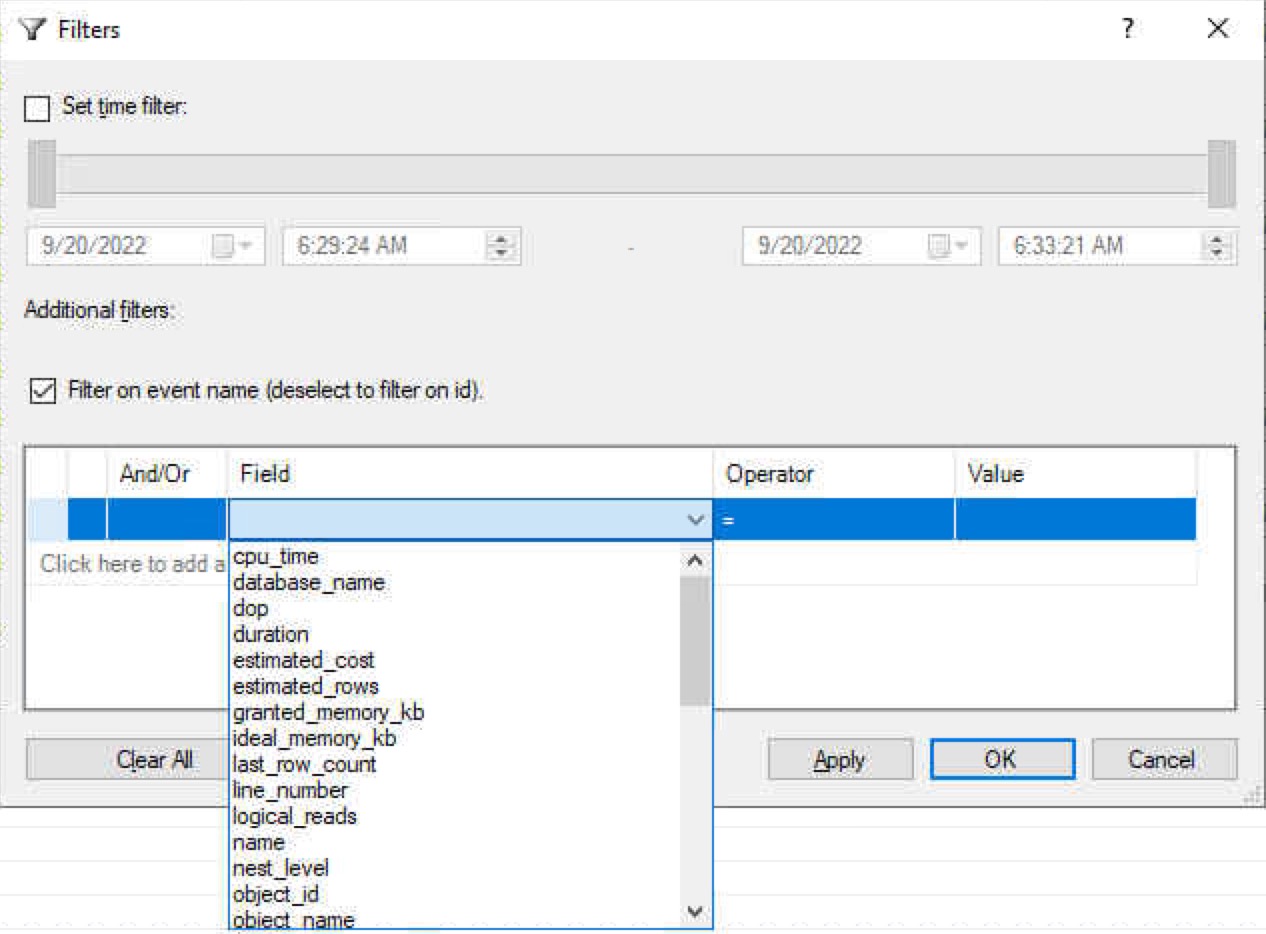
It’s be really cool if hitting the Actual Execution Plan button filter out some stuff so you’re not collecting everything.

It could even use the same GUI style as Extended Events.

SQL Server Extended Events
in england

Granted, not all the ones pictured here would make sense, but metrics like CPU and duration would be helpful to keep noisy query plans out of the picture.

Thanks for reading!

Going Further


If this is the kind of SQL Server stuff you love learning about, you’ll love my training. I’m offering a 75% discount to my blog readers if you click from here. I’m also available for consulting if you just don’t have time for that, and need to solve database performance problems quickly. You can also get a quick, low cost health check with no phone time required.
What’s The Difference Between Read Committed And Read Committed Snapshot Isolation In SQL Server?

Losing Out


I spend a lot of time talking about this with clients, because so many of them face dire blocking and deadlocking issues across a variety of queries under the Read Committed isolation level, that can be easily solved by switching to Read Committed Snapshot Isolation.

There seems to be quite a bit of misconception about isolation levels, particularly optimistic ones in SQL Server. In the most unfortunate of circumstances, optimistic isolation levels are bundled in with Read Uncommitted/NOLOCK as being able to read dirty data.

To make the differences clear, here’s how things shake out across a few of SQL Server’s isolation levels I see most commonly.

Note that I’m not including Repeatable Read, Serializable, or Snapshot Isolation. I’ll talk about why as we go through things a bit here.

While it is tempting to use the Read Uncommitted isolation level to avoid some common blocking and deadlocking scenarios, that isolation level comes with a steep price: your queries are subject to every kind of dirty read imaginable.

By the time you realize that your queries have produced bad data, it’s far too late.

SQL Server Isolation Levels
read dirty to me

That brings us to Read Committed, which is the default isolation level in SQL Server, except in Azure SQL DB. In that cloud version of SQL Server, Read Committed Snapshot Isolation is the default isolation level.

Read Committed seems like a decent compromise between not returning awful, incorrect data, until you realize that your read queries can block, be blocked by, and deadlock with modification queries. This will typically happen in queries that take object level shared locks, which queries using Read Uncommitted/NOLOCK will not do. Nor will queries operating under an optimistic isolation level, like Read Committed Snapshot Isolation, or Snapshot Isolation.

I cover both of those scenarios in these posts:

Read Committed Snapshot Isolation is typically the better of the three options, especially if you prefer correct data being returned to clients.

The final point I’ll make in this section is that writer on writer blocking and deadlocking can occur in every isolation level, even many cases under Snapshot Isolation.

You May Notice


Since I’ve hopefully scared you out of using Read Uncommitted/NOLOCK for your queries, let’s talk about the remaining competitors.

Read Committed and Read Committed Snapshot Isolation have similar traits as to what level of data integrity they guarantee.

The tradeoff comes with a change to the behavior of read queries in the face of data modifications. While readers won’t block or deadlock with modification queries under Read Committed Snapshot Isolation, it’s important to understand how they avoid that while still returning data with some guarantees of correctness.

There’s No Such Thing As A Free Feature©, as they say.

Since I promised to talk about why I’m not talking about certain isolation levels in this post, let’s do that before we look at Read Committed and Read Committed Snapshot isolation level differences.

  • Snapshot Isolation: Even though this is my favorite isolation level, it’s usually too hard to apply. Queries have to ask for it specifically. Most of the time, you want every query to benefit with minimal changes.
  • Repeatable Read: Is sort of like a weaker version of Serializable. I often struggle to explain why it even exists. It’s like all of the blocking with fewer of the guarantees.
  • Serializable: I very rarely run into scenarios where this is the ideal isolation level. Many times, I find developers using it without knowing via their ORM of choice.

There you. have it. I’m not saying you should never use any of these. They exist for good academic reasons, but practical applications are slim, particularly for Repeatable Read and Serializable.

Let’s create a simple table to muck about with:

CREATE TABLE 
    dbo.isolation_level
(
    id int NOT NULL PRIMARY KEY IDENTITY, 
    isolation_level varchar(40)
);

INSERT 
    dbo.isolation_level
(
    isolation_level
)
VALUES
    ('Read Committed'),
    ('Read Committed Snapshot Isolation');

I’m also going to set my database to use Read Committed Snapshot Isolation, but request Read Committed when the select query runs.

ALTER DATABASE 
    Crap 
SET 
    READ_COMMITTED_SNAPSHOT ON 
WITH 
    ROLLBACK IMMEDIATE;

Read Committed


Very few people use this isolation level fully in practice. I know you. I see you in the naked light of day.

Your database is set to use this isolation level, but your queries all ask for Read Uncommitted/NOLOCK. Which means… You made bad choices.

Not as bad as the choice Microsoft made in picking Read Committed as the default isolation level, but there we have it. Time to own it.

We’re going to use an equally simple couple queries to demonstrate the differences.

--window one
BEGIN TRAN;
    UPDATE il
        SET il.isolation_level = 'Read Committed'
    FROM dbo.isolation_level AS il
    WHERE il.id = 2;
ROLLBACK;

And then:

--window two
SELECT
    c = COUNT_BIG(*)
FROM dbo.isolation_level AS il WITH(READCOMMITTEDLOCK)
WHERE il.isolation_level = 'Read Committed';

While the update is running, our select will get blocked.

SQL Server blocking
read committed blah

There go those shared locks, causing problems.

But when the update is finally committed, our query will count 2 rows matching our search on the isolation level column.

If that’s what you absolutely need, then you should use Read Committed, or another more strict isolation level, like Repeatable Read or Serializable.

For most people, if you’re okay with NOLOCK, you’re better off with Read Committed Snapshot Isolation.

Read Committed Snapshot Isolation


If we remove the READCOMMITTEDLOCK hint from the select query and allow it to use versioned rows via Read Committed Snapshot Isolation set at the database level, something different happens.

There’s no blocking to show you. The select finishes instantly. There’s not really a good screenshot of that.

SQL Server takes the version of the row that it knew was good when the update started — the one with Read Committed Snapshot Isolation as the value — and sends that version of the row to the version store.

Again, it is a known, good, committed value for that row. No dirty read nonsense here.

But that means the query returns a result of 1, since only one row qualifies for the where clause filter when we go looking for stuff in the version store.

If you have queries that should rely on reading only committed data from completed modification queries, you can hint them with READCOMMITTEDLOCK to maintain such behavior.

In the same sense, you could use the SNAPSHOT isolation level and only hint certain queries to use it, either by using SET TRANSACTION ISOLATION LEVEL, or adjusting your query’s connection strings to request it.

But that’s a lot harder! You have to go around potentially changing a lot of code to ask for it, or separating queries that you want to use a different isolation level into a different connection string group. I realize that at this point, some of you may be confused here by Microsoft’s awkward naming choices. Snapshot Isolation, and Read Committed Snapshot Isolation, are indeed two different optimistic options for isolation levels.

They are not entirely interchangeable, though either one is generally a better choice than the default isolation level, Read Committed.

Even with the overhead of generating row versions, I’ll take correct results quickly.

Thanks for reading (optimistically)!

Going Further


If this is the kind of SQL Server stuff you love learning about, you’ll love my training. I’m offering a 75% discount to my blog readers if you click from here. I’m also available for consulting if you just don’t have time for that, and need to solve database performance problems quickly. You can also get a quick, low cost health check with no phone time required.
SQL Server Community Tools: The Wrap Up And Combined Link

I am a heading


Over the past month (plus or minus a couple days), I’ve shown you in a series of quick posts how I use different SQL Server Community Tools that are free and open source to troubleshoot SQL Server issues.

Here’s the full list of posts.

Thanks for reading!

Going Further


If this is the kind of SQL Server stuff you love learning about, you’ll love my training. I’m offering a 75% discount to my blog readers if you click from here. I’m also available for consulting if you just don’t have time for that, and need to solve database performance problems quickly. You can also get a quick, low cost health check with no phone time required.

SQL Server Community Tools: How I Use sp_BlitzLock

Groovy Baby


I wrote sp_BlitzLock while drinking (okay, drunk) on a plane from Chicago to Seattle with Brent. We were headed to PASS in 2017 to teach a precon that I had to pay $500 to get into.

This might be my favorite procedure to talk about, even though the contents are almost my least favorite to analyze.

It calls out two kinds of deadlocks:

  • Regular deadlocks from queries fighting
  • Parallel deadlocks from parallelism being insane

For regular deadlocks, much of the time I end up talking about how many of the queries involved are selects, and how enabling RCSI will fix the problem across the board without changing queries or indexes.

God bless RCSI.

For parallel deadlocks, this is when I get to tell folks that their parallelism settings are all amok (or at the defaults, yuck) and that’s why 300 queries fail a day.

Make It Weird


By detfault, sp_BlitzLock will look at the system health extended event session. Most everyone in the SQL Server running world has that available, logging deadlocks.

Why doesn’t it also log blocking? Great question, if you want to end up in an orange jumpsuit with your head in a sack.

But it can also parse and analyze any extended event session that’s capturing deadlocks.

EXEC sp_BlitzLock; --goes to system health

EXEC sp_BlitzLock --goes to another session
    @EventSessionPath = 'P:\PutSomethingHere*.xel';

There are many things I’d like the extended event XML to do better:

  • Sometimes the queries it shows being involved aren’t the ones that deadlocked
  • Sometimes it will show you the database id and object id of a procedure instead of resolving them to give you a readable name
  • Sometimes it will cut off query text so it’s even harder to figure out what went wrong

A big thing missing is the query plan, too. Most of the time this will illustrate quite nicely what the deadlock cause was:

  • Lookups
  • Foreign keys
  • Triggers
  • Missing indexes

But this is still the best way I’ve been able to come up with to deal with something as dull as deadlocks.

Dutifully.

Thanks for reading!

Going Further


If this is the kind of SQL Server stuff you love learning about, you’ll love my training. I’m offering a 75% discount to my blog readers if you click from here. I’m also available for consulting if you just don’t have time for that, and need to solve database performance problems quickly. You can also get a quick, low cost health check with no phone time required.

SQL Server Community Tools: How I Use sp_BlitzCache

Planning To Fail


Back when the plan cache was the only thing you could look at to find slow queries, sp_BlitzCache was a goldmine.

I spent hundreds of hours writing checks for new and different things, adding features, and beating my head against XML queries.

Aside from some of the Blitz procedures that I wrote originally from scratch (BlitzWho, BlitzLock, BlitzQueryStore) I probably spent the most time with sp_BlitzCache.

I don’t say that to take credit away from anyone else who contributed to the procedures — I’m thankful to anyone willing to work on my terrible code — but birthing those procedures was a hell of a process.

And a nerve-racking one. I know how many people use and depend on these procedures.

Getting things right the first time is no easy task.

These days, I spend way more time looking at Query Store data, because half the time I go looking at the plan cache it’s hardly more than a few hours old.

Big Train


The main patterns I dig into when I look at the plan cache are:

  • average CPU
  • unused memory grant
  • frequent executions
EXEC sp_BlitzCache
    @SortOrder = 'avg cpu';

EXEC sp_BlitzCache
    @SortOrder = 'unused memory grant';

EXEC sp_BlitzCache
    @SortOrder = 'xpm';

Assuming that you find things in here that are pertinent to the workload as a whole, and that you can tune in a meaningful way, you’ll get a wealth of great details about what lurks in the query plan XML.

Seriously. You almost don’t even have to look at the plan sometimes because of what gets called out in the warnings for sp_BlitzCache.

There’s an amazing amount of stuff that it will yell at you about.

Thanks for reading!

Going Further


If this is the kind of SQL Server stuff you love learning about, you’ll love my training. I’m offering a 75% discount to my blog readers if you click from here. I’m also available for consulting if you just don’t have time for that, and need to solve database performance problems quickly. You can also get a quick, low cost health check with no phone time required.

SQL Server Community Tools: How I Use sp_BlitzIndex

Those Days


There are a lot of things I skip over when I look at sp_BlitzIndex. Not because they’re unhelpful, but because they need a lot of context.

Diagnosing index issues is tough, because server uptime, workload variability, and optimizer sleight of hand make things more difficult than they should be.

For example, say you have a unique nonclustered index on one column that has zero reads — it’s not helping queries go any faster — has  millions of writes, but can you drop it? Is the optimizer using the statistics attached to it to make better guesses?

It’s really hard to know. So you keep this index around because you don’t want to make things worse.

SQL Server tells you a lot about indexes, and almost nothing about statistics.

They’re Gone


Most of what I want to do with sp_BlitzIndex is figure out:

  • Which indexes I can safely clean up
  • Which tables might need clustered indexes
  • Which tables have scalar UDFs in computed columns or check constraints
  • Which missing index requests I can correlate to long running queries

To do that, you can run either of these commands:

EXEC dbo.sp_BlitzIndex
    @DatabaseName = N'StackOverflow2013',
    @Mode = 0; --Lighter detail

EXEC dbo.sp_BlitzIndex
    @DatabaseName = N'StackOverflow2013',
    @Mode = 4; --Heavier detail

Depending on how much detail you want to get into, you might want to use either one. Usually, Mode zero gives you enough to get boogying on.

Sad Face


To get the stuff I want out of sp_BlitzIndex, I need to do some additional validation.

Let’s say for instance I have:

  • 50 unused indexes
  • 20 duplicate indexes
  • 150 borderline duplicate indexes

I might drop the 50 unused indexes — assuming the server has been up for long enough for me to make that call with confidence — and that might also get rid of a bunch of duplicate and borderline duplicate indexes, too.

The same thing goes for duplicate indexes: most of the time everyone is just trying to solve today’s performance problem by adding an index. Not many people are looking back at all the other indexes that aren’t so useful anymore.

If you drop and/or merge a bunch of duplicate indexes, you’re very likely going to take a chunk out of the borderline duplicate indexes, too.

Iterative


Index tuning is a very iterative process. There are entire chunks of data in sp_BlitzIndex that I won’t touch until I’ve taken care of other things.

This is somewhat dependent on the number of indexes that get flagged in each section, but in general I don’t want to spend a bunch of time working through hundreds of indexes that are going to disappear when I get through an earlier chunk of changes.

That’s why I always stress that you’re not just gonna be able to call fixing indexes a one-and-done procedure. You need to work your way through and plan changes in chunks.

Some tables are likely going to get prioritized in the process based on how important they are to the workload, too.

Of course, you can zoom in to a single table with sp_BlitzIndex to do really focused analysis, but a lot of the time there’s just so much darn blood everywhere that you need to save this step for last.

So what I usually do is:

  • Get rid of totally unused indexes
  • Come back and see what duplicate indexes are left
  • Merge those together
  • Come back and see what borderline duplicate indexes are left
  • Merge those together
  • Come back and see if there are any indexes with a really bad write to read ratio
  • Decide which of those are safe to drop

I almost never wanna try to script all those changes in one go, because you’re really likely going to end up double and triple working indexes.

Milk Carton


One section in particular that I used to pay a lot of attention to is missing indexes, but I don’t do that any more.

Why, you might ask?

They’re based on sort of weird things:

  • Average query cost
  • Assumed reduction in query cost
  • Number of executions

I’ve blogged about what missing index requests really mean in SQL Server before, but:

  • Missing index request impact is based on the assumed cost reduction of a single operator
  • That operator’s cost is based on totally ancient assumptions about CPU and I/O hardware characteristics

The number of executions is a pretty stable metric, but if the query attached to the request is already running quickly enough, why bother?

Nowadays when I skip over the missing index request stuff until I find a query asking for one, figure out how important it is, and then figure out if the index will change the query in a meaningful way.

There’s almost no good reason to go and add every (or even any) missing index request based solely on what’s in these views, especially if you have a bunch of indexes you really need to clean up first.

Thanks for reading!

Going Further


If this is the kind of SQL Server stuff you love learning about, you’ll love my training. I’m offering a 75% discount to my blog readers if you click from here. I’m also available for consulting if you just don’t have time for that, and need to solve database performance problems quickly. You can also get a quick, low cost health check with no phone time required.

SQL Server Community Tools: How I Use sp_BlitzFirst

1 of 3


This post is a pretty easy one, because there aren’t a ton of secret ways to run sp_BlitzFirst.

The big value for this one is you can either:

  • Run it to get everything since the server was last restarted (or some noodlehead cleared things out)
  • Run it to sample a period of time to see what happens cumulatively during a workload

Sure, there are times when getting everything since startup is enough, but if the server has been up for hundreds or thousands of hours then it’s way less valuable:

  • Some really bad stuff might have been generated a long time ago and are irrelevant now
  • Some really bad stuff just started happening and might look insignificant compared to uptime

Why do servers end up not getting patched or restarted for that long? Let me count the ways!

  • Admins not patching because ???
  • Admins not patching because they’re scared of the CU servicing model (I don’t blame them, here)
  • Admins not patching because “everything is fine”
  • Admins not patching because they are lazy and bad at their job

I could go on, but I respect horses too much.

2 of 3


To see what a server has been up to since last reboot (or some noodlehead cleared things out), all you have to do is this:

EXEC sp_BlitzFirst
    @SinceStartup = 1;

This runs quickly, and hands you back a few different things:

  • Wait stats
  • File stats
  • Perfmon counters

I’m pretty guilty of only looking at wait stats here, and only giving the other stuff a cursory glance.

For file stats, I look for really high read or write latency, and for perfmon counters I tend to look at batch requests, compilations, and recompiles.

Beyond that, anything else I might care about is stuff I’m going to dig into with other tools that pull out more detail.

I’m not complaining — I could write in more detailed checks here — they just wouldn’t make sense at this level of analysis.

3 of 3


The other way I generally run sp_BlitzFirst is to look at what’s currently happening on a server.

Like I said, the longer a server is up the more things get blurred and blended into crazy numbers.

Running the procedure like this does require an extra parameter:

EXEC sp_BlitzFirst
    @Seconds = 10,
    @ExpertMode = 1;

There are three great things about this:

  • You can make a joke about how the extra parameter makes you a SQL Server expert
  • The longer you run it for, the more time you have to look at email and twitter without it looking like you’re not paying attention
  • It returns a nice section of warnings from any blaring issues that get detected during the sample

You get back all the same stuff as @SinceStartup, too, but only for the window you look at things in.

That can be super helpful for isolating current problems.

Thanks for reading!

Going Further


If this is the kind of SQL Server stuff you love learning about, you’ll love my training. I’m offering a 75% discount to my blog readers if you click from here. I’m also available for consulting if you just don’t have time for that, and need to solve database performance problems quickly. You can also get a quick, low cost health check with no phone time required.