So Many Choices
SQL Server is full of landmines options when you’re writing queries. For most queries, you don’t need much beyond the basics.
Think of your standard CRUD operations. Most don’t even require a join; they’re very straightforward. And hey, if you completely denormalize all your data to one huge table, you’ll never have to think about a lot of this stuff anyway.
It’s only when developers are forced to think about things that things start to go wrong. I don’t mean to pick on developers specifically. It’s the human condition. Thinking often leads to poor choices.
In this post, I’m going to give you some basic guidance on when to use various T-SQL facilities, based on years of finding, fixing, and writing queries.
Some of the details and information may not surprise the more seasoned and spiced of you out there.
Here’s a piece of advice that I give everyone: Always start with a SELECT. I don’t care if the final form of your query is going to be an insert, update, or delete (I do care if it’s going to be a merge, because ew), you should always start off by writing a select, so you can validate query results first. It’s easy enough to change things over when you’re done, but please make sure what you’re changing is what you expect to change. I’d even go one step further and say that the first time you run your modification query, you should do it in a transaction with a ROLLBACK command.
I’ll usually do some variation on this, so I can see inserted and deleted results easily:
BEGIN TRANSACTION
    UPDATE TOP (100)
        u
    SET u.Reputation += 1000
    OUTPUT
        'D' AS d, Deleted.*,
        'I' AS i, Inserted.*
    FROM dbo.Users AS u
    WHERE u.Reputation < 1000
    AND   u.Reputation > 1;
ROLLBACK TRANSACTION;
Anyway, on to the cheat codes.
Inner Joins
Joins combine data horizontally (sideways, for the forgetful). The most basic thing you can do with two tables in a database, really.
The important thing to remember is that in one-to-many, and many-to-many relationships, joins will display duplicate matched values.
If you don’t need to show data from another table, don’t use a join. We’ll talk about other options later, but please let this burn into your mind. The number of queries I’ve seen with needless DISTINCT instructions on them is nearing a decent pre-tax cash bonus.
Here’s an example of when a join is necessary. We want to get all of our Users with a Reputation over 500,000, and sum up the Score on all their Posts, plus figure out what kind of Post the points were awarded to.
SELECT
    u.Id,
    u.DisplayName,
    PostType =
        CASE
             p.PostTypeId
             WHEN 1
             THEN 'Question'
             WHEN 2
             THEN 'Answer'
             ELSE 'Other'
        END,
    TotalScore = SUM(p.Score)
FROM dbo.Users AS u
JOIN dbo.Posts AS p
  ON p.OwnerUserId = u.Id
WHERE u.Reputation > 500000
GROUP BY
    u.Id,
    u.DisplayName,
    p.PostTypeId
ORDER BY
    TotalScore DESC;
Because we need multiple columns from the Posts table, we can’t just use a correlated subquery in the select list. Those only allow for one column or expression to be projected from the results.
Since this is an inner join, it restricts the results down only to matching rows. Now, it’s not really possible to get a Reputation over 1 without posting things that other users can vote on, so it doesn’t make sense to use an outer join here.
What if we wanted to find slightly different data?
(Left) Outer Joins
Let’s say we wanted to generate a report of people whose Reputation is sitting at one (the site minimum), to figure out if they’re inactive, unpopular, or if their account has been suspended for some reason.
We could use a query like this to do it.
SELECT
    u.Id,
    u.DisplayName,
    u.Reputation,
    TotalScore = SUM(p.Score),
    c = COUNT_BIG(p.Id)
FROM dbo.Users AS u
LEFT JOIN dbo.Posts AS p
  ON p.OwnerUserId = u.Id
WHERE u.Reputation = 1
GROUP BY
    u.Id,
    u.DisplayName,
    u.Reputation
ORDER BY
    TotalScore;
Before talking about the logic, it’s important to note that when you’re counting rows from the outer side of a join, you’ll usually wanna specify a non-nullable column to pass into the counting function, rather than (*), so you don’t incorrectly count NULL values.
Primary key columns are your friend for this, but any non-NULLable column will do.
We need a left join here, because we want everyone with a Reputation of 1, not just those users who have posted. The left join preserves rows from the Users table in that case.
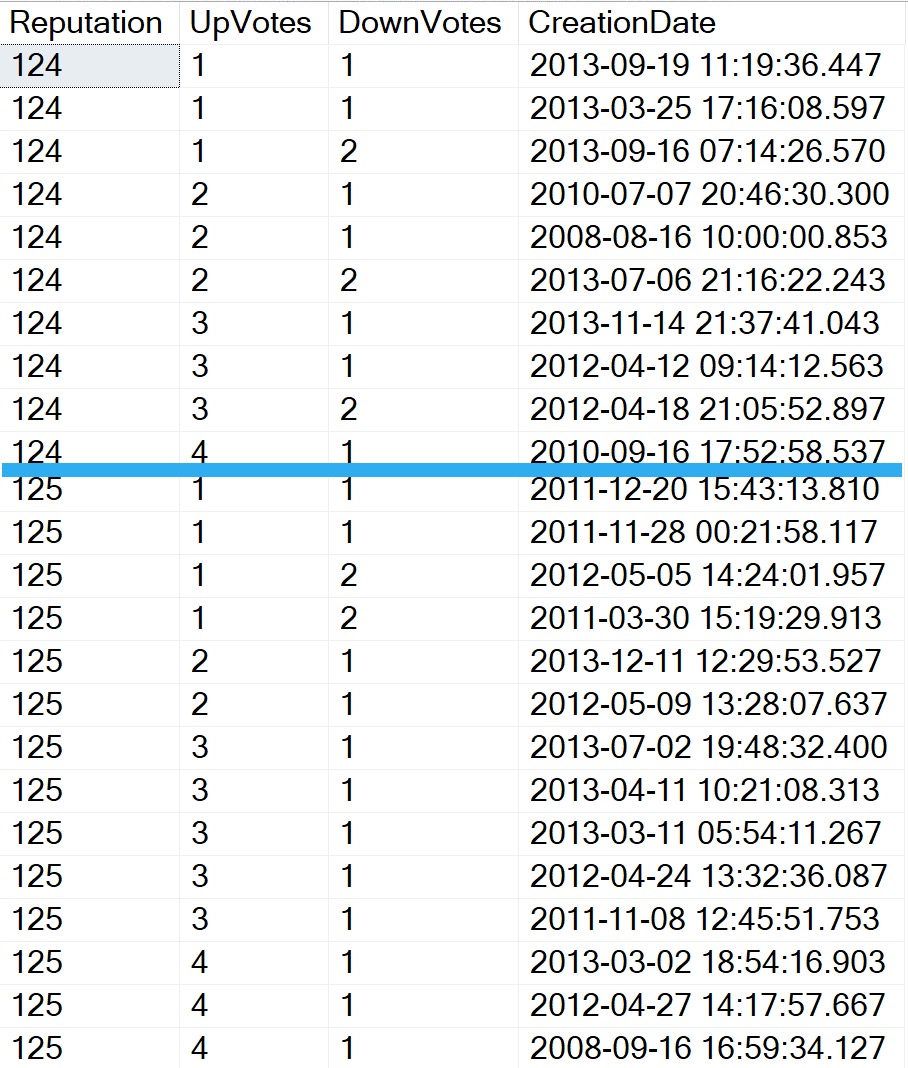
The results we get back find all sorts of interesting things (that I told you we were looking for):
- Users who were very active, but then had their accounts suspended
- Users who have posted, but were heavily downvoted
- Users who haven’t posted at all

I’m not going to talk about right outer joins, because that’s the foolish domain of characterless buffoons who use Venn diagrams to explain join results.
I assume they have good intentions, they just lack the backbone to tell you that there is no natural reason to ever use a right join, that isn’t better logically expressed in a different way.
They’re usually trying to sell you something.
(Full) Outer Joins
In short, these preserve results from both tables, but still with a correlation. I’d nearly put these in the same category as right joins, except they have a couple decent use cases, and aren’t personally offensive to polite society.
Let’s say we want to figure out how many Posts don’t have an associated User, and how many Users don’t have an associated Post all in one query:
SELECT
    PostsWithoutAUser =
        SUM(CASE WHEN u.Id IS NULL THEN 1 ELSE 0 END),
    UsersWithoutAPost =
        SUM(CASE WHEN p.Id IS NULL THEN 1 ELSE 0 END)
FROM dbo.Users AS u
FULL JOIN dbo.Posts AS p
  ON p.OwnerUserId = u.Id;
It’s sort of an exception report, to let you know just how much referential integrity your data lacks.
Aside from oddball situations, you shouldn’t have to think much about these in your day to day life.
Cross Joins
Like full joins, I don’t see cross joins used terribly often, though they do have some uses, like populating a grid.
A reasonably worded example would be something like: you have a table of scotch, and a table of glass sizes, and you want to show someone all possible combinations of scotch and glass sizes.
If you pick a big enough glass, eventually using cross joins in more creative ways will seem like a good idea. One place I’ve been forced to use them is in some of my stored procedures, like sp_PressureDetctor.
Here’s one example:
SELECT
    sample_time =
        CONVERT
        (
            datetime,
            DATEADD
            (
                SECOND,
                (t.timestamp - osi.ms_ticks) / 1000,
                SYSDATETIME()
            )
        ),
    sqlserver_cpu_utilization =
        t.record.value('(Record/SchedulerMonitorEvent/SystemHealth/ProcessUtilization)[1]','int'),
    other_process_cpu_utilization =
        (100 - t.record.value('(Record/SchedulerMonitorEvent/SystemHealth/ProcessUtilization)[1]','int')
         - t.record.value('(Record/SchedulerMonitorEvent/SystemHealth/SystemIdle)[1]','int')),
    total_cpu_utilization =
        (100 - t.record.value('(Record/SchedulerMonitorEvent/SystemHealth/SystemIdle)[1]', 'int'))
FROM sys.dm_os_sys_info AS osi
CROSS JOIN
(
    SELECT
        dorb.timestamp,
        record =
            CONVERT(xml, dorb.record)
    FROM sys.dm_os_ring_buffers AS dorb
    WHERE dorb.ring_buffer_type = N'RING_BUFFER_SCHEDULER_MONITOR'
) AS t
WHERE t.record.exist('(Record/SchedulerMonitorEvent/SystemHealth/ProcessUtilization[.>= sql:variable("@cpu_utilization_threshold")])') = 1
ORDER BY
    sample_time DESC;
The sys.dm_os_sys_info view is a single row, with no relation at all to sys.dm_os_ring_buffers, but I need to use the one value in the one column in the one row for every row that it produces, so that I can turn the timetable column into a human-understandable value.
Here’s another example from the same procedure, slightly abridged:
SELECT
    total_threads =
        MAX(osi.max_workers_count),
    used_threads =
        SUM(dos.active_workers_count),
    available_threads =
        MAX(osi.max_workers_count) - SUM(dos.active_workers_count),
    threads_waiting_for_cpu =
        SUM(dos.runnable_tasks_count),
    requests_waiting_for_threads =
        SUM(dos.work_queue_count),
    current_workers =
        SUM(dos.current_workers_count),
    total_active_request_count =
        SUM(wg.active_request_count),
    total_queued_request_count =
        SUM(wg.queued_request_count),
    total_blocked_task_count =
        SUM(wg.blocked_task_count),
    total_active_parallel_thread_count =
        SUM(wg.active_parallel_thread_count),
    avg_runnable_tasks_count =
        AVG(dos.runnable_tasks_count)
FROM sys.dm_os_schedulers AS dos
CROSS JOIN sys.dm_os_sys_info AS osi
CROSS JOIN
(
    SELECT
        wg.active_request_count,
        wg.queued_request_count,
        wg.blocked_task_count,
        wg.active_parallel_thread_count
    FROM sys.dm_resource_governor_workload_groups AS wg
) AS wg;
In this case, I keep myself safe from exploding result sets by aggregating all of the selected columns. You may also find that necessary, should you choose to work with data so terrible that it requires cross joins.
One thing to be especially aware of is that cross joins can only be physically implemented in SQL Server with a nested loops join, so the larger your tables get, the worse performance will get.
Beware out there.
Thanks for reading!
Going Further
If this is the kind of SQL Server stuff you love learning about, you’ll love my training. I’m offering a 75% discount to my blog readers if you click from here. I’m also available for consulting if you just don’t have time for that, and need to solve database performance problems quickly. You can also get a quick, low cost health check with no phone time required.
