Parallel rowstore scans are parallel “aware”. This makes them unlike most other operators which work independently on different threads. Columnstore indexes store data in a dramatically different way than rowstore objects, so perhaps we can expect differences in how rows are distributed among threads during a parallel scan. This blog post explores some of the observable behavior around row distribution for parallel columnstore scans.
Methods of Rowstore Scan Parallel Row Distribution
This will be an extremely brief summary of how SQL Server distributes rows among threads for rowstore parallel scans. A parallel page supplier sends pages to each thread on a demand basis. Threads may end up processing different numbers of pages for many reasons. If you like, you can read more about this here and here. In addition, there is some fancy behavior for partitioned tables. The documentation describes this behavior in SQL Server 2008 and it may have changed since then, but this is sufficient to set the stage. The important part is that SQL Server will in some cases give each relevant partition its own thread. In other cases, SQL Server will assign multiple threads to a single partition.
Methods of Columnstore Scan Parallel Row Distribution
I investigated tables with only compressed rowgroups. I did not consider delta stores because real CCIs don’t have delta stores. As far as I can tell, there are at least three different methods that SQL Server can use to assign rows to threads during a parallel CCI scan.
Rowgroup Parallelism
One method of distributing rows is to assign each thread to a relevant rowgroup. Two or more threads will not read rows from the same rowgroup. This strategy can be used if the cardinality estimate from the scan is sufficiently high compared to the DOP used by the query. Rowgroup level parallelism will be used if:
Cardinality Estimate >= MAXDOP * 1048576 * 0.5
To show this, let’s build a CCI with a single column integer that runs from 1 to 1048576 * 10. Naturally, the table will have ten compressed rowgroups of the maximum size:
CREATE TABLE dbo.CCI_SHOW_RG_PARALLELISM (
	ID BIGINT NOT NULL,
	INDEX CCI CLUSTERED COLUMNSTORE
);

INSERT INTO dbo.CCI_SHOW_RG_PARALLELISM WITH (TABLOCK)
SELECT TOP (1048576 * 10) ROW_NUMBER()
	OVER (ORDER BY (SELECT NULL))
FROM master..spt_values t1
CROSS JOIN master..spt_values t2
CROSS JOIN master..spt_values t3
OPTION (MAXDOP 1);
I ran my tests with a simple query that is likely to go parallel on my machine and that doesn’t qualify for aggregate pushdown. With a cardinality estimate of exactly 1000000 and MAXDOP of 2 all of the rows are sent to one thread:
SELECT MAX(SQRT(ID))
FROM dbo.CCI_SHOW_RG_PARALLELISM
WHERE ID <= 1000000
OPTION (MAXDOP 2);
From the actual plan:

If we reduce the cardinality estimate by one row, the rows are spread out more evenly on the two threads:
SELECT MAX(SQRT(ID))
FROM dbo.CCI_SHOW_RG_PARALLELISM
WHERE ID <= 999999
OPTION (MAXDOP 2);
From the actual plan:

Note that the cardinality estimate displayed in SSMS may be misleading. The first query has a displayed cardinality estimate of 2000000 rows, but it does not use rowgroup parallelism:
SELECT MAX(SQRT(ID))
FROM dbo.CCI_SHOW_RG_PARALLELISM
WHERE ID <= 1999999 -- query plans can round
OPTION (MAXDOP 4);
From the actual plan:
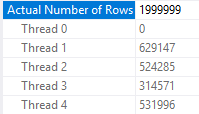
But this one does:
SELECT MAX(SQRT(ID))
FROM dbo.CCI_SHOW_RG_PARALLELISM
WHERE ID <= 2000000
OPTION (MAXDOP 4);
From the actual plan:
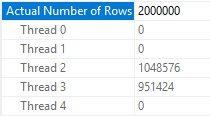
Of course, we can get the query that takes an aggregate of 1999999 rows to use rowgroup level parallelism by bumping up the estimate:
DECLARE @filter BIGINT = 1999999;

SELECT MAX(SQRT(ID))
FROM dbo.CCI_SHOW_RG_PARALLELISM
WHERE ID <= @filter
OPTION (MAXDOP 4);
Here the estimate is:
0.3 * 10485800 = 3145740.0
So we get the expected parallelism strategy:
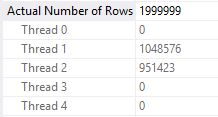
We can show that the rowgroup parallelism strategy is demand-based by deliberately slowing down the required the thread that grabs the first rowgroup in the table. Here I’m defining first by the ID that’s returned when running a SELECT TOP 1 ID query against the table. On my machine I get an ID of 9437185. The following code will add significant processing time in the CROSS APPLY part for only the row with an ID of 9437185. Every other row simply does a Constant Scan and goes on its merry way:
SELECT COUNT(*)
FROM dbo.CCI_SHOW_RG_PARALLELISM o
CROSS APPLY (
	SELECT TOP 1 1 c
	FROM
	(
		SELECT 1 c
		WHERE o.ID <> 9437185

		UNION ALL

		SELECT 1 c
		FROM master..spt_values t1
		CROSS JOIN master..spt_values t2
		CROSS JOIN master..spt_values t3
		WHERE o.ID = 9437185
		ORDER BY (SELECT NULL)
			OFFSET 100000000 ROWS
			FETCH FIRST 1 ROW ONLY
	) t
) t2
OPTION (MAXDOP 2);
Thread 1 processes nine rowgroups and waits on thread 2 to process its single rowgroup:

Split Rowgroup Parallelism
If the CCI has a small number of rows and the cardinality estimate is low enough you may see a different parallel row distribution strategy employed. I couldn’t think of a good name for this, but SQL Server splits up each rowgroup into roughly equal pieces and threads can process those pieces on a demand basis. The number of pieces seems to depend on the number of rows in the rowgroup instead of MAXDOP . For MAXDOP larger than 2 this behavior can be observed if a table has one or two rowgroups. For a MAXDOP of 2 this behavior can be observed if a table has exactly one rowgroup.
The formula for the number of pieces appears to be the number of rows in the rowgroup divided by 104857, rounded down, with a minimum of 1. The maximum rowgroup size of 1048576 implies a maximum number of pieces of 10 per rowgroup. Here’s a table to show all of the possibilities:
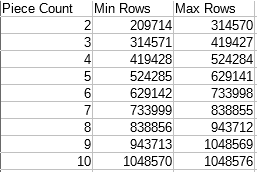
We can see evidence of this behavior in SQL Server with a few tests. As before I’ll need to slow down one thread. First I’ll put 943713 integers into a single compressed rowgroup:
DROP TABLE IF EXISTS dbo.TEST_CCI_SMALL;

CREATE TABLE dbo.TEST_CCI_SMALL (
ID BIGINT NOT NULL,
INDEX CCI CLUSTERED COLUMNSTORE
);

INSERT INTO dbo.TEST_CCI_SMALL WITH (TABLOCK)
SELECT TOP (943713) ROW_NUMBER()
	OVER (ORDER BY (SELECT NULL))
FROM master..spt_values t1
CROSS JOIN master..spt_values t2
CROSS JOIN master..spt_values t3
OPTION (MAXDOP 1);
I will test with a very similar query to a previous test:
SELECT COUNT(*)
FROM dbo.TEST_CCI_SMALL o
CROSS APPLY (
	SELECT TOP 1 1 c
	FROM
	(
		SELECT 1 c
		WHERE o.ID <> 1

		UNION ALL

		SELECT 1 c
		FROM master..spt_values t1
		CROSS JOIN master..spt_values t2
		CROSS JOIN master..spt_values t3
		WHERE o.ID = 1
		ORDER BY (SELECT NULL)
			OFFSET 100000000 ROWS
			FETCH FIRST 1 ROW ONLY
	) t
) t2
OPTION (QUERYTRACEON 8649, MAXDOP 4);
The parallel scan should be split into nine pieces to be divided among threads because the table has a single rowgroup with a row count of 943713. This is exactly what happens:
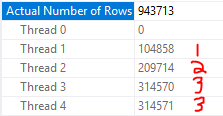
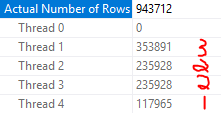
If I truncate the table and load one fewer row, the scan is now split up into eight pieces:
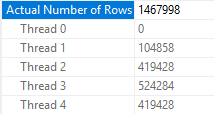
I can also create two compressed rowgroups of a size that should led to seven pieces per rowgroup:
DROP TABLE IF EXISTS dbo.TEST_CCI_SMALL;

CREATE TABLE dbo.TEST_CCI_SMALL (
	ID BIGINT NOT NULL,
	INDEX CCI CLUSTERED COLUMNSTORE
);

INSERT INTO dbo.TEST_CCI_SMALL WITH (TABLOCK)
SELECT TOP (733999) ROW_NUMBER()
	OVER (ORDER BY (SELECT NULL))
FROM master..spt_values t1
CROSS JOIN master..spt_values t2
CROSS JOIN master..spt_values t3
OPTION (MAXDOP 1);

INSERT INTO dbo.TEST_CCI_SMALL WITH (TABLOCK)
SELECT TOP (733999) 733999 + ROW_NUMBER()
	OVER (ORDER BY (SELECT NULL))
FROM master..spt_values t1
CROSS JOIN master..spt_values t2
CROSS JOIN master..spt_values t3
OPTION (MAXDOP 1);
Thread 1 processes the row with an ID of 734000 so it only gets one piece:
With more than one rowgroup, the demand-based aspect of piece distribution doesn’t quite work in the same way as with a single rowgroup. I wasn’t able to work out all of the details.
A Third Way?
What about queries that do not meet either of the two above criteria? For example, a query against a not small CCI that has a low cardinality estimate coming out of the scan? In some cases SQL Server will use rowgroup level distribution. In other cases it appears to use a combination of the two methods described above. Most of the time the behavior can be described as each thread gets assigned an entire rowgroup and threads race for pieces of the remaining rowgroups. I wasn’t able to figure out exactly how SQL Server decides which method to use, despite running many tests. However, I will show most of the behavior that I observed. First put 7 rowgroups into a CCI:
DROP TABLE IF EXISTS dbo.MYSTERIOUS_CCI;

CREATE TABLE dbo.MYSTERIOUS_CCI (
	ID BIGINT NOT NULL,
	INDEX CCI CLUSTERED COLUMNSTORE
);

INSERT INTO dbo.MYSTERIOUS_CCI WITH (TABLOCK)
SELECT TOP (1048576 * 7) ROW_NUMBER()
	OVER (ORDER BY (SELECT NULL))
FROM master..spt_values t1
CROSS JOIN master..spt_values t2
CROSS JOIN master..spt_values t3
OPTION (MAXDOP 1);

SELECT TOP 1 ID -- 6291457
FROM dbo.MYSTERIOUS_CCI;
I added local variables to my test query to lower the cardinality estimate. Otherwise I would get rowgroup distribution every time. Here’s an example query:
declare @lower_id INT = 1048576 * 2 + 1;
declare @upper_id INT = 1048576 * 7;

SELECT COUNT(*)
FROM dbo.MYSTERIOUS_CCI o
CROSS APPLY (
	SELECT TOP 1 1 c
	FROM
	(
		SELECT 1 c
		WHERE o.ID <> 6291457

		UNION ALL

		SELECT 1 c
		FROM master..spt_values t1
		CROSS JOIN master..spt_values t2
		CROSS JOIN master..spt_values t3
		WHERE o.ID = 6291457
		ORDER BY (SELECT NULL)
			OFFSET 100000000 ROWS
			FETCH FIRST 1 ROW ONLY
	) t
) t2
WHERE o.ID BETWEEN @lower_id AND @upper_id
OPTION (QUERYTRACEON 8649, MAXDOP 3);
With a MAXDOP of 3 and five processed rowgroups I get rowgroup level parallelism:

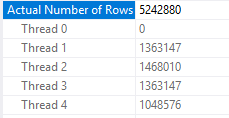
With a MAXDOP of 4 and five processed rowgroups, each thread gets a rowgroup and the other three threads race to process the remaining 20 pieces:
With a MAXDOP of 3 and six processed rowgroups we no longer get rowgroup level parallelism:

What about Partitioning?
In tests not reproduced here, I was not able to observe any differences in how rows were distributed for parallel CCI scans when the underlying CCI was partitioned. This seems reasonable if we think about how partitioning for CCIs is different than for rowstore tables. CCI partitions are simply a collection of rowgroups containing rows relevant to the partition. If there’s a need to split up the underlying components of a table we can just assign rowgroups to different threads. For rowstore tables, we can think of each partition as a mini-table. Partitioning for rowstore adds underlying objects which can be distributed to parallel threads.
Fun with Query Plans
With a partial understanding of how SQL server distributes rows after a parallel scan, we can write queries that show some of the edge cases that can lead to poor performance. The following query is complete nonsense but it shows the point well enough. Here I’m cross joining to a few numbers from the spt_values table. The CROSS JOIN is meant to represent other downstream work done by a query:
SELECT MAX(SQRT(o.ID + t.number))
FROM dbo.MYSTERIOUS_CCI o
CROSS JOIN master..spt_values t
WHERE o.ID <= 1100000 AND
t.number BETWEEN 0 AND 4
OPTION (MAXDOP 2, NO_PERFORMANCE_SPOOL, QUERYTRACEON 8649);
The cardinality estimate and MAXDOP of 2 leads to rowgroup level parallelism being used. Unfortunately, this is very unbalanced:

And as a result, the query barely benefits from parallelism:
CPU time = 25578 ms, elapsed time = 24580 ms.
It’s a well-guarded secret that queries run faster with odd MAXDOP , so let’s try a MAXDOP of 3. Now my parallel threads no longer sleep on the job:
CPU time = 30922 ms, elapsed time = 11840 ms.
Here’s the row distribution from the scan:

Final Thoughts
This post explored a bit of the observable behavior for how rows are distributed to threads after a parallel columnstore index scan. The algorithms used can in some cases lead to row imbalance on threads which can cause performance issues downstream in the plan. The lack of repartition stream operators in batch mode can make this problem worse than it might be for rowstore scans, but I still expect issues caused by it to be relatively uncommon in practice.
Thanks for reading!
Going Further
If this is the kind of SQL Server stuff you love learning about, you’ll love my training. I’m offering a 75% discount to my blog readers if you click from here. I’m also available for consulting if you just don’t have time for that and need to solve performance problems quickly.
One thought on “Columnstore Parallel Scan Row Distribution In SQL Server”
Comments are closed.