Be Careful When You Alter SQL Server Indexed Views

Yo, Is That Mary?


Going Further


If this is the kind of SQL Server stuff you love learning about, you’ll love my training. I’m offering a 75% discount to my blog readers if you click from here. I’m also available for consulting if you just don’t have time for that and need to solve performance problems quickly.

The Fastest Way To Get The Highest Value In SQL Server Part 1

Expresso


Let’s say you wanna get the highest thing. That’s easy enough as a concept.

Now let’s say you need to get the highest thing per user. That’s also easy enough to visualize.

There are a bunch of different ways to choose from to write it.

In this post, we’re going to use four ways I could think of pretty quickly, and look at how they run.

The catch for this post is that we don’t have any very helpful indexes. In other posts, we’ll look at different index strategies.

Query #1

To make things equal, I’m using CROSS APPLY in all of them.

The optimizer is free to choose how to interpret this, so WHATEVER.

SELECT u.Id,
       u.DisplayName,
	   u.Reputation,
	   ca.Score
FROM dbo.Users AS u
CROSS APPLY
(
    SELECT MAX(Score) AS Score
	FROM dbo.Posts AS p
	WHERE p.OwnerUserId = u.Id

) AS ca
WHERE u.Reputation >= 100000
ORDER BY u.Id;

The query plan is simple enough, and it runs for ~17 seconds.

SQL Server Query Plan
Big hitter

Query #2

This uses TOP 1.

SELECT u.Id,
       u.DisplayName,
	   u.Reputation,
	   ca.Score
FROM dbo.Users AS u
CROSS APPLY
(
    SELECT TOP (1) p.Score
	FROM dbo.Posts AS p
	WHERE p.OwnerUserId = u.Id
	ORDER BY p.Score DESC

) AS ca
WHERE u.Reputation >= 100000
ORDER BY u.Id;

The plan for this is also simple, but runs for 1:42, and has one of those index spool things in it.

SQL Server Query Plan
Unlucky

Query #3

This query uses row number rather than top 1, but has almost the same plan and time as above.

SELECT u.Id,
       u.DisplayName,
	   u.Reputation,
	   ca.Score
FROM dbo.Users AS u
CROSS APPLY
(
    SELECT p.Score,
	       ROW_NUMBER() OVER (ORDER BY p.Score DESC) AS n
	FROM dbo.Posts AS p
	WHERE p.OwnerUserId = u.Id
) AS ca
WHERE u.Reputation >= 100000
AND ca.n = 1
ORDER BY u.Id;
SQL Server Query Plan
Why send me silly notes?

Query #4

Also uses row number, but the syntax is a bit more complicated.

The row number happens in a derived table inside the cross apply, with the correlation and filtering done outside.

SELECT u.Id,
       u.DisplayName,
	   u.Reputation,
	   ca.Score
FROM dbo.Users AS u
CROSS APPLY
(
    SELECT * 
	FROM 
	(
        SELECT p.OwnerUserId,
	           p.Score,
	           ROW_NUMBER() OVER (PARTITION BY p.OwnerUserId 
			                      ORDER BY p.Score DESC) AS n
	    FROM dbo.Posts AS p
	) AS p
	WHERE p.OwnerUserId = u.Id
	AND p.n = 1
) AS ca
WHERE u.Reputation >= 100000
ORDER BY u.Id;

This is as close to competitive with Query #1 as we get, at only 36 seconds.

SQL Server Query Plan
That’s a lot of writing.

Wrap Up


If you don’t have helpful indexes, the MAX pattern looks to be the best.

Granted, there may be differences depending on how selective data in the table you’re aggregating is.

But the bottom line is that in that plan, SQL Server doesn’t have to Sort any data, and is able to take advantage of a couple aggregations (partial and full).

It also doesn’t spend any time building an index to help that one.

In the next couple posts, we’ll look at different ways to index for queries like this.

Thanks for reading!

Going Further


If this is the kind of SQL Server stuff you love learning about, you’ll love my training. I’m offering a 75% discount to my blog readers if you click from here. I’m also available for consulting if you just don’t have time for that and need to solve performance problems quickly.

SQL Server T-SQL Protip: watch those TOPs without ORDER BY

In the documentation for TOP, the following is listed as a best practice:

In a SELECT statement, always use an ORDER BY clause with the TOP clause. Because, it’s the only way to predictably indicate which rows are affected by TOP.

Let’s work through a real world example.

The good


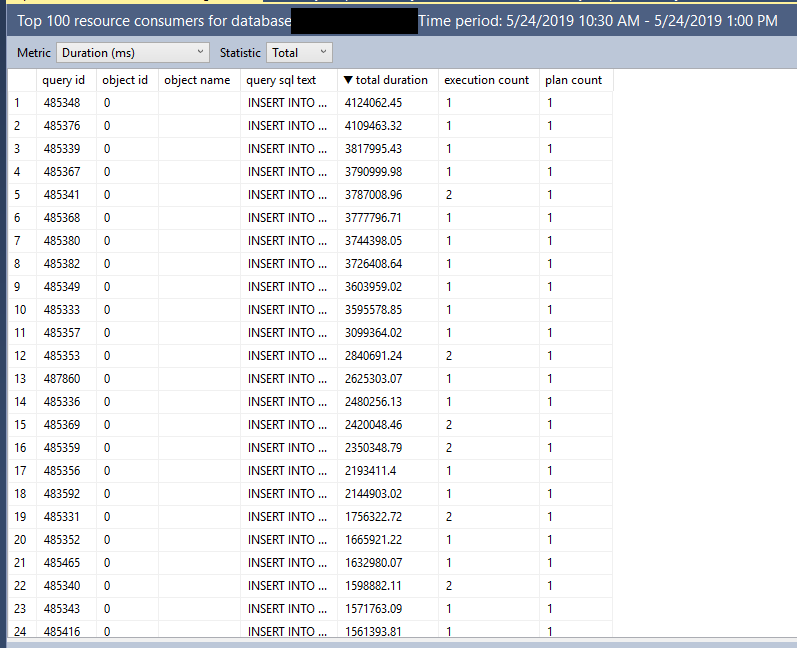
One of the great things about the “Top Resource Consuming Queries” query store SSMS report is that it is always able to render the query plan, even for very complex queries. I’m not aware of a pure T-SQL solution that can avoid requiring the end user to save xml to files in all cases. The report nearly always takes a long time to run, so it’s easy to capture the T-SQL that powers the grid details version:

DECLARE @results_row_count INT = 100,
@interval_start_time DATETIMEOFFSET = '2019-05-24 15:30:00 +00:00',
@interval_end_time DATETIMEOFFSET = '2019-05-24 18:00:00 +00:00';
 
SELECT TOP (@results_row_count)
    p.query_id query_id,
    q.object_id object_id,
    ISNULL(OBJECT_NAME(q.object_id),'') object_name,
    qt.query_sql_text query_sql_text,
    ROUND(CONVERT(float, SUM(rs.avg_duration*rs.count_executions))*0.001,2) total_duration,
    SUM(rs.count_executions) count_executions,
    COUNT(distinct p.plan_id) num_plans
FROM sys.query_store_runtime_stats rs
    JOIN sys.query_store_plan p ON p.plan_id = rs.plan_id
    JOIN sys.query_store_query q ON q.query_id = p.query_id
    JOIN sys.query_store_query_text qt ON q.query_text_id = qt.query_text_id
WHERE NOT (rs.first_execution_time > @interval_end_time OR rs.last_execution_time < @interval_start_time)
GROUP BY p.query_id, qt.query_sql_text, q.object_id
HAVING COUNT(distinct p.plan_id) >= 1
ORDER BY total_duration DESC;

Note the presence of the ORDER BY. I get exactly the results that I was expecting:

The bad


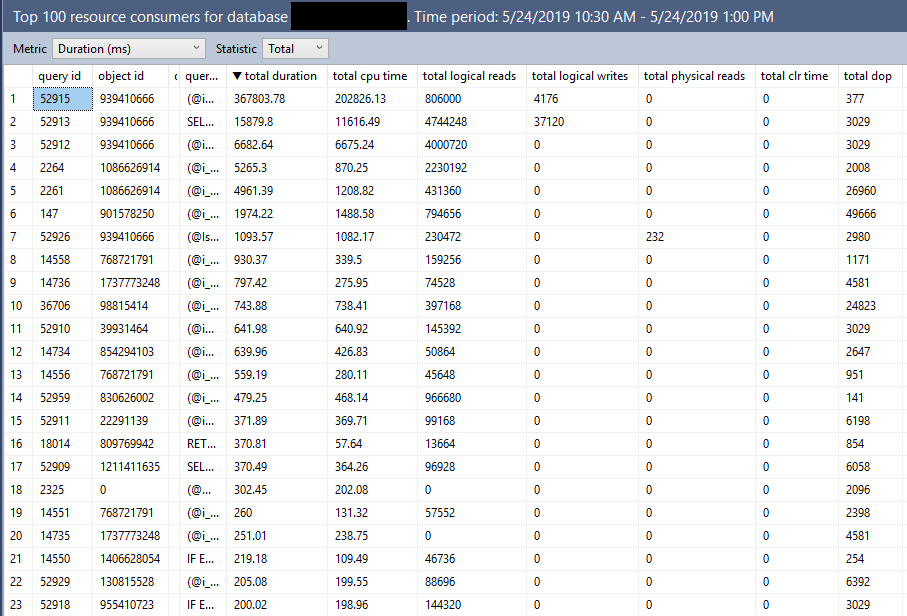
If I ask for extra details (who doesn’t want more details?), a significantly more complex query is generated:

-- grid format query with additional details
DECLARE @results_row_count INT = 100,
@interval_start_time DATETIMEOFFSET = '2019-05-24 15:30:00 +00:00',
@interval_end_time DATETIMEOFFSET = '2019-05-24 18:00:00 +00:00';
 
With wait_stats AS
(
SELECT
    ws.plan_id plan_id,
    ws.execution_type,
    ROUND(CONVERT(float, SUM(ws.total_query_wait_time_ms)/SUM(ws.total_query_wait_time_ms/ws.avg_query_wait_time_ms))*1,2) avg_query_wait_time,
    ROUND(CONVERT(float, SQRT( SUM(ws.stdev_query_wait_time_ms*ws.stdev_query_wait_time_ms*(ws.total_query_wait_time_ms/ws.avg_query_wait_time_ms))/SUM(ws.total_query_wait_time_ms/ws.avg_query_wait_time_ms)))*1,2) stdev_query_wait_time,
    CAST(ROUND(SUM(ws.total_query_wait_time_ms/ws.avg_query_wait_time_ms),0) AS BIGINT) count_executions,
    MAX(itvl.end_time) last_execution_time,
    MIN(itvl.start_time) first_execution_time
FROM sys.query_store_wait_stats ws
    JOIN sys.query_store_runtime_stats_interval itvl ON itvl.runtime_stats_interval_id = ws.runtime_stats_interval_id
WHERE NOT (itvl.start_time > @interval_end_time OR itvl.end_time < @interval_start_time)
GROUP BY ws.plan_id, ws.runtime_stats_interval_id, ws.execution_type ),
top_wait_stats AS
(
SELECT TOP (@results_row_count)
    p.query_id query_id,
    q.object_id object_id,
    ISNULL(OBJECT_NAME(q.object_id),'') object_name,
    qt.query_sql_text query_sql_text,
    ROUND(CONVERT(float, SUM(ws.avg_query_wait_time*ws.count_executions))*1,2) total_query_wait_time,
    SUM(ws.count_executions) count_executions,
    COUNT(distinct p.plan_id) num_plans
FROM wait_stats ws
    JOIN sys.query_store_plan p ON p.plan_id = ws.plan_id
    JOIN sys.query_store_query q ON q.query_id = p.query_id
    JOIN sys.query_store_query_text qt ON q.query_text_id = qt.query_text_id
WHERE NOT (ws.first_execution_time > @interval_end_time OR ws.last_execution_time < @interval_start_time)
GROUP BY p.query_id, qt.query_sql_text, q.object_id
),
top_other_stats AS
(
SELECT TOP (@results_row_count)
    p.query_id query_id,
    q.object_id object_id,
    ISNULL(OBJECT_NAME(q.object_id),'') object_name,
    qt.query_sql_text query_sql_text,
    ROUND(CONVERT(float, SUM(rs.avg_duration*rs.count_executions))*0.001,2) total_duration,
    ROUND(CONVERT(float, SUM(rs.avg_cpu_time*rs.count_executions))*0.001,2) total_cpu_time,
    ROUND(CONVERT(float, SUM(rs.avg_logical_io_reads*rs.count_executions))*8,2) total_logical_io_reads,
    ROUND(CONVERT(float, SUM(rs.avg_logical_io_writes*rs.count_executions))*8,2) total_logical_io_writes,
    ROUND(CONVERT(float, SUM(rs.avg_physical_io_reads*rs.count_executions))*8,2) total_physical_io_reads,
    ROUND(CONVERT(float, SUM(rs.avg_clr_time*rs.count_executions))*0.001,2) total_clr_time,
    ROUND(CONVERT(float, SUM(rs.avg_dop*rs.count_executions))*1,0) total_dop,
    ROUND(CONVERT(float, SUM(rs.avg_query_max_used_memory*rs.count_executions))*8,2) total_query_max_used_memory,
    ROUND(CONVERT(float, SUM(rs.avg_rowcount*rs.count_executions))*1,0) total_rowcount,
    ROUND(CONVERT(float, SUM(rs.avg_log_bytes_used*rs.count_executions))*0.0009765625,2) total_log_bytes_used,
    ROUND(CONVERT(float, SUM(rs.avg_tempdb_space_used*rs.count_executions))*8,2) total_tempdb_space_used,
    SUM(rs.count_executions) count_executions,
    COUNT(distinct p.plan_id) num_plans
FROM sys.query_store_runtime_stats rs
    JOIN sys.query_store_plan p ON p.plan_id = rs.plan_id
    JOIN sys.query_store_query q ON q.query_id = p.query_id
    JOIN sys.query_store_query_text qt ON q.query_text_id = qt.query_text_id
WHERE NOT (rs.first_execution_time > @interval_end_time OR rs.last_execution_time < @interval_start_time)
GROUP BY p.query_id, qt.query_sql_text, q.object_id
)
SELECT TOP (@results_row_count)
    A.query_id query_id,
    A.object_id object_id,
    A.object_name object_name,
    A.query_sql_text query_sql_text,
    A.total_duration total_duration,
    A.total_cpu_time total_cpu_time,
    A.total_logical_io_reads total_logical_io_reads,
    A.total_logical_io_writes total_logical_io_writes,
    A.total_physical_io_reads total_physical_io_reads,
    A.total_clr_time total_clr_time,
    A.total_dop total_dop,
    A.total_query_max_used_memory total_query_max_used_memory,
    A.total_rowcount total_rowcount,
    A.total_log_bytes_used total_log_bytes_used,
    A.total_tempdb_space_used total_tempdb_space_used,
    ISNULL(B.total_query_wait_time,0) total_query_wait_time,
    A.count_executions count_executions,
    A.num_plans num_plans
FROM top_other_stats A LEFT JOIN top_wait_stats B on A.query_id = B.query_id and A.query_sql_text = B.query_sql_text and A.object_id = B.object_id
WHERE A.num_plans >= 1
ORDER BY total_duration DESC
)

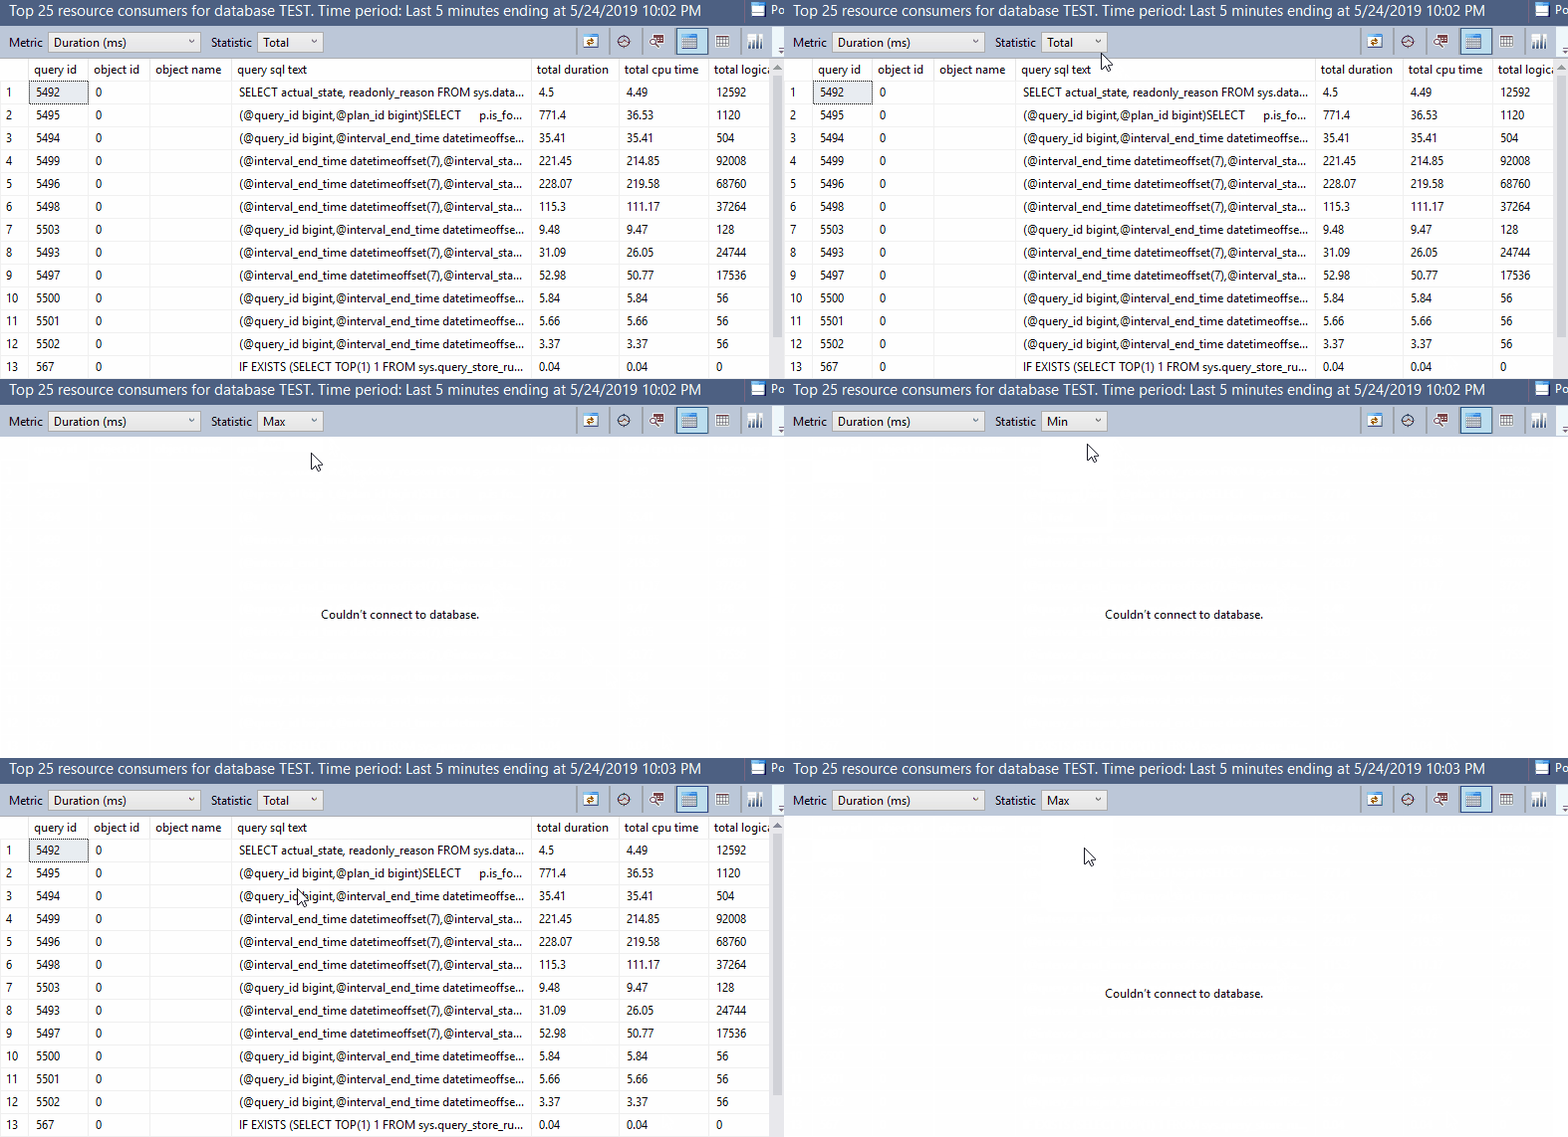
Now we have not 1, not 2, but THREE TOP operators! But only one of them has an ORDER BY. The results are completely different, and are pretty much useless:

The ugly


This has nothing to do with TOP as far as I know, but I included it just for fun:

Final thoughts


All of you developers out there should watch your TOPs and make sure you’re using ORDER BY as needed. Otherwise, you might end up with annoyed end users writing blog posts about your code.

Thanks for reading!

Going Further


If this is the kind of SQL Server stuff you love learning about, you’ll love my training. I’m offering a 75% discount to my blog readers if you click from here. I’m also available for consulting if you just don’t have time for that and need to solve performance problems quickly.

Top 1 vs. Row Number in SQL Server

Cruel, Cruel Number


One is the loneliest number. Sometimes it’s also the hardest number of rows to get, depending on how you do it.

In this video, I’ll show you how a TOP 1 query can perform much differently from a query where you generate row numbers and look for the first one.

Thanks for watching!

Going Further


If this is the kind of SQL Server stuff you love learning about, you’ll love my training. I’m offering a 75% discount to my blog readers if you click from here. I’m also available for consulting if you just don’t have time for that and need to solve performance problems quickly.

Manipulating Cardinality Estimates with SQL Server T-SQL Scalar UDFs

For this post I’m using the legacy cardinality estimator on SQL Server 2016 SP1.

The Problem


Scalar user defined functions are evil but sometimes necessary. The following scenario will sound a bit contrived but it’s based on a real world problem. Suppose that end users can filter the amount of data returned by a query by inputting values into a UDF that does some kind of translation. Below is a sample schema:

CREATE TABLE dbo.Example (
ID BIGINT NOT NULL,
NOT_ID VARCHAR(100) NOT NULL,
PRIMARY KEY (ID));

INSERT INTO dbo.Example WITH (TABLOCK)
(ID, NOT_ID)
SELECT TOP (1000000)
  ROW_NUMBER() OVER (ORDER BY (SELECT NULL))
, REPLICATE('Example', 14)
FROM master..spt_values t1
CROSS JOIN master..spt_values t2;

GO

CREATE FUNCTION dbo.MY_FAVORITE_UDF (@ID BIGINT)
RETURNS BIGINT AS
BEGIN
	RETURN @ID;
END;

Consider the following part of a much bigger query:

SELECT ID, NOT_ID
FROM dbo.Example
WHERE ID >= dbo.MY_FAVORITE_UDF(100000)
AND ID <= dbo.MY_FAVORITE_UDF(900000);

For this demo it’s not important that the UDF do anything so I must made it return the input. To keep things simple I’m not going to follow best practices around writing the query to avoid executing the UDFs for each row in the table.  With the legacy cardinality estimator we get a cardinality estimate of 30% of the rows in the base table for each unknown equality condition. This means that a BETWEEN against two UDFs will give a cardinality estimate of 9%. The important point is that the cardinality estimate will not change as the inputs for the UDFs change, except for the trivial case in which the inputs are the same. This can easily be seen by varying the inputs and looking at the estimated execution plans:

SELECT ID, NOT_ID
FROM dbo.Example
WHERE ID >= dbo.MY_FAVORITE_UDF(100000)
AND ID <= dbo.MY_FAVORITE_UDF(900000);

Query plan:

blog picture 1

SELECT ID, NOT_ID
FROM dbo.Example
WHERE ID >= dbo.MY_FAVORITE_UDF(500000)
AND ID <= dbo.MY_FAVORITE_UDF(499999);

Query plan:

blog picture 2

SELECT ID, NOT_ID
FROM dbo.Example
WHERE ID BETWEEN dbo.MY_FAVORITE_UDF(1)
AND dbo.MY_FAVORITE_UDF(1);

Query plan:

blog-picture-3.png

The cardinality estimate (CE) of just that simple query doesn’t really matter. But it could matter very much if that query was part of a larger query with other joins. The 9% estimate may not serve us well depending on the rest of the query and what end users tend to input. We might know that the end users tend to pick large or small ranges. Even if we don’t know anything about the end users, certain queries may do better with larger or smaller cardinality estimates.

Decreasing the Cardinality Estimate


Let’s suppose that we do some testing and find that a cardinality estimate of lower than 9% is the best choice for typical end user inputs. There are a few techniques available to decrease the cardinality estimate by a fixed percentage.

Method 1

First option is to use TOP PERCENT along with an OPTIMIZE FOR hint. I’m not really a fan of TOP PERCENT. The implementation always spools unless it gets optimized out with TOP (100) percent. It would be nice if it didn’t spool. Anyway, perhaps getting a different cardinality estimate is worth the spool. Below is one method to get a cardinality estimate of 3% of the base table:

DECLARE @top_percent FLOAT = 100;

SELECT TOP (@top_percent) PERCENT ID, NOT_ID
FROM dbo.Example
WHERE ID >= dbo.MY_FAVORITE_UDF(100000)
AND ID <= dbo.MY_FAVORITE_UDF(900000)
OPTION (OPTIMIZE FOR (@top_percent = 33.33333333));

Query plan:

blog picture 4

The percent value is a float so we can go almost anywhere between 0 – 9% for the final estimate. However, if we have to use scalar UDFs in this fashion there’s a chance that we’re doing it to write platform agnostic code. The TOP trick here isn’t likely to work in other platforms.

Method 2

Suppose we add another inequality against a UDF that’s guaranteed not to change the results. 0.3^3 = 0.027 so we would expect an estimate of 2.7%. That is indeed what happens:

SELECT ID, NOT_ID
FROM dbo.Example
WHERE ID >= dbo.MY_FAVORITE_UDF(100000)
AND ID <= dbo.MY_FAVORITE_UDF(900000) -- redundant filter to change CE
AND ID > dbo.MY_FAVORITE_UDF(100000) - 1;

Query plan:

blog picture 5
We can also mix things up with OR logic to make more adjustments. The query below has a fixed CE of 4.59%:

SELECT ID, NOT_ID
FROM dbo.Example
WHERE ID >= dbo.MY_FAVORITE_UDF(100000)
AND ID <= dbo.MY_FAVORITE_UDF(900000) -- redundant filter to change CE
AND (ID > dbo.MY_FAVORITE_UDF(100000) - 1
OR ID > dbo.MY_FAVORITE_UDF(100000) - 2);

Query plan:

blog picture 6

It should be possible to mix and match to get something close to the CE that you want. I need to reiterate that as the code is written this will lead to additional UDF executions per row. You can also use techniques with fixed CE that don’t involve UDFs if you’re confident that Microsoft won’t change the guesses for them (which for the legacy cardinality estimator is probably a pretty safe assumption at this point).

Increasing the Cardinality Estimate


In some cases we will want a cardinality estimate above 9%.

Method 1

The TOP PERCENT trick won’t work here since TOP on its own can’t increase a cardinality estimate. We can use OR logic with UDFs to raise the estimate. Consider this filter condition:

ID >= dbo.MY_FAVORITE_UDF(100000)
OR ID >= dbo.MY_FAVORITE_UDF(900000) - 1

The first inequality gives an estimate of 30% and the second inequality gives an estimate of (100% – 30%) * 30% = 21%. In total we would get an estimate of 51%. If we apply that twice we should get an overall estimate of 0.51 * 0.51 = 26.01% . This is indeed what happens:

SELECT ID, NOT_ID
FROM dbo.Example
WHERE (ID >= dbo.MY_FAVORITE_UDF(1)
OR ID >= dbo.MY_FAVORITE_UDF(1) - 1)
AND (ID <= dbo.MY_FAVORITE_UDF(2)
OR ID <= dbo.MY_FAVORITE_UDF(2) + 1);

Query plan:

blog picture 7

By adding more UDFs to the OR clauses we can increase the cardinality estimate further.

Method 2

For another way to do it we can take advantage of the fact that an inequality filter against a UDF has the same cardinality as the negated condition. That means that this:

SELECT ID, NOT_ID
FROM dbo.Example

EXCEPT

SELECT ID, NOT_ID
FROM dbo.Example
WHERE -- negate original expression
ID < dbo.MY_FAVORITE_UDF(100000) OR ID > dbo.MY_FAVORITE_UDF(900000);

Will return the same results as the original query but have a much higher cardinality estimate. Writing it in a better way, we see a cardinality estimate of ~54.4%:

SELECT e1.ID, e1.NOT_ID
FROM dbo.Example e1
WHERE NOT EXISTS (
	SELECT 1
	FROM dbo.Example e2
	WHERE e1.ID = e2.ID
	-- negate original expression
	AND e2.ID < dbo.MY_FAVORITE_UDF(100000) OR e2.ID > dbo.MY_FAVORITE_UDF(900000)
);

Query plan:
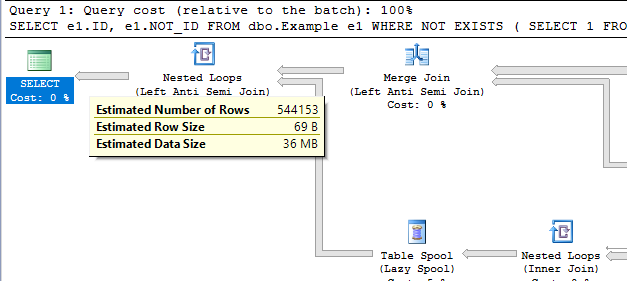
blog picture 8
This can be adjusted up and down by adding additional UDFs. It comes with the cost of an additional join so it’s hard to think of an advantage of doing it this way.

Method 3

For a third option we can use the MANY() table-valued function developed by Adam Machanic. This function can be used to increase the cardinality estimate of a point in a plan by a whole number. If we want a cardinality estimate of 18% from the UDF it’s as easy as the following:

SELECT TOP (9223372036854775807) ID, NOT_ID
FROM dbo.Example
CROSS JOIN dbo.Many(2)
WHERE ID BETWEEN dbo.MY_FAVORITE_UDF(100000)
AND dbo.MY_FAVORITE_UDF(900000);

Query plan:

blog picture 9

I added the superfluous TOP to prevent the MANY() reference from getting moved around in the plan. This method has the disadvantage that it may not be platform-agnostic.

Hopefully you never find yourself in a situation where you need to use tricks like this. Thanks for reading!

Going Further


If this is the kind of SQL Server stuff you love learning about, you’ll love my training. I’m offering a 75% discount to my blog readers if you click from here. I’m also available for consulting if you just don’t have time for that and need to solve performance problems quickly.