Starting SQL: Blind Spots In SQL Server’s Missing Index Requests

Underfoot


There are all sorts of things that might artificially keep the optimizer from suggesting a helpful index while you’re writing or tuning a query.

But go figure, there are also totally sensible things that will make it less likely that you’ll get one, and there are definitely things that the requests don’t consider as heavily.

That doesn’t mean they’re awful and wrong, it just means you should practice looking at the requests that get generated with execution plans to see if there’s anything you can tweak to make things run a little bit more smoothly.

Anyway, let’s learn some important lessons about missing index requests.

Lesson One: Inequalities Are Iffy


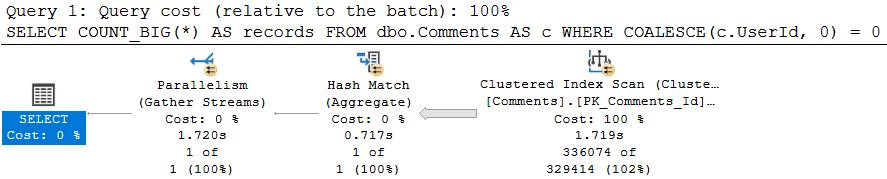
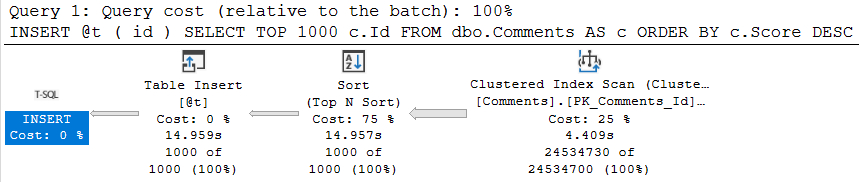
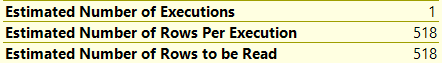
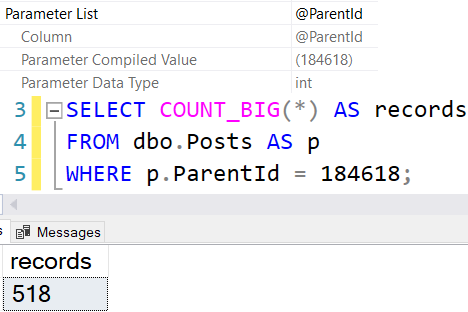
In my copy of the Stack Overflow database, both of these queries return the same single row.

There is only one comment with 1270(!!!) upvotes, so either query works to locate the data.

/*Inequality predicate*/
SELECT c.CreationDate,
       c.PostId,
       c.Score,
       c.Text,
       c.UserId
FROM dbo.Comments AS c
WHERE c.Score >= 1270 --Hello I'm here
AND   c.CreationDate >= '20110101'
AND   c.CreationDate <  '20120101'
ORDER BY c.CreationDate DESC;

/*Equality predicate*/
SELECT c.CreationDate,
       c.PostId,
       c.Score,
       c.Text,
       c.UserId
FROM dbo.Comments AS c
WHERE c.Score = 1270 --Hello I'm here
AND   c.CreationDate >= '20110101'
AND   c.CreationDate <  '20120101'
ORDER BY c.CreationDate DESC;

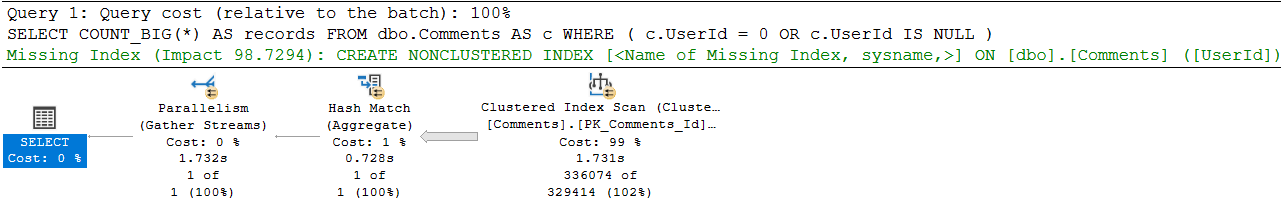
Strangely, only one query qualifies for a missing index request, and it’s not the first one.

SQL Server Query Plan
but why.

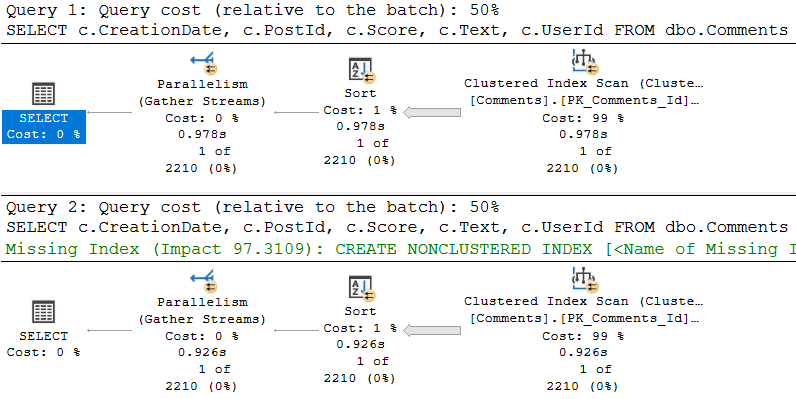
The index request look like this:

CREATE NONCLUSTERED INDEX [<Name of Missing Index, sysname,>]
ON [dbo].[Comments] ([Score],[CreationDate])
INCLUDE ([PostId],[Text],[UserId])

Which is likely fine, as long as you’re okay with the Text column being in there. It’s an NVARCHAR(700), which makes me a little hesitant.

Not adding it, of course, means the optimizer would have to make a choice about Key Lookups vs. Clustered Index Scans, depending on predicates.

Databases are hard.

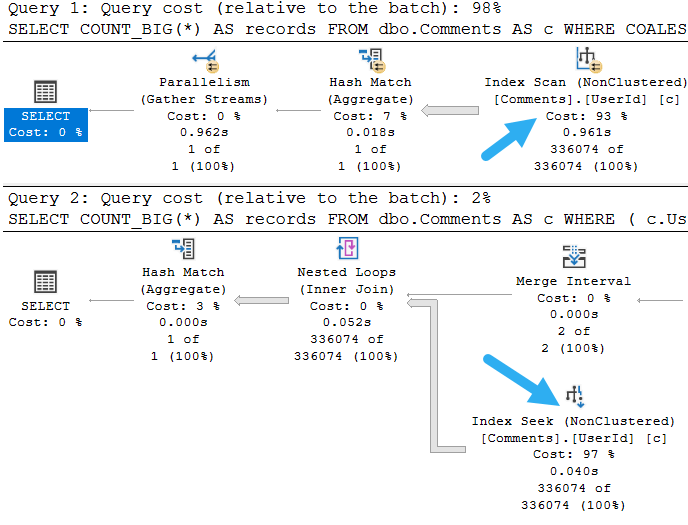
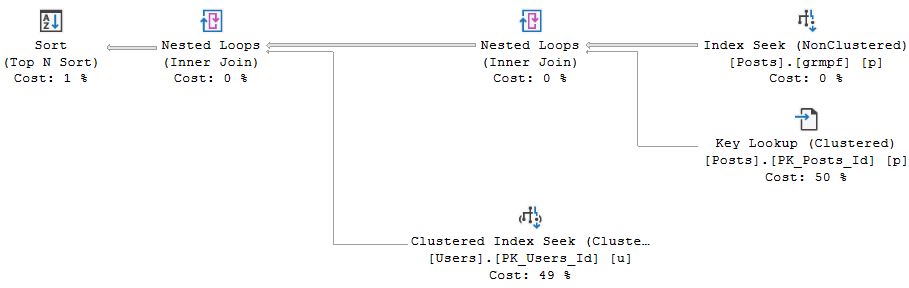
Lesson Two: Joins Don’t Get A Lot Of Love


If we add a join to the Posts table, the missing index request doesn’t change.

SELECT c.CreationDate,
       c.PostId,
       c.Score,
       c.Text,
       c.UserId
FROM dbo.Comments AS c
JOIN dbo.Posts AS p
    ON p.Id = c.PostId
    AND p.OwnerUserId = c.UserId
WHERE c.Score = 1270 --Hello I'm here
AND   c.CreationDate >= '20110101'
AND   c.CreationDate <  '20120101'
AND 1 = (SELECT 1)
ORDER BY c.CreationDate DESC;

We get the same missing index request as above, which might strike you as a little odd.

savage

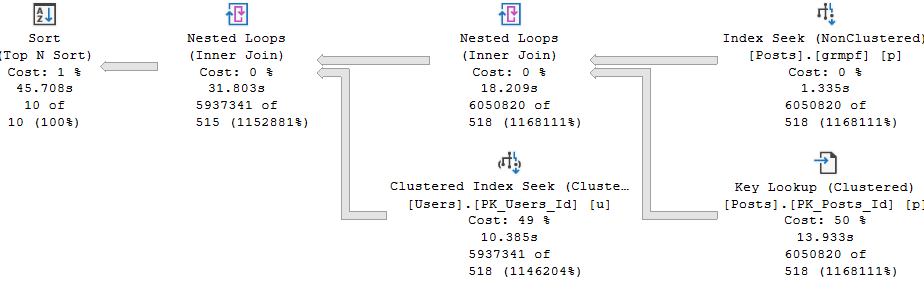
Sometimes it’s nice to have join columns in the key of an index. Orderly data tends to join more easily, and can give the optimizer more efficient ways to do it.

It probably doesn’t matter a ton for Hash Joins, but Merge Joins expect data in order. If it’s not, the optimizer will introduce a Sort to get it in order. Likewise, Nested Loops without indexes can be painful.

Having columns as includes means it’s not stored in an order that might be helpful. In fact, it’s not stored in any order at all.

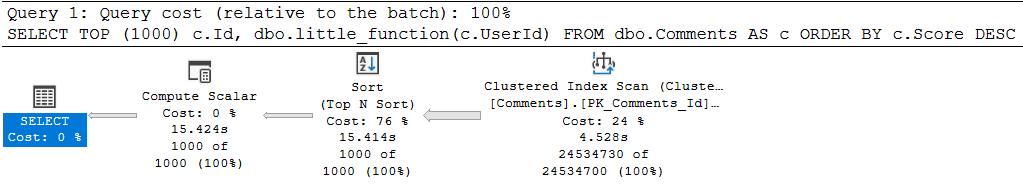
Lesson Three: Neither Does Order By


In our original query, the CreationDate column, by coincidence, was both in the WHERE and ORDER BY clauses.

It ended up in the key columns of the index because of the WHERE clause, though. If we remove it from there, it’ll move to the included columns.

SELECT c.CreationDate,
       c.PostId,
       c.Score,
       c.Text,
       c.UserId
FROM dbo.Comments AS c
WHERE c.Score = 1270 --Hello I'm here
ORDER BY c.CreationDate DESC;
SQL Server Missing Index Request
now you’re getting sued

Why Are We Talking About Indexes Again?


If I do enough drilling, hopefully you’ll understand how important they are to performance.

What I want you to take away from this post is that when you’re looking specifically at missing index requests, whether they’re in query plans or in the missing index DMVs:

I covered a lot of the “why” in these posts:

Without them, it may look weird to spend time talking about the limitations here. But this is why databases still need humans to care for them.

As much as I look forward to a day where they don’t, little things like which columns should be in the key of an index, and the order they should be in, are still important considerations.

You know. Little things.

Thanks for reading!

Going Further


If this is the kind of SQL Server stuff you love learning about, you’ll love my training. I’m offering a 75% discount to my blog readers if you click from here. I’m also available for consulting if you just don’t have time for that and need to solve performance problems quickly.

Starting SQL: Why Wouldn’t An Index Help Your SQL Server Query Go Faster?

Pennies From Redmond


We’re spoiled over here in SQL Server land. When we run queries, the optimizer will suggest indexes that might help it run faster. I say might, because sometimes it’s wrong. Like I mentioned before, these suggestions are a bit hasty.

If you read the limitations, the first thing they say is “It is not intended to fine tune an indexing configuration”.

And they’re not. But you know what? If you don’t have anyone who is fine tuning an indexing configuration, they’re a heck of a lot better than a whole lot of nothing.

Are You There, Optimizer?


Starting with no nonclustered indexes, and a clustered index on an unrelated column, this query is a prime candidate for an index. And yet, the optimizer has forsaken us in our time of need.

SELECT COUNT_BIG(*) AS records
FROM dbo.Comments AS c
WHERE COALESCE(c.UserId, 0) = 0;

This isn’t specific to COALESCE, any ol’ function — built-in or otherwise — would do it. But the optimizer doesn’t think an index would make this query any faster. That’s a real bummer.

You may hear people say things like “you can’t use indexes with functions”, but that sentence is incomplete. What’s meant is “you can’t use indexes to seek with functions”.

SQL Server Query Plan
no chance

Going Boing


This goes back to the concept of SARGability that I talked about before. If we do a little bit more typing, the optimizer is our friend again. I know, typing more sucks, but you’ll thank me later.

SELECT COUNT_BIG(*) AS records
FROM dbo.Comments AS c
WHERE ( c.UserId = 0 
        OR c.UserId IS NULL );

The optimizer is back to having good ideas for us. But notice that both of these queries end up taking the same amount of time and doing the same amount of work.

If you were just getting started writing queries, performance tuning, or looking at query plans, you might see this and assume that query performance would remain identical.

SQL Server Query
zooming out

It’s sort of a matter of opportunity, here. Like I said before, when you wrap predicates in functions, you lose the ability to seek into indexes.

Sure, you could use an index on UserId in either query, but it doesn’t usually fix a whole lot if you need to scan the entire thing.

Copying In


If we add in the index on UserId and compare plans, the difference is obvious.

SQL Server Query Plan
further, longer

Our clearly-expressed query does a lot better here. It’s able to seek, and even running with a serial plan is much faster than the parallel plan for the poorly-expressed query. These things do matter to performance. Functions, even built-in ones, have no relational meaning to the optimizer, and can’t be reasoned with.

When it comes to writing queries, it usually pays to over-communicate. When you take shortcuts, you might not get the best possible outcome.

Tomorrow, we’ll look at hidden missing index requests.

Thanks for reading!

Going Further


If this is the kind of SQL Server stuff you love learning about, you’ll love my training. I’m offering a 75% discount to my blog readers if you click from here. I’m also available for consulting if you just don’t have time for that and need to solve performance problems quickly.

Starting SQL: Why Your SQL Server Query Can’t Go Parallel, Scalar Functions Edition

I Won’t Share You


Yesterday we looked at where table variables can have a surprising! impact on performance. We’ll talk more about them later, because that’s not the only way they can stink. Not by a long shot. Even with 1 row in them.

Anyway, look, today’s post is sort of like yesterday’s post, except I’ve had two more drinks.

What people seem to miss about scalar valued functions is that there’s no distinction between ones that touch data and ones that don’t. That might be some confusion with CLR UDFs, which cause parallelism issues when they access data.

Beans and Beans


What I want to show you in this post is that it doesn’t matter if your scalar functions touch data or not, they’ll still have similar performance implications to the queries that call them.

Now look, this might not always matter. You could just use a UDF to assign a value to a variable, or you could call it in the context of a query that doesn’t do much work anyway. That’s probably fine.

But if you’re reading this and you have a query that’s running slow and calling a UDF, it just might be why.

  • If the UDF queries table data and is inefficient
  • If the UDF forces the outer query to run serially

They can be especially difficult on reporting type queries. On top of forcing them to run serially, the functions also run once per row, unlike inline-able constructs.

Granted, this once-per-row thing is worse for UDFs that touch data, because they’re more likely to encounter the slings and arrows of relational data. The reads could be blocked, or the query in the function body could be inefficient for a dozen reasons. Or whatever.

I’m Not Touching You


Here’s a function that doesn’t touch anything at all.

CREATE OR ALTER FUNCTION dbo.little_function (@UserId INT)
RETURNS BIGINT
WITH SCHEMABINDING, 
     RETURNS NULL ON NULL INPUT
AS
BEGIN
DECLARE @d DATETIME = GETDATE();
RETURN
(
    ( 
      SELECT @UserId
    )
)
END
GO

I have the declared variable in there set to GETDATE() to disable UDF inlining in SQL Server 2019.

Yes, I know there’s a function definition to do the same thing, but I want you to see just how fragile a feature it is right now. Again, I love where it’s going, but it can’t solve every single UDF problem.

Anyway, back to the story! Let’s call that function that doesn’t do anything in our query.

SELECT TOP (1000) 
    c.Id,
    dbo.little_function(c.UserId)
FROM dbo.Comments AS c
ORDER BY c.Score DESC;

The query plan looks like so, with the warning in properties about not being able to generate a valid parallel plan.

what’s so great about you?

In this plan, we see the same slowdown as the insert to the table variable. There’s no significant overhead from the function, it’s just slower in this case because the query is forced to run serially by the function.

This is because of the presence of a scalar UDF, which can’t be inlined in 2019. The serial plan represents, again, a significant slowdown over the parallel plan.

Bu-bu-bu-but wait it gets worse


Let’s look at a worse function.

CREATE OR ALTER FUNCTION dbo.big_function (@UserId INT)
RETURNS BIGINT
WITH SCHEMABINDING, 
     RETURNS NULL ON NULL INPUT
AS
BEGIN
DECLARE @d DATETIME = GETDATE();
RETURN
(
    ( 
      SELECT SUM(p.Score)
      FROM dbo.Posts AS p
      WHERE p.OwnerUserId = @UserId
    ) - 
    (
      SELECT SUM(c.Score)
      FROM dbo.Comments AS c
      WHERE c.UserId = @UserId
    )
)
END
GO

Not worse because it’s a different kind of function, just worse because it goes out and touches tables that don’t have any helpful indexes.

Getting to the point, if there were helpful indexes on the tables referenced in the function, performance wouldn’t behave as terribly. I’m intentionally leaving it without indexes to show you a couple funny things though.

Because this will run a very long time with a top 1000, I’m gonna shorten it to a top 1.

SELECT TOP (1) 
    c.Id,
    dbo.big_function(c.UserId)
FROM dbo.Comments AS c
ORDER BY c.Score DESC;

Notice that in this plan, the compute scalar takes up a more significant portion of query execution time. We don’t see what the compute scalar does, or what the function itself does in the actual query plan.

got yourself a function

The compute scalar operator is what’s responsible for the scalar UDF being executed. In this case, it’s just once. If I had a top that asked for more than one row, It would be responsible for more executions.

We don’t see the function’s query plan in the actual query, because it could generate a different query plan on each execution. Would you really want to see 1000 different query plans?

Anyway, it’s quite easy to observe with operator times where time is spent here. Most people read query plans from right to left, and that’s not wrong.

In that same spirit, we can add operator times up going from right to left. Each operator not only account for its own time, but for the time of all operators that come before it.

The clustered index scan takes 7.5 seconds, the Sort takes 3.3 seconds, and the compute scalar takes 24.9 seconds. Wee.

Step Inside


If you get an actual plan for this query, you won’t see what the function does. If you get an estimated plan, you can get a picture of what the function is up to.

monster things

This is what I meant by the function body being allowed to go parallel. This may lead to additional confusion when the calling query accrues parallel query waits but shows no parallel operators, and has a warning that a parallel plan couldn’t be generated.

hi my name is

It’s Not As Funny As It Sounds


If you look at a query plan’s properties and see a non-parallel plan reason, table variable modifications and scalar UDFs will be the most typical cause. They may not always be the cause of your query’s performance issues, and there are certainly many other local factors to consider.

It’s all a bit like a game of Clue. You might find the same body in the same room with the same bashed in head, but different people and blunt instruments may have caused the final trauma.

Morbid a bit, sure, but if query tuning were always a paint by numbers, no one would stay interested.

Anyway.

In the next posts? we’ll look at when SQL Server tells you it needs an index, and when it doesn’t.

Thanks for reading!

Going Further


If this is the kind of SQL Server stuff you love learning about, you’ll love my training. I’m offering a 75% discount to my blog readers if you click from here. I’m also available for consulting if you just don’t have time for that and need to solve performance problems quickly.

Starting SQL: Why Your Query Can’t Go Parallel, Table Variables Edition

SURPRISE!


The important thing to understand about parallelism is it’s great when appropriate. Striking a balance between what should go parallel, the CPU usage it’s allowed, and what should stay serial can be tough.

It can be especially difficult when parameter sniffing comes into play. Here are a couple scenarios:

  • For a small amount of data, a serial query plan runs quickly and uses relatively few resources
  • For a large amount of data, a query re-uses the serial plan and runs for >20 seconds
  • For a small amount of data, a re-used parallel plan overloads the server due to many concurrent sessions
  • For a large amount of data, the re-used parallel plan finishes in 2-3 seconds

What do you do? Which plan do you favor? It’s an interesting scenario. Getting a single query to run faster by going parallel may seem ideal, but you need extra CPU, and potentially many more worker threads to accomplish that.

In isolation, you may think you’ve straightened things out, but under concurrency you run out of worker threads.

There are ways to address this sort of parameter sniffing, which we’ll get to at some point down the line.

Wrecking Crew


One way to artificially slow down a query is to use some construct that will inhibit parallelism when it would be appropriate.

There are some exotic reasons why a query might not go parallel, but quite commonly scalar valued functions and inserts to table variables are the root cause of otherwise parallel-friendly queries staying single-threaded and running for long times.

While yes, some scalar valued functions can be inlined in SQL Server 2019, not all can. The list of ineligible constructs has grown quite a bit, and will likely continue to. It’s a feature I love, but it’s not a feature that will fix everything.

Databases are hard.

XML Fetish


You don’t need to go searching through miles of XML to see it happening, either.

All you have to do is what I’ve been telling you all along: Look at those operator properties. Either hit F4, or right click and choose the properties of a select operator.

nonparallelplanreasonokaybutwhycanyoupleasetellme

Where I see these performance surprises! pop up is often when either:

  • Developers develop on a far smaller amount of data than production contains
  • Vendors have clients with high variance in database size and use

In both cases, small implementations likely mask the underlying performance issues, and they only pop up when run against bigger data. The whole “why doesn’t the same code run fast everywhere” question.

Well, not all features are created equally.

Simple Example


This is where table variables catch people off-guard. Even the “I swear I don’t put a lot of rows in them” crowd may not realize that the process to get down to very few rows is impacted by these @features.

SELECT TOP (1000) c.Id
FROM dbo.Comments AS c
ORDER BY c.Score DESC;

This query, on its own, is free to go parallel — and it does! It takes about 4.5 seconds to do so. It’s intentionally simple.

SQL Server Query Plan
don’t @ me

Once we try to involve a @table variable insert, parallelism goes away, time increases 3 fold, and the non-parallel plan reason is present in the plan XML.

DECLARE @t TABLE(id INT);

INSERT @t ( id )
SELECT TOP 1000 c.Id
FROM dbo.Comments AS c
ORDER BY c.Score DESC;
SQL Server Query Plan
well.

Truesy


This can be quite a disappointing ramification for people who love to hold themselves up as responsible table variable users. The same will occur if you need to update or delete from a @table variable. Though less common, and perhaps less in need of parallelism, I’m including it here for completeness.

This is part of why multi-statement table valued functions, which return @table variables, can make performance worse.

To be clear, this same limitation does not exist for #temp tables.

Anyway, this post went a little longer than I thought it would, so we’ll look at scalar functions in tomorrow’s post to keep things contained.

Thanks for reading!

Going Further


If this is the kind of SQL Server stuff you love learning about, you’ll love my training. I’m offering a 75% discount to my blog readers if you click from here. I’m also available for consulting if you just don’t have time for that and need to solve performance problems quickly.

Starting SQL: Query Memory Grants In SQL Server Execution Plans

Do You Believe?


Memory is so very important to SQL Server performance. It doesn’t solve every problem, but you sure as heck feel it when there’s not enough. Like I said before, memory is a shared resource.

Your buffer pool needs it to cache data pages, and your queries need it for operators that need extra space to write stuff down.

If you constantly have queries and the buffer pool fighting over memory, sure, you might just need more memory. You might also need to grapple with those memory grants in a different way.

You & Me


To recap earlier posts, the most common things you’ll see asking for memory grants in a query plan are Sorts and Hashes. There is one form of optimized Nested Loops that’ll ask for memory, but I don’t see people running into problems with those all too often.

Let’s start with a simple query that will ask for a memory grant to sort data.

SELECT *
FROM 
     (  
        SELECT TOP (1000) 
                 u.Id          -- 166MB (INT)
               , u.DisplayName -- 300MB (NVARCHAR 40)
               , u.WebsiteUrl  -- 900MB (NVARCHAR 200)
               , u.Location    -- 1.3GB (NVARCHAR 100)
               , u.AboutMe     -- 9.4GB (NVARCHAR MAX)
        FROM dbo.Users AS u
        ORDER BY u.Reputation
     ) AS u
OPTION(MAXDOP 1, RECOMPILE);

Now, in a previous post I explained how the optimizer can make some weird guesses about memory grant needs when you get strings involved — not ordering by strings, just selecting them.

The guess made is that string columns will be half full. That can work out okay if your string-column-fullness hovers around the middle ground.

But if it hovers towards the high or low end of how you’ve defined the length of your string columns, you can end up with some crappy memory need estimates.

In the last post, we looked at how much the optimizer would ask for. Now let’s look at how much actually gets used.

Plantains


For the full query, the memory grant is 9.4GB, but only 380MB gets used. That seems bad to be.

o no.

Now, to be fair, the nice people at Microsoft are attempting to right these wrongs. In SQL Server 2017 we got Memory Grant Feedback, but it was only available for queries with Eau De Batch Mode on.

In SQL Server 2019, it’s available to Row Mode plans. Of course, that’s only in Enterprise Edition. If you’re on Standard Edition, you’re screwed :^)

So for all you screwed folks out there, which is most of you, you might have queries constantly asking for way more memory than they need. In this case, the query asks for about 9.1GB of memory more than it needs.

“Just Select Less”


Well, okay. What if we don’t select that MAX column? All your tables are well-designed, no one has used longer string columns than they should have, and none of your queries select a bunch of columns they don’t need.

SELECT *
FROM 
     (  
        SELECT TOP (1000) 
                 u.Id          -- 166MB (INT)
               , u.DisplayName -- 300MB (NVARCHAR 40)
               , u.WebsiteUrl  -- 900MB (NVARCHAR 200)
               , u.Location    -- 1.3GB (NVARCHAR 100)
        FROM dbo.Users AS u
        ORDER BY u.Reputation
     ) AS u
OPTION(MAXDOP 1, RECOMPILE);

We’ll still ask for 1.3GB of memory, and only use a fraction of it.

just great

What’s interesting is that in total we only use about 100MB less memory without the AboutMe column in there, despite asking for about 8GB less memory.

Reducing Memory Grants


There are a number of ways to help mitigate queries asking for too much memory, but they all depend on what the root cause of the issue is.

  • You might have overly large columns, or queries that do something like select * — you might be able to fix that by rewriting queries. Given enough control, you should resize columns to be a more appropriate size, too.
  • You might be dealing with parameter sniffing, which has a whole bunch of different approaches which will require their own decades of research, ha ha ha.
  • You might be missing an opportune index that could help you avoid a sort, or help the optimizer choose a non-hash join or aggregate.
  • You might be asking queries to put data in order when it’s not necessary
  • You might be using some unfortunate “feature” that messes up cardinality estimation
  • You might be dealing with out of date statistics
  • You might need to apply a query hint to control the size of the grant
  • You might need to use Resource Governor to control the size of memory grants

Of course, all this effort depends on how severe your problems are.

A good way to judge if queries are trampling on each other is to look at resource semaphore waits. That’s queries waiting to get memory to run.

Another might be to look at PAGEIOLATCH_XX waits to see how much time you’re spending reading pages from disk. It’s possible that excessive query memory grants are forcing data out of the buffer pool.

Thanks for reading!

Going Further


If this is the kind of SQL Server stuff you love learning about, you’ll love my training. I’m offering a 75% discount to my blog readers if you click from here. I’m also available for consulting if you just don’t have time for that and need to solve performance problems quickly.

Starting SQL: Things SQL Server Query Plans Might Tell You

The Fox


Interpreting query plans and problems has gotten a lot easier over the years. Especially with more actuals getting added to actual plans. A lot of the ambiguity about where time and effort was spent in a query plan is gone.

Taking the guesswork out of performance tuning is awesome! The faster I can tune a query for someone, the better. And boy howdy, sometimes I get some awfully big query plans to look at.

But once you know what was slow, what do you do with it? How do you make it not slow?

The Hound


There are the “obvious” things, which we’ve talked about earlier in the series. They’re a good place to start.

There’s other stuff too, which we’ll talk about in detail next week. Normally I’d feel like a broken record, but having all of my fundamentals stuff in one set of posts seems like a reasonable idea. I think that’s the point of all this, anyway.

It’s stuff that isn’t surprising, if you’ve been around the block a little tuning queries. But T-SQL anti-patterns are like a bad haircut. Sometimes you don’t believe you have one until someone tells you.

A lot of the time I spend with clients is showing them how seemingly harmless choices are wrecking performance. Someone a long time ago read about this ~great new feature~ and used it everywhere and now the whole show is slumping towards catastrophe.

Thousand Dollars


This is another place where actual plans tell you way more than estimated or cached plans, but if you know enough about what to look for in a query plan you can find The Usual Suspects for performance issues.

You see, there are some things that nearly guarantee you’ll get one of those “bad estimates” that people blame things on before rebuilding every index in sight.

But all the rebuilt indexes in the world won’t fix these anti-patterns, because most performance problems aren’t because your data pages are a little out of order.

So what might your query plans tell you?

  • If you got a huge memory grant
  • If your query was forced to run serially
  • If you have missing indexes
  • If you have missing-missing indexes
  • If you have very sneaky missing indexes
  • If there was an icky function in your query
  • If there’s a table variable hanging about
  • If there’s implicit conversions
  • If there’s inappropriate scans

And that’s just the estimated plan! With actual plans, you get even more detail. On top of stuff we’ve already talked about, like operator times and wait stats, you can also see if your memory grant got used, spills, and other important details.

Thanks for reading!

Going Further


If this is the kind of SQL Server stuff you love learning about, you’ll love my training. I’m offering a 75% discount to my blog readers if you click from here. I’m also available for consulting if you just don’t have time for that and need to solve performance problems quickly.

Starting SQL: Things SQL Server Query Plans Can’t Tell You (But Should)

Hidey-Hole


When you’re looking at the execution plan for a query that someone is griping about, one thing to keep in mind is that it’s just part of the picture. There’s a lot of things that a query plan can’t tell you about the state of the server surrounding the query.

Query plans are, rightly, quite focused on the query at hand. If every query plan sucked in a bunch of other information, it’d be a nightmare.

I do think that actual execution plans should have blocking warnings, in the same way that we have spill warnings on some operators. Or at the very least, blocking waits should register in the wait stats that query plans collect.

Action Plan


We know we can’t see blocking in execution plans, which wouldn’t make a lot of sense at all to show in cached plans. If they’re only blocked sometimes, the value of that kind of feedback diminishes.

You can sometimes figure that out by comparing CPU and duration — if CPU is far less than duration, it could be a blocking problem.

Just like blocking, it’s nearly impossible to tell if a query was slow because the server was all manner of fiery catastrophe just by looking at the execution plan.

A lot of people will jump right to parameter sniffing when a query is sometimes slow, completely discounting other things that go bump in the night. While query plans can tell us a great story, they often can’t tell us a full story.

Going back to something we talked about much earlier in the series: We need to make sure we have the right information to solve the right problem. This is, again, where having a good monitoring tool is indispensable.

What It Is, It Is


We already spent a few days talking about some wait stats, and some things you might be able to do to compensate for them.

Any sporadic performance issue can be a tough nut to crack, and not every symptom is going to be obvious in the places you might first look.

They might not show up as in wait stats, because they’re not happening constantly. They might not show up in query plans because it’s not the fault of the query.

It’s an important thing to keep in mind, though, to not get too rabbit-holed looking at the wrong thing.

Thanks for reading!

Going Further


If this is the kind of SQL Server stuff you love learning about, you’ll love my training. I’m offering a 75% discount to my blog readers if you click from here. I’m also available for consulting if you just don’t have time for that and need to solve performance problems quickly.

Starting SQL: Actual Plans Are Important For SQL Server Performance Tuning

No, Really


Estimated plans are like giving someone driving directions. You might know an awesome way to get somewhere, but you don’t know that a truck full of beer crashed into a truck full of monkeys. And though there were no fatalities, the street scene is not one that encourages forward progress.

That’s a lot like what happens to the optimizer. Sometimes it comes up with a good route for Tuesday at noon, but now you gotta make the trip Friday at 5:30. Actual plans can help you identify where things backfired in a way that cached and estimated plans usually can’t.

Really, No


Here’s an example I love using in my training classes. If you saw this in a code review, you might just skip right past it.

SELECT TOP (10)  
    u.DisplayName,
    p.*
FROM dbo.Posts AS p
JOIN dbo.Users AS u
    ON p.OwnerUserId = u.Id
WHERE p.ParentId = @ParentId
ORDER BY u.Reputation DESC;

But queries like this terrify experienced query tuners:

  • Do we really need everything from Posts?
  • Do we have a good index on Posts for the where clause and join?
  • Is the ParentId column a highly skewed data set?
  • Is there an index on Users to avoid needing to Sort by Reputation?

Under the right circumstances, even the simplest queries can backfire. This is a great example of that.

Indecent Deeds


Query plans can spend a lot of time lying to you. It takes a while to develop an eye for those lies, and figuring out where things went wrong in estimated or cached plans. Actual plans will tell you the truth about most things.

invisible touch

Of course, getting cached or estimated plans is often better than not getting anything at all. But imagine someone sending you this and saying it’s really slow. What would you say? What would you ask for next?

here to baffle you

All you have are estimates. Seeks and estimates.

Go Crazy


You could even get the parameter from the properties, and see if the estimate lines up.

SQL Server Query
maybe we don’t need to update stats.

Eyeballs


Different types of plans provide different levels of information. Identifying bad plan choices in Estimated plans is certainly more difficult, but not impossible with enough practice.

Understanding those poor choices and fixing them is what we’re here to do, of course.

The more estimated plans you look at, the more suspicious you become of every operator and choice, and realize that operator costs are often not well-aligned with reality.

Many query tuning efforts start with Estimated plans, and end with Actual plans.

Why? Because we get lied to enough.

SQL Server Query Plan
honesty.

Thanks for reading!

Going Further


If this is the kind of SQL Server stuff you love learning about, you’ll love my training. I’m offering a 75% discount to my blog readers if you click from here. I’m also available for consulting if you just don’t have time for that and need to solve performance problems quickly.

Starting SQL: What’s So Great About SQL Server Query Plans, Anyway?

In The Dark


All query plans are based on estimates. The best we can hope for is that the estimates were good enough to get a good plan.

When you get an “actual plan”, all of the estimated metrics remain, but you also get the runtime metrics. Often query tuning is checking that those things lined up reasonably well.

As of now, there’s nothing that updates cached plan estimates after execution; there’s no runtime information added to them. Also notable is are the estimated metrics that don’t have “actual” counterparts, like operator costs.

Live Nude Plans


Microsoft has been adding some cool stuff to query plans, but actual plans are the recipients of most of it.

  • Wait stats
  • I/O Stats
  • Memory Grants
  • Spills
  • Thread usage
  • Operator Times
  • Statistics used
  • Row goals

What a list! You can do a whole lot of figuring out with a list like that accompanying such pretty drawings of what your queries did. And yet, we often need to get metrics about queries from other sources.

Jingling


SQL Server will keep lots of metrics about cached plans around to help you figure out where queries fall on the pain-causing scale. But the plan cache is an unreliable place, at times.

The plan cache can get wiped out for many reasons, like memory pressure, settings changes, running naughty DBCC commands, and of course restarting SQL Server.

The plan cache can also be difficult to interpret, because of recompilations and compilations. Recompilations kind of cover up a query’s trail, and compilations mean you could have the same query plan over and over again, but it’s not getting reused.

Both of those situations can make getting a clear picture of what a query has been doing over time.

Enter the Query Store. Though not a replacement for the plan cache, Query Store can be a quite helpful tool for finding performance issues. Especially on SQL Server 2017+ where high-level wait stats are also logged. Being able to tie queries to waits is pretty awesome.

Rubber, Glue, Flaming Pants


Another problem with execution plans is how they can lie to you, both by obfuscation and omission.

With all the detail involved in an execution plan, there are still some key data points missing from the estimated versions. That’s why we need stuff like DMVs and Query Store to act as additional sources of truth for what a query has been up to.

And even with all that, understanding query performance issues can still be tough.

Let’s spend some time learning how to figure out where your queries, and query plans, are going wrong.

Thanks for reading!

Going Further


If this is the kind of SQL Server stuff you love learning about, you’ll love my training. I’m offering a 75% discount to my blog readers if you click from here. I’m also available for consulting if you just don’t have time for that and need to solve performance problems quickly.

Starting SQL: Compensating For Lock Waits In SQL Server

No, Lock


Locks are necessary, I’m told. There’s this whole “ACID” thing that makes databases work. It’s generally a good idea for people who into correct answers.

But blocking is one of the most common performance problems I see. Why? Because a long time ago Microsoft made the silly choice to use a pessimistic isolation level by default.

That changes in Azure SQL DB, but what it means for everyone else is that when modification queries come trotting along with their incessant need to lock things, other queries that might want to work with that data have to wait.

For other write queries, that’s a totally acceptable scenario. For queries that need to read data, it’s not cool at all.

In Your Area


Other database platforms use an optimistic isolation level, often called multi-version concurrency control (MVCC).

Under those implementations, queries that need to read data currently being modified will read the previously committed version. Think of it as reading the last known good version of the data.

You can do that in SQL Server using Read Committed Snapshot Isolation (RCSI), or Snapshot Isolation (SI). I don’t want you to think it doesn’t exist — it totally does — it’s just not the default. You have to turn it on.

There are interesting differences between the two, which you can read about here. The biggest general difference is that when you turn on RCSI, all read queries will start using it unless your request asks for a different one. You can do that in a connection string, by setting the transaction isolation level, or using table hints in the query (like NOLOCK).

Overall, this is my favorite way to compensate for locking waits. Sure, you’ll still have blocking for write queries, but your read queries will have a much easier time of things.

Writes vs Writes


When you need to get write queries to cooperate, there are some general steps you can take.

  • Get rid of under-used indexes
  • Batch modifications into smaller chunks
  • Tune the modification queries to be as fast as possible
  • Make sure your modification queries have the right indexes
  • Don’t do goofy things with triggers and foreign keys (especially cascading ones)
  • Only use Change Tracking or Change Data Capture if you really need to

Is this stuff covered in glory? No, not usually. But it’s taking care of the little stuff along the way that makes life easier as your database and userbase grows.

  • Cleaning up poorly utilized indexes will give you fewer objects to lock when queries need to modify data.
  • Batching modification queries gives you a more reliable number of locks, and is kinder on your transaction log
  • Tuning modification queries to get rid of inefficiencies will give you shorter locking durations
  • Giving update and delete queries good indexes to find rows of interest will do the same
  • Not making SQL Server do extra work as data changes gives you fewer side effects to worry about

We’ve covered a lot of ground this month, and I hope you’ve been enjoying it. The last thing we have to talk about is query plans, which is going to help us start tying a lot of stuff together.

Thanks for reading!

Going Further


If this is the kind of SQL Server stuff you love learning about, you’ll love my training. I’m offering a 75% discount to my blog readers if you click from here. I’m also available for consulting if you just don’t have time for that and need to solve performance problems quickly.