Different Index Build Strategies For SQL Server

Link Up


This post is links to a series of articles that it’s a shame more people haven’t seen, because they describe why some index builds/rebuilds take a lot longer than others.

Hopefully Microsoft doesn’t black hole these, as they have so much other valuable material recently.

Thanks for reading!

Going Further


If this is the kind of SQL Server stuff you love learning about, you’ll love my training. I’m offering a 75% discount to my blog readers if you click from here. I’m also available for consulting if you just don’t have time for that and need to solve performance problems quickly.
My SQL Server Query Ran For A Long Time But Didn’t Use A Lot Of CPU: What Happened?

Of Walls And Clocks


No one ever says a broken record is right twice a day, perhaps because DJs are far more replaceable than clock makers.

I say that only to acknowledge that I may sound like a broken record when I say that when you’re tuning a query, it’s quite important to compare wall clock time and duration. Things you should note:

  • If CPU and duration were about equal in a serial plan, that’s normal
  • If CPU is much higher than duration in a parallel plan, that’s normal
  • If duration and CPU are about equal in a parallel plan, you’ve got yourself a situation
  • If duration is much higher than CPU in any plan, something else held your query up

In this post, I’m going to outline a non-exhaustive list of reasons why that last bullet point just might be.

Hammer Time


Big Data: One common reason you may run into is that you’re returning a large result set, either locally to SSMS, or to an app server that is either overloaded or underpowered. It’s also possible that something is happening on the application side that’s slowing things down. In these cases, you’ll usually see a lot of ASYNC_NETWORK_IO waits. To better test the speed of the actual query, you can dump the results into a #temp table.

Blocking: Another quite common issue is that the query you’re running is getting blocked. Before you go reaching for that NOLOCK hint, make sure you know what it does. Blocking is each to check on with sp_WhoIsActive. If you see your query waiting on waits that start with LCK_ Some common ones are LCK_M_SCH_S, LCK_M_SCH_M, LCK_M_S, LCK_M_U, LCK_M_X, LCK_M_IS, LCK_M_IU, LCK_M_IX. While your query is being blocked, it’s just gonna rack up wall clock time, while using zero CPU.

Stats updates: Once in a while I’ll run into a query that runs slowly the first time and fast the second time because behind the scenes the query had to wait on stats to update. It’s a bit hard to figure out unless you’re on SQL Server 2019, but it can totally make your query look like you sat around doing nothing for a chunk of time, especially if you’re waiting on large tables, or a bunch of smaller updates.

Reading from disk: If the tables or indexes you’re reading are bigger than your buffer pool, your queries are gonna eat it going to disk to read data in. If this is your limitation, you’ll see a lot of PAGIOLATCH_SH or PAGEIOLATCH_EX waits, depending on if your query is reading data, writing data, or both.

Waiting for a worker thread: When your queries can’t get a worker thread to run on, they end up waiting on THREADPOOL. While some waits on it are to be expected, you don’t want queries to wait long periods of time on this. It’s a serious sign your server is jammed way up.

Waiting for memory: When your queries can’t get the memory grant they want, they sit around waiting on RESOURCE_SEMAPHORE. Just like above, it’s a sure sign your server is having problems if it’s a wait you see occurring a lot, or for long average periods of time.

Waiting for a query plan: I know, this sounds like a long compilation time — and it sort of is — but only because the query is waiting a long time to get memory to compile an execution plan. This wait is going to be RESOURCE_SEMAPHORE_QUERY_COMPILE, instead.

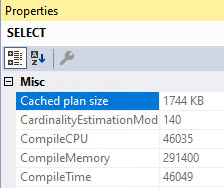
Query Plan Compilation: Sometimes the optimizer gets a bit carried away and spend a whole bunch of time in search2 trying to reorder joins, and do other tricks to make your query faster. Under extreme circumstances, you might wait a really long time for that query plan. There’s no wait stats to tell you that, but if you look at your query plan’s properties (F4 key on the root operator), you can see the compile time.

SQL Server Query Plan
yeesh.

Thanks for reading!

Going Further


If this is the kind of SQL Server stuff you love learning about, you’ll love my training. I’m offering a 75% discount to my blog readers if you click from here. I’m also available for consulting if you just don’t have time for that and need to solve performance problems quickly.
What’s The Best Statistics Sample Rate For SQL Server?

Big Think


Most people fire off their index and statistics maintenance jobs with the default options and do just fine. Sometimes, though, statistics need a little bit more consideration, and I get a lot of questions about them.

  • Do I need to use a sampling rate other than the default?
  • Do I need to use FULLSCAN?
  • What if auto update stats ruins my good statistics?
  • Should I update statistics asynchronously?
  • Are there easy ways to tell if my statistics are causing problems?

There are a lot of local factors involved in answering these questions, and I can’t cover all of them in this post, but I can outline some general patterns I see when people have these concerns.

Is The Default Sampling Rate Good Enough?


Look — usually it is — I know you hate to hear it. You want to be that special edge case where it’s not. Moreover, it’s really efficient.

The tradeoff you make between higher sampling rates and better statistics and time it takes to update stats can be significant, especially on larger tables. And a lot of the time, those 201 histogram steps don’t end up a whole lot more informing than before.

I’m not saying never, but in particular the difference between 75% and 100% scans is kinda ?‍♂️

Do I Need A Full Scan?


If you’re at the point where you’re asking this question, you’re in one of two situations:

  • You’re just starting out with stats updates
  • You’re unhappy with the way your stats look now

If you’re just starting out, stop right here and just make sure you’re keeping them updated regularly.

If you’re unhappy with the way they look because of the way updates — manual or automatic — are going now, you might want to think about creating filtered statistics on the parts of the data that aren’t well-reflected by them.

Is Auto Update Stats Bad?


No, not usually. It can be quite helpful. Especially on supported versions of SQL Server where trace flag 2371 is the default behavior, it doesn’t take as many modifications for them to happen on large tables.

This can better help you avoid the ascending key problem that used to really hurt query plans, where off-histogram values got some really bad estimates. That’s somewhat addressed in higher compat levels, but I’ve still seen some wonkiness.

If you don’t want auto update stats to ruin your higher sampling rates, you probably wanna use the PERSIST_SAMPLE_PERCENT option, with your chosen value.

But again, you wanna be careful with this on big tables, and this is when you might also wanna use…

Asynchronous Stats Updates


This setting can be really useful for avoiding long running queries while waiting for updated stat histograms to be available. The downside is that you might hit some woof query plans until the background task does its thing and the plans get invalidated.

Make sure you’re solving the right problem by flipping this switch. SQL Server 2019 can help you figure out if this is something you’re hitting regularly, with the WAIT_ON_SYNC_STATISTICS_REFRESH wait type. Keep in mind this only shows up when stats are refreshed. Not when they’re created initially.

You can also see stuff like this crop up in monitoring tools and query store when queries take a while, but they’re doing stuff like SELECT StatMan.

Are Statistics My Problem?


I see a lot of people blaming statistics, when they’re really doing other stuff wrong.

There are many ways to write a query that are equivalent to the Calvin Peeing™ decal, with cardinality estimation being on the receiving end, like eschewing SARGability, or using local variables or table variables.

Another common issue is around cached plans and parameter sniffing. Those inaccurate guesses might have been really accurate for the compiled parameters, but not for the runtime parameters.

There are a lot of query hints that can help you figure out if statistics are the problem, or if there’s something in the cardinality estimation process that’s yucking things up.

  • ASSUME_JOIN_PREDICATE_DEPENDS_ON_FILTERS
  • ASSUME_MIN_SELECTIVITY_FOR_FILTER_ESTIMATES
  • ENABLE_HIST_AMENDMENT_FOR_ASC_KEYS
  • FORCE_LEGACY_CARDINALITY_ESTIMATION
  • FORCE_DEFAULT_CARDINALITY_ESTIMATION

I use this pretty regularly to see if they end up giving me a better plan. They don’t always pan out, but it’s worth trying when what you get ain’t what you want.

Just remember that things like query complexity will have a lot to do with how accurate the estimates you get are. Chaining together a bunch of CTEs, derived tables, views, or 20 joins usually isn’t gonna end up well for you, or your query plan.

There are many times when I see people complaining that statistics are bad or out of date, and basic stuff like proper indexes aren’t there.

Thanks for reading!

Going Further


If this is the kind of SQL Server stuff you love learning about, you’ll love my training. I’m offering a 75% discount to my blog readers if you click from here. I’m also available for consulting if you just don’t have time for that and need to solve performance problems quickly.

UDF Inlining And String Aggregations In SQL Server 2019

Quatro Enemigos


This post is really four different posts. Maybe five. The main points are:

Let’s start at the top, because tops are top.

Strung Out


If you’re like me and you got excited by the induction of STRING_AGG into the T-SQL Lexicon because of all the code odd-balling it would replace, you were likely also promptly disappointed for a few reasons.

  • Needing to convert the element to be AGGed to a MAX to avoid errors
    • STRING_AGG aggregation result exceeded the limit of 8000 bytes. Use LOB types to avoid result truncation
  • The WITHIN GROUP ordering is clunky compared to an outer ORDER BY (but hey, logical query processing…)
  • No support for DISTINCT in the function, and an outer DISTINCT tries to make the wrong thing DISTINCT (see above)

And of course, it’s a breaking limitation for UDF inlining.

The UDF does not reference the STRING_AGG function

Let’s look at all of that stuff at once, in one function.

CREATE OR ALTER FUNCTION 
    dbo.IsStringAgg (@UserId int)
RETURNS 
    nvarchar(max)
WITH 
    RETURNS NULL ON NULL INPUT, 
    SCHEMABINDING
AS
BEGIN
RETURN
(
    SELECT
        STRING_AGG
        (
            CONVERT
            (
                nvarchar(MAX),
                b2.Name
            ), 
            N', '
        )
        WITHIN GROUP 
        (
            ORDER BY 
                b2.Name
        )
    FROM
    (
        SELECT DISTINCT 
            b.Name
        FROM dbo.Badges AS b
        WHERE b.UserId = @UserId
    ) AS b2
);
END;
GO

Not exactly  a thing of beauty, is it? Let’s hold onto that for one second, though.

XML > JSON


Okay, so let’s get back to that UDF documentation.

The UDF does not reference XML methods

That sort of reads like NOXML4U, which is my friend Jeremiah’s license plate. In reality though, it means all the .method thingies, like value, node, query, etc.

So if you were to try to follow my prior advice on string concatenation, the function couldn’t be inlined.

SELECT
   x = 
   (
       SELECT 
           [text()] = 
               b.Name
       FROM dbo.Badges AS b
       WHERE b.Id = 100564
       FOR XML 
           PATH(''),
           TYPE
   ).value
     (
         './text()[1]', 
         'nvarchar(max)'
     );

Having the .value breaks inlining. So there’s that. I believe this is where Reddit users post something like le sigh with some poorly drawn stick figure.

Del The Funktion


We can write the function semi-correctly like so:

CREATE OR ALTER FUNCTION 
    dbo.NotStringAgg (@UserId int)
RETURNS 
    nvarchar(max)
WITH 
    RETURNS NULL ON NULL INPUT, 
    SCHEMABINDING
AS
BEGIN
RETURN
    STUFF
    (
        (
            SELECT
                N', ' + 
                b.Name
            FROM dbo.Badges AS b
            WHERE b.UserId = @UserId
            GROUP BY b.Name
            ORDER BY b.Name
            FOR XML PATH (N'')
        ), 
        1,
        2,
        N''
    );
END;
GO

Alright, now let’s BRING THAT CODE BACK (air horn)

Sea Vessel Soliloquy


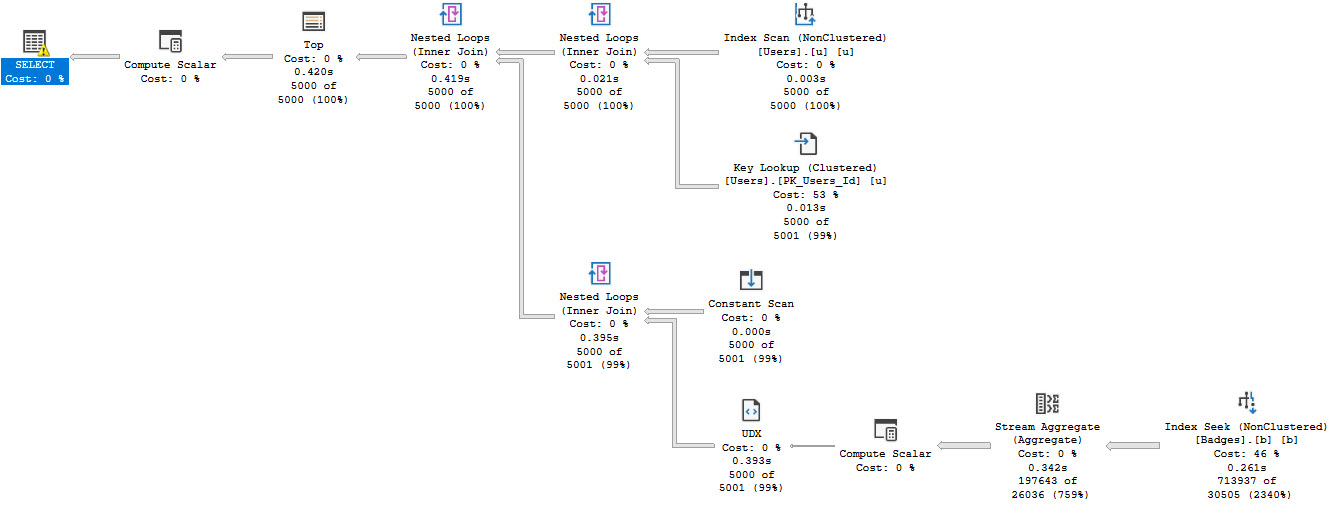
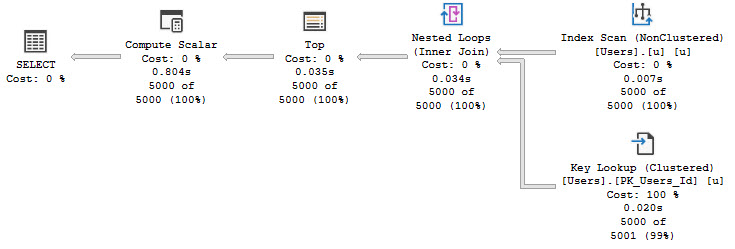
If we compare the execution plans for these two functions, the XML one gets inlined, and the STRING_AGG one does not.

SELECT TOP (5000)
    u.DisplayName,
    ThanksForAllYourHardWork = 
        dbo.NotStringAgg(u.Id)
FROM dbo.Users AS u
ORDER BY u.Reputation DESC;
GO 

SELECT TOP (5000)
    u.DisplayName,
    ThanksForAllYourHardWork = 
        dbo.IsStringAgg(u.Id)
FROM dbo.Users AS u
ORDER BY u.Reputation DESC;
GO

Here’s the plan for the inlined function:

SQL Server Query Plan
blaze it

Here’s the plan for the non-inlined function:

SQL Server Query Plan
thin ice

Stay Thirsty


The inlined function finishes about twice as fast, though one may pause for a moment to consider whether the 400ms difference is an earth shattering kaboom in this case.

Of course, the real kicker is when scalar UDFs are invoked as part of larger queries where parallelism, etc. is important.

Thanks for reading!

Going Further


If this is the kind of SQL Server stuff you love learning about, you’ll love my training. I’m offering a 75% discount to my blog readers if you click from here. I’m also available for consulting if you just don’t have time for that and need to solve performance problems quickly.

It’s Not Just You: Blocked Process And Deadlock XML Is Misleading

Lucky Pencil


There you sit, an earnest database glob. Users are complaining that the database is slow again, but this time you’re ready for it.

You’ve got a monitoring tool collecting all the right things from all the right places, and it’s telling you that there’s blocking going on.

All those poor queries suffering under the tyrannical yolk of Read Committed The Garbage Isolation Level, yearning for the freedom of Read Committed Snapshot Isolation.

But when you crack open the blocked process report, it makes absolutely no sense at all.

Not one bit.

All Wrong


To show you an example of how bad these things are at collecting the actual problem, I’m going to use the code examples in this blog post about Implicit Transactions, which are horrible and you shouldn’t use them or the JDBC driver.

I mean you should always use them and call me when you need help fixing your horrible blocking problems. My rates are reasonable.

Anyway, when you look at the Blocked Process Report for that code, here’s all the stuff that’ll look screwy:

First, the object and index IDs will both have 0 for a value:

<data name="object_id">
  <type name="int32" package="package0" />
  <value>0</value>
</data>
<data name="index_id">
  <type name="uint32" package="package0" />
  <value>0</value>

Second, the lock mode will say S, which is possible when readers block writers, but…

<data name="lock_mode">
  <type name="lock_mode" package="sqlserver" />
  <value>3</value>
  <text>S</text>

Third, the statements that will be shown as blocking each other are both selects from different tables.

Blocked:

<inputbuf>
SELECT TOP (100)
    p.*
FROM dbo.Posts AS p
WHERE p.ParentId = 0
ORDER BY p.Score DESC;   
</inputbuf>

Blocking:

<inputbuf>
SELECT TOP (10000)
    u.*
FROM dbo.Users AS u
WHERE u.Reputation = 2
ORDER BY u.Reputation DESC;   
</inputbuf>

What Can You Do?


Not a whole lot. This stuff is just plain broken outside of very simple blocking and deadlocking patterns.

Monitoring tools that rely on these things to show you issues are going to bring back really confusing details.

You might think it would just be a matter of decoding the wait resource, but that’s a doggone annoying process on its own.

Thanks for reading!

Why Reporting Tables Aren’t A Great Idea In SQL Server Databases

Headway


I’ve seen a lot of crazy ways for people to run reports on live data, but one of the worst ideas is creating a reporting table based on the set of data a user wants, and then letting them query that data.

Here’s why:

  • You still have to run the query to populate them, which hits the server with load you’re adverse to
  • The buffer pool gets taken up by all these reporting tables, which only one person uses
  • It’s hard to index the reporting tables, and column store isn’t useful on Standard Edition
  • They get stale quickly, and refreshing them means re-running the original query, or
  • A dynamic Merge statement, because no two tables will have the same columns
  • Generic reporting tables will often use the wrong data types for columns and be very wide

Put all that together, and you’ve got a pretty bad solution for your server and your users.

Money Talks


I’m gonna say that there are better ways to do this, and I’m gonna be right, but they’re all gonna take work and/or money.

The ones that take money are reporting off a copy of the data, which you can do with Availability Groups, Replication, or Log Shipping. You have to fully license the other server that you’re reading from no matter which you choose.

I have no interest in deep-diving into any one of those here, but I’m gonna generalize a little bit to make sure you’re not totally in the dark:

  • Availability Groups are easy to set up, sometimes complicated to manage and patch, and require databases in full recovery model, but give you pretty up-to-date data on the secondary for users to get at.
  • Replication is a lot like the above, except it makes me way more nervous. Snapshot Replication gets bonus points for allowing you to create different indexes on the subscriber, which AGs and Log Shipping don’t let you do. The freshness of the data does depend on which type of Replication you choose, so choose wisely.
  • Log Shipping just ships transaction log backups, which is pretty dead simple unless you need to deal with servers that can’t directly see each other for whatever reason. Simple is nice, but simple means you’re gonna have to stale data, since you have to kick users out to restore more transaction logs.

Manifesto


The solutions that require work are usually ones that you implement locally. I’m not going to talk about data warehouses here, because it’s a lot like the stuff up there, just with ETL in the middle. Or ELT. Whatever.

Getting reporting working from live data usually takes a few steps, depending on your situation:

  • Nonclustered column store indexes if you’re on Enterprise Edition
  • Indexed views if you’re on Standard Edition (I’ll talk more about this in a minute)
  • Enabling snapshot isolation just for reporting queries to not get blocked
  • Tuning the hell out of your report code to not beat the server up too bad

Indexed views have a lot of rules, and if you’re lucky you can get some mileage out of them to speed up aggregations on Standard Edition. You can try using column store, but it’s really severely hobbled on Standard Edition. The DOP two limit is especially a killer in a lot of cases.

All of this is work though, and it at least partially assumes your server can come anywhere near being able to handle the additional workload. If it’s just limping along now, you probably don’t wanna keep throwing straw at Joe Camel.

Out There


What I left out a little bit are tables that everyone can report from, because every time I’ve seen them implemented, it’s been an absolute mess of triggers or periodic data synchronizations that left users unhappy.

Either because their transactional workload slowed way down to keep things up to date synchronously, or because the background process that started out running every 10 minutes beat the crap out of the server every 10 minutes, so now it runs every hour but there’s another Agent job to kill that job if it runs more than five minutes because that means something bad is about to happen.

This is why most of the time, I’m happy to do the work to report off the live data.

Thanks for reading!

Going Further


If this is the kind of SQL Server stuff you love learning about, you’ll love my training. I’m offering a 75% discount to my blog readers if you click from here. I’m also available for consulting if you just don’t have time for that and need to solve performance problems quickly.

Measuring Logical And Physical Reads In SQL Server Queries

In Process


One question I get quite a bit is how much I look queries that do a lot of logical reads, and the answer is: not very often.

The primary metric that I look at is CPU, both total and average. If you look at that, you’ll most likely also find the type of queries that do a lot of reads because they’re missing a better index somewhere along the way

If queries run really fast, I don’t really care what they’re doing for logical reads, which are all from pages in memory anyway.

It may be useful to look at in parameter sniffing scenarios, because a query might sometimes do a lot of reads, and sometimes not. But at the same time, that query will also sometimes use a lot of CPU, and sometimes not.

And uh, no, I don’t look at it as a sign that I have to defragment indexes. At least not based on what index maintenance scripts measure.

Phys Ed


Queries — and servers in general — that have a high number of physical reads are a different story.

Looking at these, sure, you might find queries that are missing an index, but most likely what you’re going to find is a server that’s a bit malnourished in the RAM department. Physical reads come from disk, and if your queries are constantly piling these up, then you’re gonna have some stuff to look at.

  • Do you have anywhere near enough memory to cache your most frequently accessed objects in memory?
  • Do you have queries coming along asking for enormous memory grants that clear out swaths of the buffer pool?
  • Do you have too many unnecessary indexes competing for space in the buffer pool and knocking each other out?

Figuring that stuff out can be tough, but can be made easier with a good monitoring tool.

Literacy


One thing that will separate servers where queries do a lot of logical reads from servers that do a lot of physical reads is wait stats.

Servers where queries do a lot of reading pages from disk into memory — physical reads — are going to have higher waits on PAGEIOLATCH_SH and PAGEIOLATCH_EX.

Thanks for reading!

Going Further


If this is the kind of SQL Server stuff you love learning about, you’ll love my training. I’m offering a 75% discount to my blog readers if you click from here. I’m also available for consulting if you just don’t have time for that and need to solve performance problems quickly.

How Do I Estimate How Much Memory My SQL Server Needs?

It’s Brand New


If you’re looking to scope out hardware for SQL Server, whether it’s in the cloud, or… not in the cloud, you’re gonna wanna get memory right.

Lots of people complain about SQL Server being a memory hog, without pausing to reflect on the fact that they’re data hogs.

You don’t like SQL Server taking up all that memory? Drop all those big databases.

Problem solved.

Considerate


There are a number of things you can look at on your current server that tie in to how much memory you’ll need in the future:

  • Wait Stats
  • Size of data
  • Current indexing
  • Data growth rate

Waits

I have wait stats there because the first thing you should look at to see if you have adequate memory is PAGEIOLATCH_** waits. If they’re more than 10% of your server’s uptime, you might be losing a whole bunch of query performance to getting the data you need into memory. Of course, from here you need to monitor when those waits are happening to figure out if they’re affecting critical user queries, or just happening overnight during maintenance.

Sizes

The size of your data is going to depend on how big your tables are, and how many indexes you have on them. If you have a lot of unused or duplicative indexes, you’re going to have a much bigger database than is necessary. That’s going to inflate the amount of memory you currently “need”, because all of those cruft indexes are going to be competing for space in the buffer pool.

Indexes

An easy first step to making the best possible use of the RAM you currently have is to make sure you have only the most beneficial indexes in place. Once you’ve got that done, you can go even further by looking at compression. Compressed indexes squish things down on disk and in the buffer pool.

Growths

Some database have predictable growth patterns based on regular usage. It’s up to you to trend that stuff for the most part.

There’s a disk usage report under each database’s standard reports that you can get to with a right click, but it only has growths that are currently in the standard trace file currently. They could be aged out when you go looking for them.

Another idea would be to look at backup sizes over the past year or so to see how they’ve grown.

Other databases are unpredictable based on acquisitions, large customer onboarding, big sales, sudden success, etc.

Of course, if you haven’t tended to indexes or compression like I listed above, these trends may not hold up well compared to after doing them. This is something I’d do last, after taking care of the index stuff.

All This And More


An additional consideration that adds quite a bit of complication is query memory grants.

The difficulty here is twofold, because you may have query and index tuning to do to reduce the memory grants queries ask for, and when memory pressure arises on a server the plan cache (where most people wanna go look for queries asking for large memory grants) will be getting cleared out constantly. That can make tracking them hard.

I know, you’re thinking that Query Store is awesome for this, but it’s not. It only tracks memory that queries used, not what they were granted. A query can ask for a huge memory grant, only use a small fraction of it, and there’s no sign of that in Query Store. Brick and mortar, indeed.

Most people aren’t ready to truly speculate on hardware needs when I talk to them, but they can get there. If you want a basic guess? Try to get enough memory to cache 50-75% of your server’s data in memory. That should get you enough to cache what you need, deal with memory growth, and deal with memory grants.

And you know, you’ll probably wanna pad that a little bit if you’re going to the cloud, where storage gear and networking is basically electric porridge.

Thanks for reading!

Going Further


If this is the kind of SQL Server stuff you love learning about, you’ll love my training. I’m offering a 75% discount to my blog readers if you click from here. I’m also available for consulting if you just don’t have time for that and need to solve performance problems quickly.

Replacing Unique Constraints With Unique Indexes In SQL Server

Wouldja Shouldja?


I do love appropriately applied uniqueness. It can be helpful not just for keeping bad data out, but also help the optimizer reason about how many rows might qualify when you join or filter on that data.

The thing is, I disagree a little bit with how most people set them up, which is by creating a unique constraint.

Unique constraints are backed by nonclustered indexes, but they’re far more limited in what you can do with them.

For example, you can’t apply a filter definition, or have any included columns in them. And a lot of the time, those things make the data you’re identifying as unique more useful.

Included Battery


Here’s what I see quite a bit: A unique constraint on a single key column, and then a nonclustered index on that column, plus included columns.

So now you have two indexes on that column, only one of them is unique, and only of them gets used in queries as a data source.

The unique constraint may still get used for cardinality estimation, but the structure itself just sits around absorbing writes all the live long day.

In this case, you’re almost always better off using a unique nonclustered index with includes instead.

Sure, this doesn’t work if you have one column that needs to be unique, but you want multiple columns in the key of a nonclustered index, but that’s not what I’m talking about here.

Feelings Filter


That you can add a where clause to indexes is still news to some people, and that’s fine.

Often they’re used to isolate and index certain portions of your data that are frequently accessed, or that benefit from having a statistics histogram built specifically on and for them, which don’t have any of their 201 steps tainted or influenced by data outside of the filter.

The latter scenario is good for skewed or lumpy data that isn’t accurately depicted in a histogram on a full (probably rather large table) even with a full scan.

But another good use is filtering data down to just the portion of unique data that you care about. An example is if your table has multiple rows for a user’s sessions, but only one session can be active. Having a unique filtered index on users, filtered to just what’s active, can get you down to just the stuff you care about faster.

Clean Up


If you ever run sp_BlitzIndex and see duplicate or borderline duplicate indexes, some of them may be on unique constraints or indexes.

Don’t be afraid to merge semantically equivalent constraints or indexes together. Just be sure to obey the rules of key column order, and all that.

Thanks for reading!

Going Further


If this is the kind of SQL Server stuff you love learning about, you’ll love my training. I’m offering a 75% discount to my blog readers if you click from here. I’m also available for consulting if you just don’t have time for that and need to solve performance problems quickly.

Steps For Getting Rid Of NOLOCK Hints In SQL Server Queries

Way Out


Whenever I see people using NOLOCK hints, I try to point out that they’re not a great idea, for various reasons explained in detail all across the internet.

At minimum, I want them to understand that the hint name is the same as setting the entire transaction isolation level to READ UNCOMMITTED, and that the hint name is quite misleading. It doesn’t mean your query takes no locks, it means your query ignores locks taken by other queries.

That’s how you can end up getting incorrect results.

That warning often comes with a lot of questions about how to fix blocking problems so you can get rid of those hints.

After all, if you get rid of them, your SQL Server queries will (most likely) go back to using the READ COMMITTED isolation level and we all know that read committed is a garbage isolation level, anyway.

Cause and Wrecked


An important thing to understand is why the hint was used in the first place. I’ve worked with some nice developers who slapped it on every query just in case.

There was no blocking or deadlocking. They just always used it, and never stopped.

Not that I blame them; the blocking that can occur under read committed the garbage isolation level is plain stupid, and no respectable database platform should use it as a default.

In many ways, it’s easier for a user to re-run a query and hopefully get the right result and shrug and mumble something about computers being awful, which is also true.

So, first step: ask yourself if there was ever really a blocking problem to begin with.

Bing Tutsby


Next, we need to understand where the blocking was coming from. Under read committed the garbage isolation level, writers can block readers, and readers can block writers.

In most cases though, people have added the hint to all of their queries, even ones that never participated in blocking.

  • If the problem was writers blocking writers, no isolation can help you.
  • If the problem was readers blocking writers, you may need to look at long running queries with Key Lookups

If the problem was writers blocking readers, you’d have to look at a few things:

If you have query store enabled, you can use sp_QuickieStore to search it for queries that do a lot of writes. If you don’t, you can use sp_BlitzCache to search the plan cache for them.

Best Case


Of course, you can avoid all of these problems, except for writers blocking writers, by using an optimistic isolation level like Read Committed Snapshot Isolation or Snapshot Isolation.

In the past, people made a lot of fuss about turning these on, because

  • You may not have tempdb configured correctly
  • You have queue type code that relied on blocking for correctness

But in reasonably new versions of SQL Server, tempdb’s setup is part of the install process, and the wacky trace flags you used to have to turn on are the default behavior.

If you do have code in your application that processes queues and relies on locking to correctly process them, you’re better off using locking hints in that code, and using an optimistic isolation level for the rest of your queries. This may also be true of triggers that are used to enforce referential integrity, which would need READCOMMITTEDLOCK hints.

The reason why they’re a much better choice than using uncommitted isolation levels is because rather than get a bunch of dirty reads from in-flight changes, you read the last known good version of the row before a modification started.

This may not be perfect, but it will prevent the absolute majority of your blocking headaches. It will even prevent deadlocks between readers and writers.

No, Lock


If your code has a lot of either NOLOCK hints or READ UNCOMITTED usage, you should absolutely be worried about incorrect results.

There are much better ways to deal with blocking, and I’ve outlined some of them in this post.

Thanks for reading!

Going Further


If this is the kind of SQL Server stuff you love learning about, you’ll love my training. I’m offering a 75% discount to my blog readers if you click from here. I’m also available for consulting if you just don’t have time for that and need to solve performance problems quickly.