While working with a client, I came up with a query against the SentryOne repository.
The point of it is to find queries that waited more than a second to get a memory grant. I wrote it because this information is logged but not exposed in the GUI yet.
It will show you basic information about the collected query, plus:
How long it ran in seconds
How long it waited for memory in seconds
How long it ran for after it got memory
SELECT HostName,
CPU,
Reads,
Writes,
Duration,
StartTime,
EndTime,
TextData,
TempdbUserKB,
GrantedQueryMemoryKB,
DegreeOfParallelism,
GrantTime,
RequestedMemoryKB,
GrantedMemoryKB,
RequiredMemoryKB,
IdealMemoryKB,
Duration / 1000. AS DurationSeconds,
DATEDIFF(SECOND, StartTime, GrantTime) AS SecondsBetweenQueryStartingAndMemoryGranted,
(Duration - DATEDIFF(MILLISECOND, StartTime, GrantTime)) / 1000. AS HowFastTheQueryRanAfterItGotMemory
FROM PerformanceAnalysisTraceData
WHERE DATEDIFF(SECOND, StartTime, GrantTime) > 1
ORDER BY SecondsBetweenQueryStartingAndMemoryGranted DESC
The results I saw were surprising! Queries that waited 10+ seconds for memory, but finished instantly when they finally got memory.
If you’re a Sentry One user, you may find this helpful. If you find queries waiting a long time for memory, you may want to look at if you’re hitting RESOURCE_SEMAPHORE waits too.
Thanks for reading!
Going Further
If this is the kind of SQL Server stuff you love learning about, you’ll love my training. I’m offering a 75% discount to my blog readers if you click from here. I’m also available for consulting if you just don’t have time for that and need to solve performance problems quickly.
To test FROID, which is the codename for Microsoft’s initiative to inline those awful scalar valued function things that people have been griping about for like 20 years, I like to take functions I’ve seen used in real life and adapt them a bit to work in the Stack Overflow database.
The funny thing is that no matter how many times I see the same function doing the same thing in a different way, someone tells me it’s unrealistic.
Doesn’t matter what it does: Touch data. Not touch data. Do simple formatting. Create a CSV list. Parse a CSV list. Pad data. Remove characters. Proper case names.
“I would never use a function for that.”
Okay, Spanky ?
Too Two!
In CTP 2.2, I had a function that ended up with this query plan:
Tell Moses to get the baseball bat.
The important detail about it is that it runs for 11 seconds in nested loops hell.
Watch Out Now
For reader reference: The non-inlined version runs for about 6 seconds and gets an adaptive join plan.
The plan is forced serial with inlining turned off, naturally.
You’re cool.
I sent the details over to my BESS FRENS at Microsoft, and it looks like it’s been fixed.
To Three!
In CTP 2.3, when we turn on functioning inlining and do the same thing:
ALTER DATABASE SCOPED CONFIGURATION SET TSQL_SCALAR_UDF_INLINING = ON;
Fad Gadget
No more nested loops hell. Now the function gets an adaptive join plan with parallelism, and finishes immediately.
Thanks, frens.
And thanks for reading!
Going Further
If this is the kind of SQL Server stuff you love learning about, you’ll love my training. I’m offering a 75% discount to my blog readers if you click from here. I’m also available for consulting if you just don’t have time for that and need to solve performance problems quickly.
Last week’s thrilling, stunning, flawless episode of whatever-you-wanna-call-it.
Thanks for watching!
Going Further
If this is the kind of SQL Server stuff you love learning about, you’ll love my training. I’m offering a 75% discount to my blog readers if you click from here. I’m also available for consulting if you just don’t have time for that and need to solve performance problems quickly.
There’s a stored procedure called sp_persistent_version_cleanup we can use to clean out PVS data.
There’s some helpful information about it in sp_helptext:
create procedure sys.sp_persistent_version_cleanup
(
@dbname sysname = NULL, -- name of the database.
@scanallpages BIT = NULL -- whether to scan all pages in the database.
)
as
begin
set @dbname = ISNULL(@dbname, DB_NAME())
set @scanallpages = ISNULL(@scanallpages, 0)
declare @returncode int
EXEC @returncode = sys.sp_persistent_version_cleanup_internal @dbname, @scanallpages
return @returncode
end
We can pass in a database name, and if we want to scan all the pages during cleanup.
Unfortunately, those get passed to sp_persistent_version_cleanup_internal, which only throws an error with sp_helptext.
Locking?
While the procedure runs, it generates a wait called PVS_CLEANUP_LOCK.
This doesn’t seem to actually lock the PVS so that other transactions can’t put data in there, though.
While it runs (and boy does it run for a while), I can successfully run other modifications that use PVS, and roll them back instantly.
If we look at the locks it’s taking out using sp_WhoIsActive…
Watching the session with XE also doesn’t reveal locking, but it may be cleverly hidden away from us.
In all, it took about 21 minutes to cleanup the 37MB of data I had in there.
I don’t think this is my fault, either. It’s not like I’m using a clown shoes VM here.
Thanks for reading!
Going Further
If this is the kind of SQL Server stuff you love learning about, you’ll love my training. I’m offering a 75% discount to my blog readers if you click from here. I’m also available for consulting if you just don’t have time for that and need to solve performance problems quickly.
When Query Store rolled out, there were a lot of questions about controlling the size, and placement of it.
To date, there’s still not a way to change where Query Store data ends up, but you can manage the size pretty well.
Of course, there’s a lot more going on there — query text and plan XML heavily inflate the size of things — so there’s naturally more concern.
What About Version Stores?
When talking about traditional row versioning in SQL Server, via Read Committed Snapshot Isolation, or Snapshot Isolation, there’s always a warning to keep an eye on the size of your version store.
Rightfully so, too. They put their data in tempdb, not locally the way the Persistent Version Store does. That means tempdb size can quickly get out of hand with multiple databases storing their Version Store data in there.
Storing the data locally, there’s far less chance of system-wide impact. I wouldn’t say it’s ZERO, depending on where you put your data, but it’s close to it.
Let’s Make Some Indexes
Classics tho
I wanted to make this realistic — and after years of looking at your tables, I know you get rid of indexes at the same rate I get rid of SQL Server books.
So I went ahead and created 20 of them, and made sure they all had a column in common — in this case the Age column in the Users table.
CREATE INDEX [IX_Id_Age_AccountId] ON [dbo].[Users] ([Id], [Age], [AccountId]);
CREATE INDEX [IX_CreationDate_Age_AccountId] ON [dbo].[Users] ([CreationDate], [Age], [AccountId]);
CREATE INDEX [IX_DisplayName_Age_AccountId] ON [dbo].[Users] ([DisplayName], [Age], [AccountId]);
CREATE INDEX [IX_DownVotes_Age_AccountId] ON [dbo].[Users] ([DownVotes], [Age], [AccountId]);
CREATE INDEX [IX_EmailHash_Age_AccountId] ON [dbo].[Users] ([EmailHash], [Age], [AccountId]);
CREATE INDEX [IX_LastAccessDate_Age_AccountId] ON [dbo].[Users] ([LastAccessDate], [Age], [AccountId]);
CREATE INDEX [IX_Location_Age_AccountId] ON [dbo].[Users] ([Location], [Age], [AccountId]);
CREATE INDEX [IX_Reputation_Age_AccountId] ON [dbo].[Users] ([Reputation], [Age], [AccountId]);
CREATE INDEX [IX_UpVotes_Age_AccountId] ON [dbo].[Users] ([UpVotes], [Age], [AccountId]);
CREATE INDEX [IX_Views_Age_AccountId] ON [dbo].[Users] ([Views], [Age], [AccountId]);
CREATE INDEX [IX_WebsiteUrl_Age_AccountId] ON [dbo].[Users] ([WebsiteUrl], [Age], [AccountId]);
CREATE INDEX [IX_Age_CreationDate_AccountId] ON [dbo].[Users] ([Age], [CreationDate], [AccountId]);
CREATE INDEX [IX_Age_DisplayName_AccountId] ON [dbo].[Users] ([Age], [DisplayName], [AccountId]);
CREATE INDEX [IX_Age_DownVotes_AccountId] ON [dbo].[Users] ([Age], [DownVotes], [AccountId]);
CREATE INDEX [IX_Age_EmailHash_AccountId] ON [dbo].[Users] ([Age], [EmailHash], [AccountId]);
CREATE INDEX [IX_Age_Id_AccountId] ON [dbo].[Users] ([Age], [Id], [AccountId]);
CREATE INDEX [IX_Age_LastAccessDate_AccountId] ON [dbo].[Users] ([Age], [LastAccessDate], [AccountId]);
CREATE INDEX [IX_Age_Location_AccountId] ON [dbo].[Users] ([Age], [Location], [AccountId]);
CREATE INDEX [IX_Age_Reputation_AccountId] ON [dbo].[Users] ([Age], [Reputation], [AccountId]);
CREATE INDEX [IX_Age_UpVotes_AccountId] ON [dbo].[Users] ([Age], [UpVotes], [AccountId]);
Now We Need To Modify Them
BEGIN TRAN
UPDATE u
SET u.Age = 100
FROM dbo.Users AS u
WHERE u.Age IS NULL
ROLLBACK
This’ll run for a bit, obviously.
While it runs, we can use this query to look at how big the version store is.
SELECT DB_NAME(database_id) AS database_name,
(persistent_version_store_size_kb / 1024.) AS persistent_version_store_size_mb
FROM sys.dm_tran_persistent_version_store_stats
WHERE persistent_version_store_size_kb > 0;
Not bad.
The only thing is that it stays the same size after we roll that back.
I mean, the ROLLBACK is instant, but cleanup isn’t.
In the next post, we’ll look at forcing cleanup.
Thanks for reading!
Going Further
If this is the kind of SQL Server stuff you love learning about, you’ll love my training. I’m offering a 75% discount to my blog readers if you click from here. I’m also available for consulting if you just don’t have time for that and need to solve performance problems quickly.
There was always this big Wompson & Wompson around rollback, in that it was single threaded. If you had a process get a parallel plan to do some modifications, the rollback could take much longer.
ADR doesn’t solve concurrency issues around multiple modification queries. They both still need the same locks, and other transactions aren’t reading from the Persistent Version Store (PVS from here on out).
But they could. Which would allow for some interesting stuff down the line.
Flashsomething
Oracle has a feature called Flashback that lets you view data as it existed in various points in time. You sort of have this with Temporal Tables now, but not database wide. It’s feasible to think that not only would the PVS let us look at data at previous points in time, but also to restore objects to that point in time.
Yep. Single objects.
AlwaysOptimistic
With PVS up and running, we’ve got row versioning in place.
That means SQL Server could feasibly join the rest of the civil database world by using optimistic locking by default.
It could totally be used in the way that RCSI and SI are used today to let readers and writers (and maybe even writers and writers!) get along peaceably.
Avoidable
Happy Halloween
You know those spool things that I hate? This could be used to make some of them disappear.
The way PVS works now, we have a record of rows modified, which means we’ve effectively spooled those rows out somewhere already.
With those rows recorded, we could skip using spools all together and just read the rows we need to modify from here.
I’m Excited!
This is a very cool step forward for SQL Server.
I mean, aside from the fact that it took 15 minutes to cleanup a 75MB version store.
But still! This is gonna help a lot of people, and has potential to go in a few new directions to really improve the product.
Thanks for reading!
Going Further
If this is the kind of SQL Server stuff you love learning about, you’ll love my training. I’m offering a 75% discount to my blog readers if you click from here. I’m also available for consulting if you just don’t have time for that and need to solve performance problems quickly.
Assume that you use Microsoft SQL Server data warehousing. When you run parallel insert queries to insert data into a clustered columnstore index, the query operation freezes.
To quote one of the Top Men of SQL Server product support:
Hope this helps!
How to freeze your query
Consider a query execution that meets all of the following criteria:
A parallel INSERT INTO… SELECT into a columnstore table is performed
The SELECT part of the query contains a batch mode hash join
The query can’t immediate get a memory grant, hits the 25 second memory grant timeout and executes with required memory
The query may appear to get stuck. It no longer uses CPU and the parallel worker threads appear to wait on each other. Let’s go through an example on SQL Server 2017 RTM. First create all of the following tables:
CREATE PARTITION FUNCTION PART_FUN_REP_SGM(BIGINT)AS RANGE LEFTFOR VALUES (1, 2, 3);CREATE PARTITION SCHEME PART_SCHEME_REP_SGMAS PARTITION PART_FUN_REP_SGMALL TO ( [PRIMARY] );DROP TABLE IF EXISTS dbo.SOURCE_DATA_FOR_CCI;CREATE TABLE dbo.SOURCE_DATA_FOR_CCI (PART_KEY BIGINT NOT NULL,ID BIGINT NOT NULL,FAKE_COLUMN VARCHAR(4000) NULL) ON PART_SCHEME_REP_SGM (PART_KEY);INSERT INTO dbo.SOURCE_DATA_FOR_CCI WITH (TABLOCK)SELECT TOP (1048576) 1, ROW_NUMBER()OVER (ORDER BY (SELECT NULL)) % 16000, NULLFROM master..spt_values t1CROSS JOIN master..spt_values t2OPTION (MAXDOP 1);INSERT INTO dbo.SOURCE_DATA_FOR_CCI WITH (TABLOCK)SELECT TOP (1048576) 2, ROW_NUMBER()OVER (ORDER BY (SELECT NULL)) % 16000, NULLFROM master..spt_values t1CROSS JOIN master..spt_values t2OPTION (MAXDOP 1);DROP TABLE IF EXISTS dbo.LARGE_BATCH_MODE_MEMORY_REQUEST;CREATE TABLE dbo.LARGE_BATCH_MODE_MEMORY_REQUEST (ID VARCHAR(4000),INDEX CCI CLUSTERED COLUMNSTORE);INSERT INTO dbo.LARGE_BATCH_MODE_MEMORY_REQUESTWITH (TABLOCK)SELECT TOP (2 * 1048576) CAST(ROW_NUMBER()OVER (ORDER BY (SELECT NULL)) AS VARCHAR(8000))+ 'DYEL'FROM master..spt_values t1CROSS JOIN master..spt_values t2;DROP TABLE IF EXISTS dbo.CCI_SLOW_TO_COMPRESS_TARGET_1;CREATE TABLE dbo.CCI_SLOW_TO_COMPRESS_TARGET_1 (ID BIGINT NULL,INDEX CCI CLUSTERED COLUMNSTORE);DROP TABLE IF EXISTS dbo.CCI_SLOW_TO_COMPRESS_TARGET_2;CREATE TABLE dbo.CCI_SLOW_TO_COMPRESS_TARGET_2 (ID BIGINT NULL,INDEX CCI CLUSTERED COLUMNSTORE);
Here’s what the plan looks like:
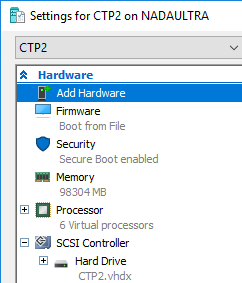
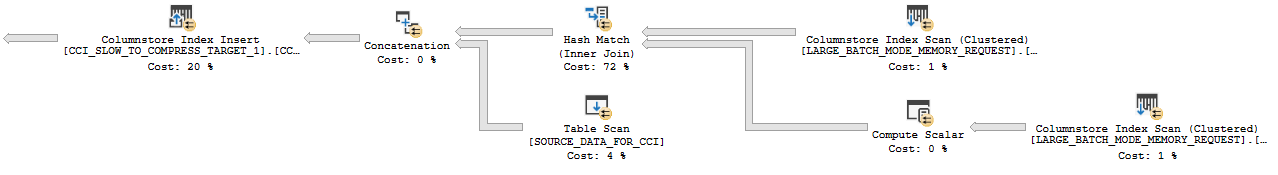
I set Max Server Memory to 8000 MB and executed two queries with a maximum allowed memory grant of 60% via Resource Governor. The first query finished in about 40 seconds. The second query hasn’t finished after 30 minutes. During those 30 minutes the second query has only used 1184 ms of CPU time. The COLUMNSTORE_BUILD_THROTTLE wait type shows up in sys.dm_os_waiting_tasks:
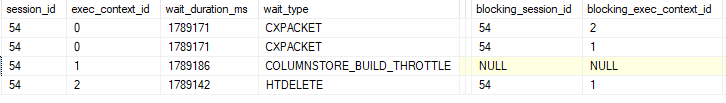
Execution context id 2 is waiting on execution context id 1 with a wait type of HTDELETE. Execution context id 1 has a wait type of COLUMNSTORE_BUILD_THROTTLE. I don’t think that this wait is supposed to show up for parallel inserts. It can show up by design when creating or rebuilding a columnstore index in parallel:
When a columnstore index is being built, the memory grant estimate is based on a segment size of one million rows. The first segment of the index is built using a single thread so the real, required per-thread memory grant is found. Then the memory grants are given per thread and the other segments are built multi-threaded. Although all the threads for the operation are allocated at the start of the build, only one thread is used for the first segment and all the others incur a COLUMNSTORE_BUILD_THROTTLE wait.
The important point is that a wait type of COLUMNSTORE_BUILD_THROTTLE means that worker thread is waiting on another thread to do something. But so does a wait time of HTDELETE. There are only two worker threads and both of them are waiting on another thread to do something. As a result, the query makes no progress. I’ve let similar queries run for 72 hours before giving up and killing them.
How to unfreeze your query
Upgrading to SQL Server 2017 CU11 or higher fixes the issue. With that said, if you’re seeing this issue that means that you have columnstore insert queries waiting at least 25 seconds for a memory grant. That should be considered to be a problem even if the queries didn’t get stuck. If you find yourself in this situation, I strongly consider increasing memory available to SQL Server or limiting memory grants via Resource Governor or some other method.
Final Thoughts
If you have parallel insert queries into CCis that appear to be stuck with no CPU usage and long COLUMNSTORE_BUILD_THROTTLE wait times check your version of SQL Server. Upgrading to at least CU11 will resolve the immediate issue, but consider a more complete fix will include addressing the RESOURCE_SEMAPHORE waits that must be present on your system.
Thanks for reading!
Going Further
If this is the kind of SQL Server stuff you love learning about, you’ll love my training. I’m offering a 75% discount to my blog readers if you click from here. I’m also available for consulting if you just don’t have time for that and need to solve performance problems quickly.
But when I do, it’s usually to tell people they should use RCSI, and then disappear in a cloud of smoke.
Recently I was thinking about lock promotion, because that’s what happens when I get lonely.
While digging around, I found some interesting stuff.
This is the part where I share it with you.
Without Five I Couldn’t Count To Six
The first thing I wanted was a table that I wouldn’t care about messing up, so I made a copy of the Users table.
SELECT *
INTO dbo.IDontCareAboutUsers
FROM dbo.Users AS u
ALTER TABLE dbo.IDontCareAboutUsers
ADD CONSTRAINT pk_IDontCareAboutUsers_id PRIMARY KEY CLUSTERED (Id);
Then I picked on a Reputation that only has one entry in the table: 20720.
BEGIN TRAN
UPDATE idcau
SET idcau.Reputation = 0
FROM dbo.IDontCareAboutUsers AS idcau
WHERE idcau.Reputation = 20720
OPTION(MAXDOP 4)
ROLLBACK
What followed was a full morning of wishing I paid more attention in internals class.
Number One
The first thing I found is that there were 16 attempts at promotion, and four successful promotions.
4×4
Why did this seem weird? I dunno.
Why would there be only 4 successful attempts with no competing locks from other queries?
Why wouldn’t all 16 get promotions?
Number Two
Well, that’s a parallel plan. It’s running at DOP 4.
I added the hint in the update query above so I wouldn’t have to, like, do more to prove it.
Plantar
Okay, maybe this makes a little more sense. Four threads.
If each one tried four times, maybe another thread was like “nah, yo”, and then got by on the fifth try.
Number Three
Looking at perfmon counters before and after running showed.. exactly four!
This isn’t wrong, necessarily. This is how things look in the DMVs it touches after the update runs, but the transaction is still open.
I’m not mad, but I am curious. I wanna know what happened in the middle.
Number Five
I set up a couple Extended Event sessions, one to capture locks acquired, and one to capture lock escalations.
This was neat.
Tell’em, picture
The red rectangle comes from locks acquired during the course of the update. You can see four separate threads going through and grabbing locks.
Each thread got the okay to escalate at 6,249 page locks.
Number Six
Lock promotion isn’t only denied when competing locks on the table are held by other queries.
Modification queries taking locks will attempt promotion every 1,250 locks.
Documentation regarding lock promotion points to at least 5,000 locks needing to be held before it occurs, as one factor (incompatible locks not being present are another).
If we have four threads asking every 1,250 locks (in this case on pages), they all will have made four attempts before finally escalating at 6,249.
6,249 / 1,250 is right around 5, for those who don’t have a calculator installed.
Don’t freak out if your monitoring tool tells you there’s a lot of attempts at escalation, and very few are successful.
It’s not always a sign that there’s blocking, though you may be able to correlate that with lock waits if both are present.
Thanks for reading!
Going Further
If this is the kind of SQL Server stuff you love learning about, you’ll love my training. I’m offering a 75% discount to my blog readers if you click from here. I’m also available for consulting if you just don’t have time for that and need to solve performance problems quickly.
Last week’s thrilling, stunning, flawless episode of whatever-you-wanna-call-it.
Thanks for watching!
Going Further
If this is the kind of SQL Server stuff you love learning about, you’ll love my training. I’m offering a 75% discount to my blog readers if you click from here. I’m also available for consulting if you just don’t have time for that and need to solve performance problems quickly.
I’m gonna be honest with you: I’m not gonna build another First Responder Kit.
It’s established, it’s open source, and it’s badass. I poured a ton of work into it over the years, and starting from scratch seems like a bad use of my time.
I totally encourage you to help continue to build it. I learned a ton working on that stuff, and it was an incredibly valuable and rewarding experience.
I am going to build tooling that I think would be useful but that isn’t covered in there, for things like:
Using any tool that returns a given set of information about wait stats, query plans, indexes, or whatever about SQL Server will show you roughly the same problems.
Roughly. Some better than others. Some I have no idea. Some not so much.
The point is, I can teach you to find problems with the tool you’re using, or help you find a tool that does.
I can also teach you how to solve them.
Nothing New But The Name
My thing over here is coaching. Helping you become better at whatever it is you wanna do.
Every tool is a wrapper for what’s inside SQL Server. Tools are interchangeable, mostly.
Knowing how use and interpret them in a meaningful way is not.
Thanks for reading!
Going Further
If this is the kind of SQL Server stuff you love learning about, you’ll love my training. I’m offering a 75% discount to my blog readers if you click from here. I’m also available for consulting if you just don’t have time for that and need to solve performance problems quickly.