The Difference Between Statistics Time And Plan Operator Times In SQL Server Query Plans

Goal Posts


When you’re measuring query changes to see if your performance changes have made a difference, a common way to do that is to use STATISTICS TIME and IO.

They’re not perfect, but the barrier to entry is super low, and you can get a good enough feel for if you’re on the right track.

In a perfect world, people would only select the rows and columns they need.

Also in a perfect world: that really embarrassing thing you did in 3rd grade wouldn’t pop into your head every time you’re about to do something really important.

Durex


What can make judging differences tough is if you’re returning a lot of rows to SSMS.

Sometimes it feels like you can reduce reads and CPU time, but your overall query time hasn’t changed.

Now with query operator times, that becomes easier to see.

And Earl


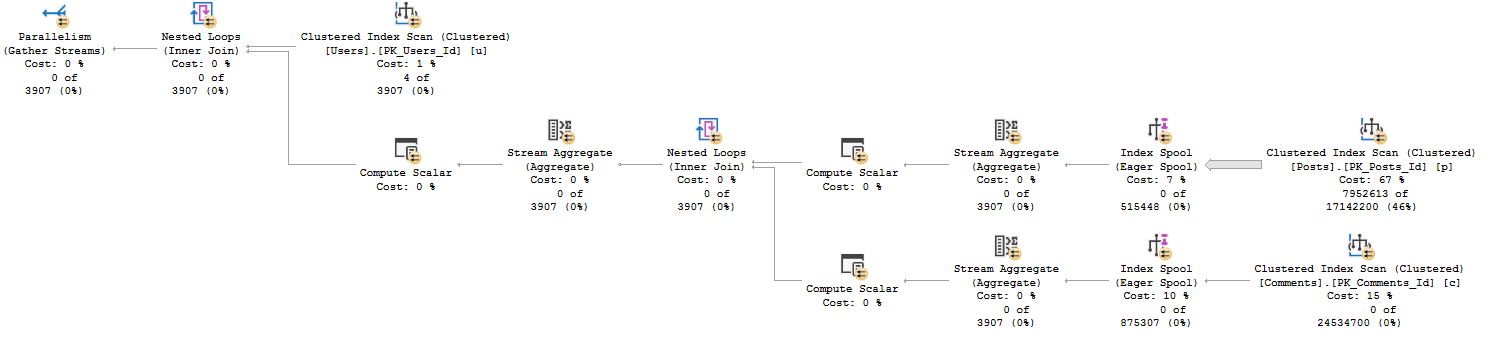
Let’s take this query, which returns ~271k rows.

SET STATISTICS TIME, IO ON;

SELECT c.Score, c.UserId, c.Text 
FROM dbo.Comments AS c
WHERE c.Score BETWEEN 5 AND 30
ORDER BY c.Score DESC

In the Stack Overflow 2013 database, this runs for about 3 wall clock seconds.

It says so in the bottom corner of SSMS.

Since we turned on stats time, we can look in the messages window to see that information.

Here are the relevant details:

 SQL Server Execution Times:
   CPU time = 3516 ms,  elapsed time = 3273 ms.

What looks odd here is that CPU and elapsed time are near-equal, but the plan shows parallelism.

SQL Server Query Plan
Tired of roaches

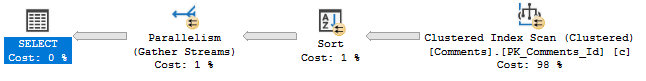
Thankfully, with operator times, the actual plan helps us out.

SQL Server Query Plan
Tired of rats

The query itself ran for <900ms.

The situation isn’t so dire.

More Ales


In stats time, elapsed time measures until results are done getting to SSMS.

It might look like this query “ran” for ~3 seconds, but it didn’t. The query finished processing data in under a second, but it took another couple seconds for SSMS to render the results.

You can do a mock test by doing something like this:

DECLARE @blob_eater VARCHAR(8000);

SELECT @blob_eater = c.Score, 
       @blob_eater = c.UserId, 
	   @blob_eater = c.Text 
FROM dbo.Comments AS c
WHERE c.Score BETWEEN 5 AND 30
ORDER BY c.Score DESC

Now when we run the query, stats time is much closer to the operator finish time:

 SQL Server Execution Times:
   CPU time = 2954 ms,  elapsed time = 897 ms.

Thanks for reading!

Going Further


If this is the kind of SQL Server stuff you love learning about, you’ll love my training. I’m offering a 75% discount to my blog readers if you click from here. I’m also available for consulting if you just don’t have time for that and need to solve performance problems quickly.

Why Not Just Go For The Big Plan To Improve SQL Server Query Performance?

M’ocean


Going Further


If this is the kind of SQL Server stuff you love learning about, you’ll love my training. I’m offering a 75% discount to my blog readers if you click from here. I’m also available for consulting if you just don’t have time for that and need to solve performance problems quickly.

Too Much Of A Harmless SQL Server Wait Type Can Be Harmful

Absence Of Evidence


There’s a pinky-out saying about wine: don’t hate the grape.

People say it because the same kind of grape can be grown by different people in different places.

Due to many, ahem, local factors, wine made with that grape can taste miraculously different.

It’s with that in mind that I’m going to say this: don’t ignore the wait.

No matter what script you’re using to look at wait stats, try unquoting the ignoreable list and seeing what shows up.

Get curious. Poke around. You might find something interesting.

Twosifer


While experimenting with FROID, I came up with a function and query that generate some weird waits.

Those waits are EXECSYNC, and CXCONSUMER. Now, under normal circumstances, you might be able to ignore them.

But things are rarely normal when you’re experiencing performance problems, are they? If you ignore too much, you can miss big problems.

Going back to running this query, I can see the wait stats that get generated in sys.dm_exec_session_wait_stats when the query is finished.

SELECT u.DisplayName, 
       dbo.TotalScore(u.Id) AS TotalScore
FROM dbo.Users AS u
WHERE u.Reputation >= 200000
ORDER BY u.Id;

Here’s what those waits look like:

SQL Server Wait Stats
Better Off Dead

If one were to follow advice — even advice from Microsoft — one may miss important clues as to what happened.

CXCONSUMER waits being high is fairly tightly correlated to skewed parallelism, and this is no exception.

EXECSYNC represents a serial zone within a parallel plan, in this case building two Eager Index Spools:

SQL Server Query Plan
SPOOL-TA-TOES

When you spend a long time building indexes single threaded, you spend a long time waiting on CXCONSUMER (and not so much time at all waiting on CXPACKET).

Being able to put the waits together with the query plan can help you tune queries more efficiently.

This is especially true if you’re on earlier versions of SQL Server/SSMS where the kind of detail shown in query plans here doesn’t exist.

Thanks for reading!

Live SQL Server Q&A!

ICYMI


Last week’s thrilling, stunning, flawless episode of whatever-you-wanna-call-it.

Going Further


If this is the kind of SQL Server stuff you love learning about, you’ll love my training. I’m offering a 75% discount to my blog readers if you click from here. I’m also available for consulting if you just don’t have time for that and need to solve performance problems quickly.

Running Query Confusion In SQL Server

Somewhat Solved


This bit of confusion is largely solved in SQL Server 2019 under compatibility level 150, when FROID (scalar udf inlining) kicks in.

But, you know, we’re a ways off from 2019 dropping, being adopted, and compat level 150 being the operating norm.

So here goes!

Functional Querying


I’ve got a scalar valued function. What it does is unimportant, but I’m calling it in a query like this:

SELECT u.DisplayName, 
       dbo.TotalScore(u.Id) AS TotalScore --<functione
FROM dbo.Users AS u
WHERE u.Reputation >= 200000
ORDER BY u.Id;

When I run this in SSMS, it’s obvious to us what’s going on.

But if I’m watching what’s happening on a server using sp_WhoIsActive, what’s going on might not be obvious.

I’m doing all this with just my query running to show how confusing things can get.

First Confusion: Query Text

SQL Server sp_WhoIsActive
Foggy

This doesn’t look at all like the text of our query. We can guess that it’s the function running in the select list since we know what we’re doing, but, you know…

We can bring some clarity by running sp_WhoIsActive like this:

sp_WhoIsActive @get_plans = 1, 
               @get_outer_command = 1;

The outer command parameter will show us the query calling the function, which’ll look more familiar.

SQL Server sp_WhoIsActive
Headline News

Second Confusion: Phantom Parallelism

We’re hitting more of those harmless, silly little CXCONSUMER waits.

But how? Our query plan is serial!

SQL Server Query Plan
Glam Chowder

This part is a little less obvious, but if we get an estimated plan for our query, or track down the query plan for the function, it becomes more obvious.

SQL Server Query Plan
Questionable Taco

The query plan for the function is parallel — a cute ~nuance~ about scalar udfs is that they only prevent the query calling them from going parallel.

The function itself can go parallel. So that’s… nice.

I guess.

They Walked Inlined


In compat level 150, things are more clear.

SQL Server sp_WhoIsActive
CLRLY

The inner and outer text are the same. There’s more of that CXCONSUMER, though. Hoowee.

SQL Server Query Plan
Might as well jump.

But at least now we have a query plan that matches the parallel waits, right?

In the next post, we’re gonna talk more about those wait stats, though.

Thanks for reading!

A Trick For Working Around Scalar UDF Performance Issues In SQL Server

Mr. Duster


Thanks for watching!

Going Further


If this is the kind of SQL Server stuff you love learning about, you’ll love my training. I’m offering a 75% discount to my blog readers if you click from here. I’m also available for consulting if you just don’t have time for that and need to solve performance problems quickly.

Operator Time Oddities In SQL Server Query Plans

SILENCE YOUR CELL PHONES


Thanks for watching!

Going Further


If this is the kind of SQL Server stuff you love learning about, you’ll love my training. I’m offering a 75% discount to my blog readers if you click from here. I’m also available for consulting if you just don’t have time for that and need to solve performance problems quickly.

CMEMTHREAD Waits Generated By Query Store In SQL Server

Memethread


Thanks for watching!

Going Further


If this is the kind of SQL Server stuff you love learning about, you’ll love my training. I’m offering a 75% discount to my blog readers if you click from here. I’m also available for consulting if you just don’t have time for that and need to solve performance problems quickly.


What Are Your Weirdest SQL Server Wait Stats?

Common People


I know, you probably have questions about CXPACKET.

Maybe you look at a wait stats report and nod sagely at the caps lock extravaganza of variably descriptive names.

The unformatted numbers that you tally on your fingers, and then have to look up what 12 digits is.

When you search around, you can figure out what most of your waits are, and why they happen. You might even be able to figure out how to fix them.

(I know, you’re gonna read advice on a blog from 2003 telling you to set “MaxDOP” to 1, but forchrissakes don’t do it.)

What I’m looking for are waits that pop up, but you haven’t been able to find answers to. The real nut crackers.

If you’ve got those, leave a comment and let me know.

Going Further


If this is the kind of SQL Server stuff you love learning about, you’ll love my training. I’m offering a 75% discount to my blog readers if you click from here. I’m also available for consulting if you just don’t have time for that and need to solve performance problems quickly.