I’ve used this proc as an example in the past. It’s a great parameter sniffing demo.
Why is it great? Because there’s exactly one value in the Posts table that causes an issue. It causes that issue because someone hated the idea of normalization.
The better thing to do here would be to have separate tables for questions and answers. Because we don’t have those, we end up with a weird scnenario.
In the Posts table, because questions and answers are lumped in together, there are certain traits that different types of posts can’t share:
Answers can’t have answers
Questions can’t have parent questions
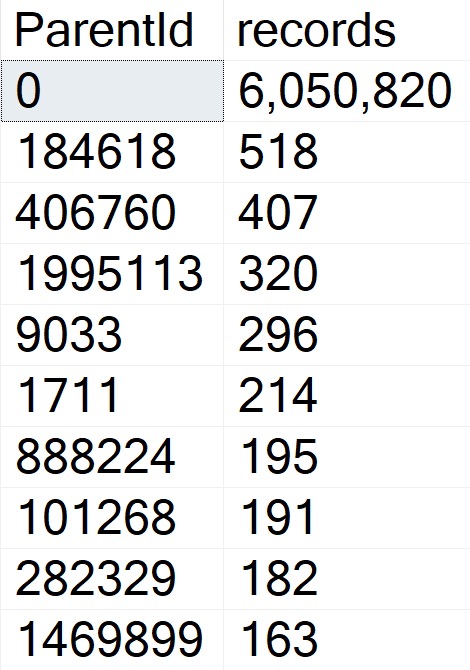
There are other examples, but those are the two most obvious ones. But anyway, because of that, every Question has a ParentId of zero, and every Answer has the ParentId of the question it was posted under.
With around 6 million questions in the Posts table, that means there are around 6 million rows with a ParentId of zero, and around 11 million rows with other values.
lopsided
Current Affairs
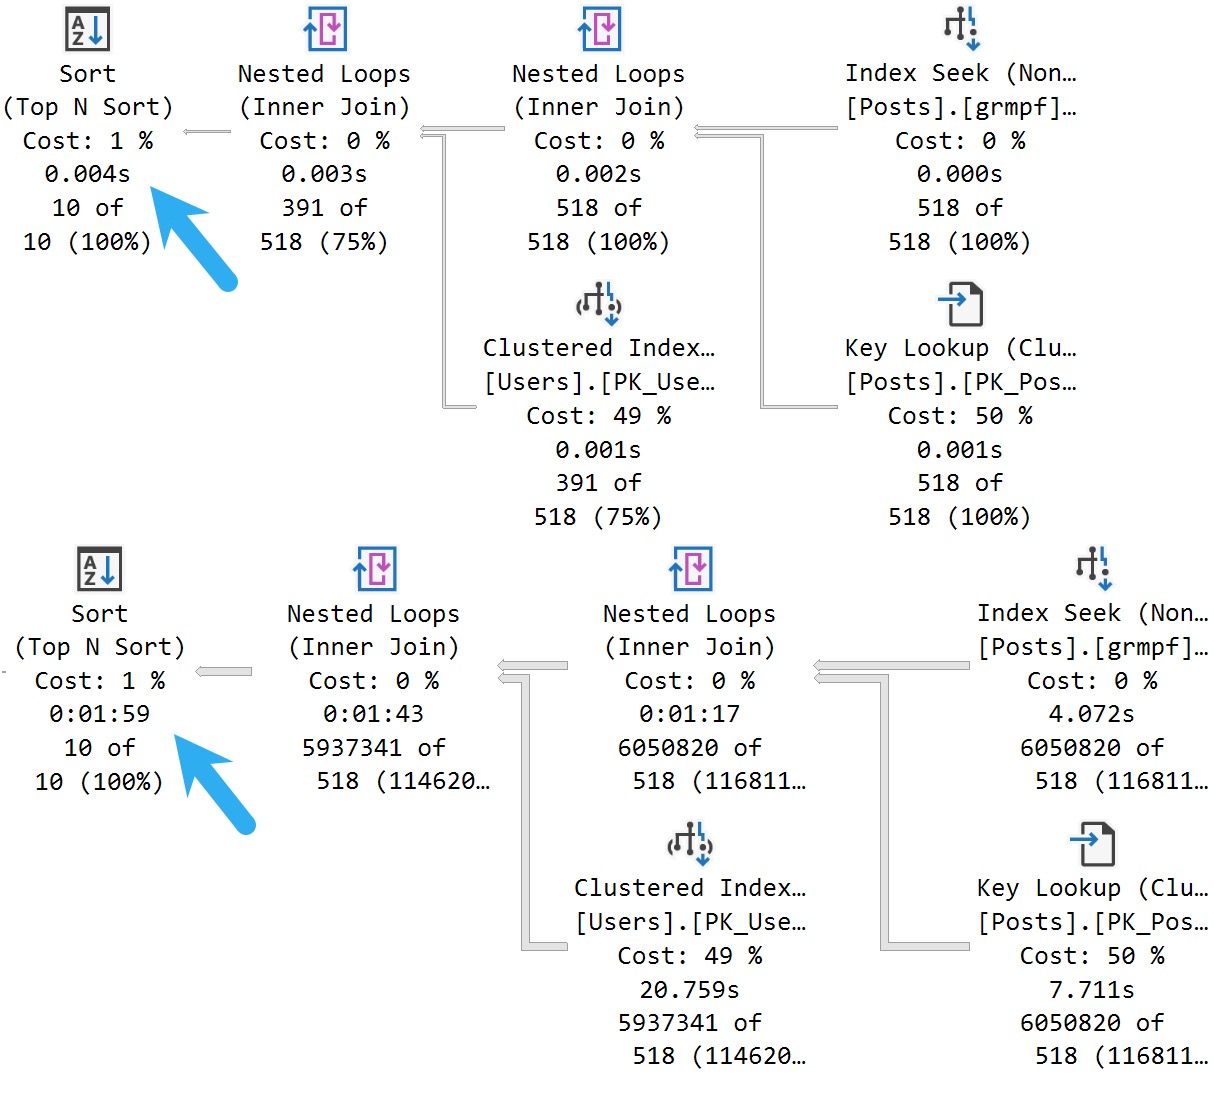
In compat level 150, if I run this procedure like so:
If this is the kind of SQL Server stuff you love learning about, you’ll love my training. I’m offering a 75% discount to my blog readers if you click from here. I’m also available for consulting if you just don’t have time for that and need to solve performance problems quickly.
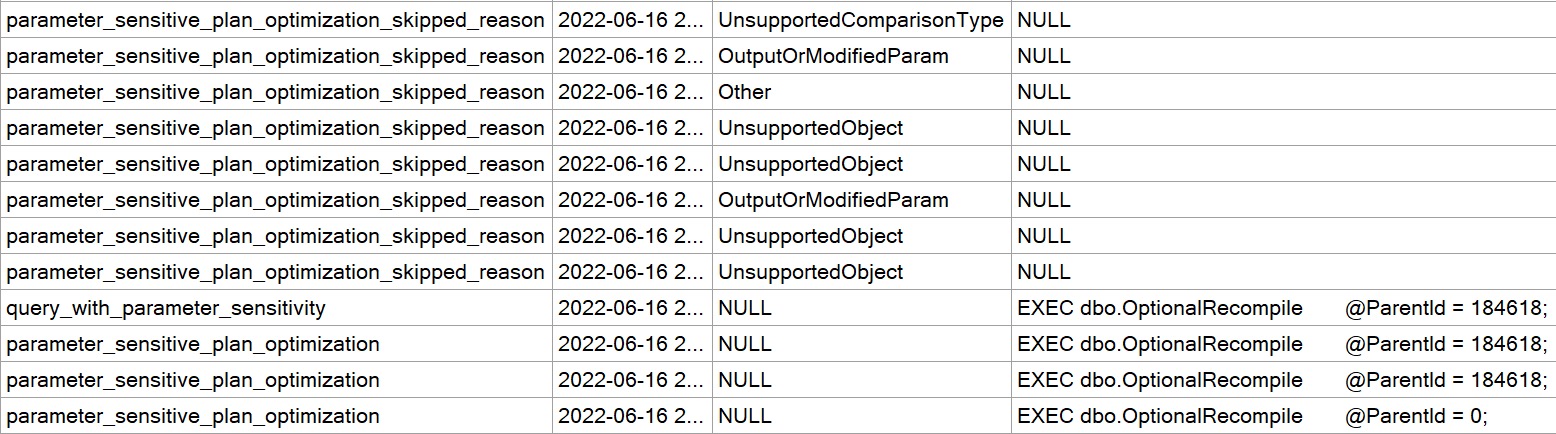
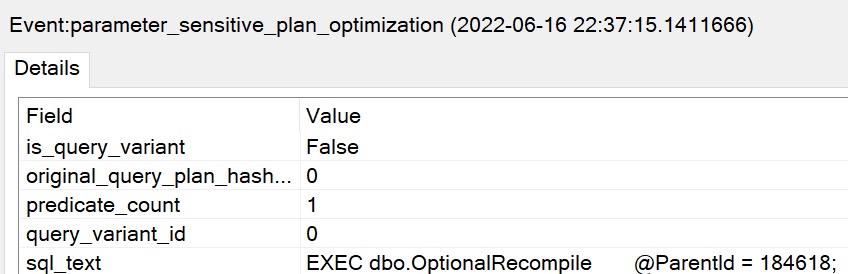
parameter_sensitive_plan_optimization: This event is fired when a query uses Parameter Sensitive Plan (PSP) Optimization feature.
parameter_sensitive_plan_optimization_skipped_reason: Occurs when the parameter sensitive plan feature is skipped. Use this event to monitor the reason why parameter sensitive plan optimization is skipped
parameter_sensitive_plan_testing: Fired when parameter sensitive plan is tested.
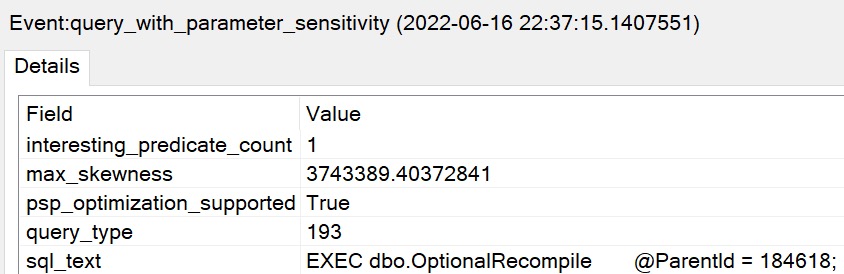
query_with_parameter_sensitivity: This event is fired when a query is discovered to have parameter sensitivity. This telemetry will help us in identifying queries that are parameter sensitive and how skewed the columns involved in the query are.
The only one I haven’t gotten to fire yet in my testing is parameter_sensitive_plan_testing which does not break my heart.
Mythos
Most of what gets returned by those is barely useful. The one that I thought was most promising was the skipped_reasonevent. I was able to track map values down for that one:
Reading through that list, there are some interesting points where the feature won’t kick in. These points are sort of a ghosts of query anti-patterns past.
TableVariable
HasLocalVar
CursorWithPopulate
Tvf
ParamSniffDisabled
NonInlinedUDF
And, of course, this one gave me quite the chuckle: QueryTextTooLarge.
YOU HEAR THAT ENTITY FRAMEWORK?
Dulls
The results from my Extended Event session, and… I’ll talk through my disappointment in a moment, was not terribly spectacular.
ho hum
The skipped_reason doesn’t reliably collect query text the way the other events do. That makes identifying the query that got skipped pretty difficult. There may be another action (like the stack) that captures it, but I haven’t had time to fully investigate yet.
so what?
Okay. Fine.
yep.
What do you do with this? I’m not sure yet. I don’t think I see much use in these just yet.
Hey, tomorrow’s another day. We’ll look at how the feature kicks in and fixes a parameter sniffing issue with this procedure.
Thanks for reading!
Going Further
If this is the kind of SQL Server stuff you love learning about, you’ll love my training. I’m offering a 75% discount to my blog readers if you click from here. I’m also available for consulting if you just don’t have time for that and need to solve performance problems quickly.
In the bad old days, which are still your days (but at least you have better days to look forward to), SQL Server’s cost-based optimizer would take a parametrized query, come up with a query plan, and then reuse that plan until:
Plan cache clearing event
Plan evicting event
There are a bunch of reasons for those things. They’re not important here.
What is important is the future, where SQL Server will have some more options for getting out of parameter sensitive jams.
While Cardinality Estimation Feedback is a between-executions like Memory Grant Feedback, the Parameter Sensitive Plan feature is a heuristic runtime decision, sort of like Adaptive Joins and Batch Mode On Row Store.
Like most things, you’ll need to be in the latest compatibility level, 160, and… it hasn’t been announced yet, but traditionally things like this are Enterprise Only.
Time will tell.
Shellac
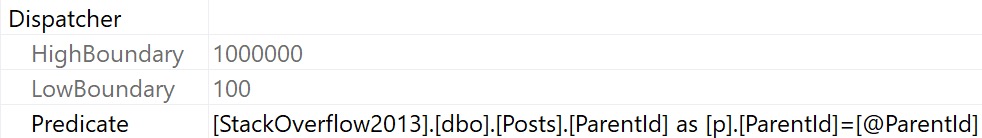
The way this feature works is, rather than caching a single query plan for every other execution to use, it creates what’s called a Dispatcher plan (if your query qualifies).
You’ll see something like this in the properties of the root node of your query plan, and your query will have some additional funny business at the end of it.
sticky business
And that other thing:
SELECT TOP (10)
        u.DisplayName,
        p.*
    FROM dbo.Posts AS p
    JOIN dbo.Users AS u
        ON p.OwnerUserId = u.Id
    WHERE p.ParentId = @ParentId
    ORDER BY u.Reputation DESC
    OPTION
    (
        PLAN PER VALUE
        (
            QueryVariantID = 3,
            predicate_range
            (
                [StackOverflow2013].[dbo].[Posts].[ParentId] = @ParentId,
                100.0,
                1000000.0
            )
        )
    )
Note that I formatted the option part of the query a bit to make it a bit more likable (to me).
The basic message here is that for the @ParentId parameter, there are three plan variants (the limit currently), and this is the third one.
There are also a couple numbers there that indicate the upper and lower bounds for bucketizing the three plan variants.
S/M/L
The basic idea here is to generate small, medium, and large plans for different cardinality estimation ranges.
Most of the examples I’ve been able to come up with have only generated two plans, one for the very low end, and one for the very high end.
As far as I can tell, the limitations for this feature seem to be:
In tomorrow’s post, we’ll look at some of the Extended Events attached to this feature that give you some insights into when the feature kicks in, when it doesn’t, and what SQL Server thought about how sensitive your query is.
Thanks for reading!
Going Further
If this is the kind of SQL Server stuff you love learning about, you’ll love my training. I’m offering a 75% discount to my blog readers if you click from here. I’m also available for consulting if you just don’t have time for that and need to solve performance problems quickly.
Let’s take a brief moment to talk about terminology here, so you don’t go getting yourself all tied up in knots:
Parameter Sniffing: When the optimizer creates and caches a plan based on a set of parameter(s) for reuse
Parameter Sensitivity: When a cached plan for one set of parameter(s) is not a good plan for other sets of parameter(s)
The first one is a usually-good thing, because your SQL Server won’t spend a lot of time compiling plans constantly. This is obviously more important for OLTP workloads than for data warehouses.
This can pose problems in either type of environment when data is skewed towards one or more values, because queries that need to process a lot of rows typically need a different execution plan strategy than queries processing a small number of rows.
This seems a good fit for the Intelligent Query Processing family of SQL Server features, because fixing it sometimes requires a certain level of dynamism.
Choice 2 Choice
The reason this sort of thing can happen often comes down to indexing. That’s obviously not the only thing. Even a perfect index won’t make nested loops more efficient than a hash join (and vice versa) under the right circumstances.
Probably the most classic parameter sensitivity issue, and why folks spend a long time trying to fix them, is the also-much-maligned Lookup.
But consider the many other things that might happen in a query plan that will hamper performance.
Join type
Join order
Memory grants
Parallelism
Aggregate type
Sort/Sort Placement
Batch Mode
The mind boggles at all the possibilities. This doesn’t even get into all the wacky and wild things that can mess SQL Server’s cost-based optimizer up a long the way.
With SQL Server 2022, we’ve finally got a starting point for resolving this issue.
In tomorrow’s post, we’ll talk a bit about how this new feature works to help with your parameter sensitivity issues, which are issues.
Not your parameter sniffing issues, which are not issues.
For the rest of the week, I’m going to dig deeper into some of the stuff that the documentation glosses over, where it helps, and show you a situation where it should kick in and help but doesn’t.
Keep in mind that these are early thoughts, and I expect things to evolve both as RTM season approaches, and as Cumulative Updates are released for SQL Server 2022.
Remember scalar UDF inlining? That thing morphed quite a bit.
Can’t wait for all of you to get on SQL Server 2019 and experience it.
Thanks for reading!
Going Further
If this is the kind of SQL Server stuff you love learning about, you’ll love my training. I’m offering a 75% discount to my blog readers if you click from here. I’m also available for consulting if you just don’t have time for that and need to solve performance problems quickly.
I’ve been trying to take the general temperature when it comes to SQL Server 2022. At least from a performance perspective, some interesting things have been introduced so far.
There have been a few neat things:
Parameter Sensitive Plan optimizations
Query Store Hints
Memory Grant Feedback improvements
DOP Feedback
Cardinality Estimation Feedback
I’m not seeing a whole lot out there. I’m not sure why. I follow quite a few SQL bloggers via Feedly.
Perhaps it’s just too new. Maybe everyone is waiting for CTP SP1.
Well, anyway. In this post I want to talk a little bit about what Cardinality Estimation Feedback can do, and what it can’t do.
What It Do
First, you need Query Store enabled to get this to work. It relies on the Query Store Plan hints also introduced for SQL Server 2022.
For queries that execute frequently and retain cached plans, the optimizer will look at some of the assumptions that get made under different Cardinality Estimation models.
As I understand it, this is a bit like Memory Grant Feedback. If estimation issues are detected, a different plan will be attempted. If that plan corrects a performance issue, then the hint will get persisted in Query Store.
Pretty cool, but…
What It Don’t Do
It doesn’t fix things while they’re running, like Adaptive Joins can do. That’s sort of unfortunate! Hear me out on why.
Often, when model errors are incorrect, queries run for a long time. Particularly when row goals are introduced, query plans are quite sensitive to those goals not being met quickly.
It’d be really unfortunate for you to sit around waiting for 15-16 executions of a poor performing query to finish executing before an intervention happens.
I would have either:
Reduced, or made this threshold configurable
Been more aggressive about introducing Adaptive Joins when CE models influence plan choices
After all, Adaptive Joins help queries at runtime rather than waiting for an arbitrary number of executions and then stepping in.
Perhaps there was a good reason for not doing this, but those were the first two things to cross my mind when looking into the feature.
DBCC FREEPROCCACHE;
ALTER DATABASE
    StackOverflow2010
SET
    QUERY_STORE CLEAR;
GO

    CREATE INDEX whatever
        ON dbo.Votes(CreationDate, VoteTypeId, PostId);

    CREATE INDEX apathy
        ON dbo.Posts (PostTypeId)
            INCLUDE (OwnerUserId, Score, Title);
GO

    SELECT TOP (2500)
        p.OwnerUserId,
        p.Score,
        p.Title,
        v.CreationDate,
        ISNULL(v.BountyAmount, 0) AS BountyAmount
    FROM dbo.Posts AS p
    JOIN dbo.Votes AS v
        ON  p.Id = v.PostId
    WHERE v.VoteTypeId = 1
    AND   p.PostTypeId = 1
    ORDER BY v.CreationDate DESC;
    GO 17

SELECT qspf.* FROM sys.query_store_plan_feedback AS qspf;

SELECT qsqh.* FROM sys.query_store_query_hints AS qsqh;
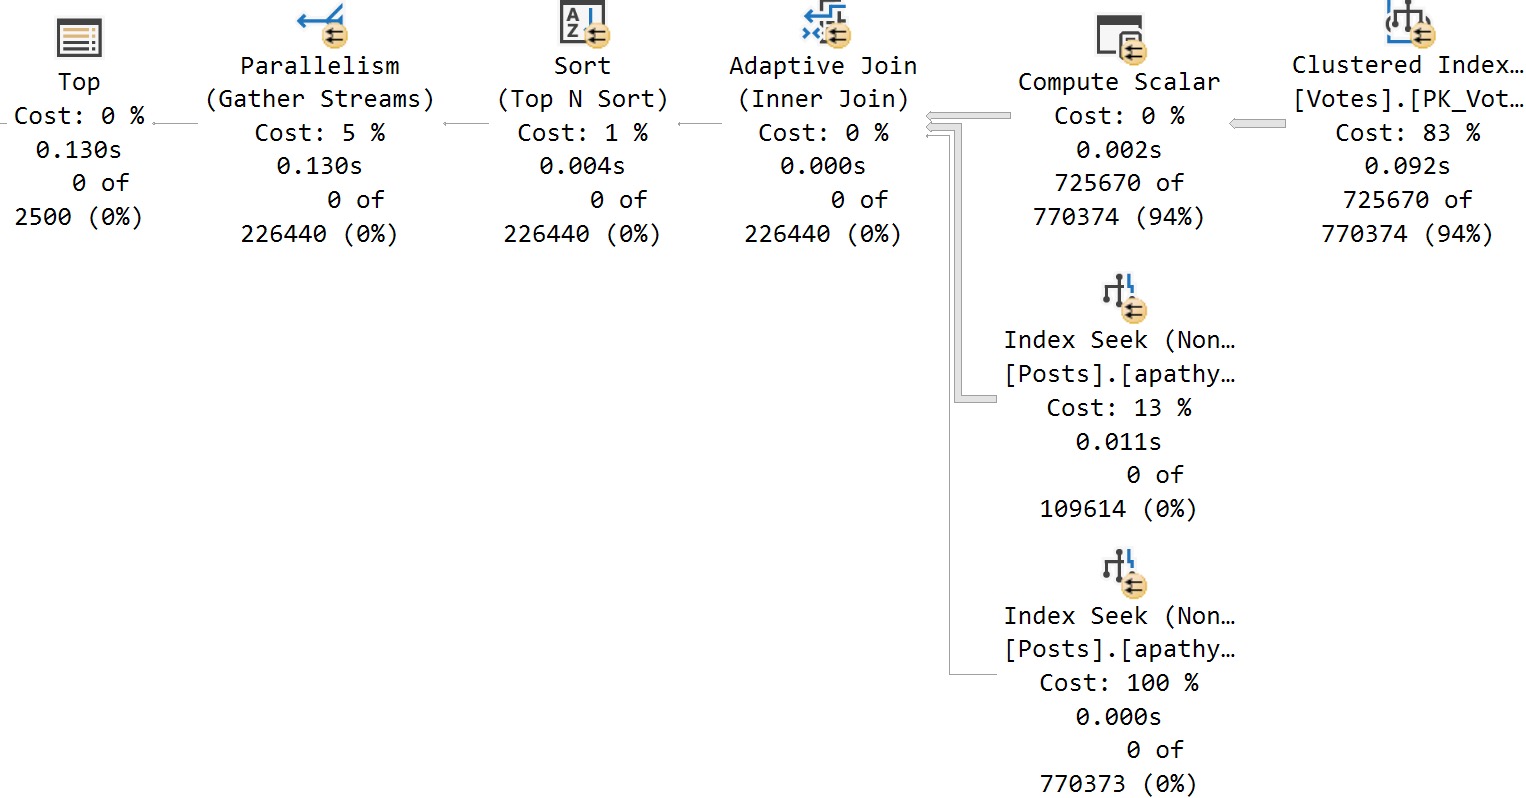
For the first 16 runs, we get the same query plan that takes about 2 seconds.
if you got a problem
Then, magically, on run #17, we get a different query plan!
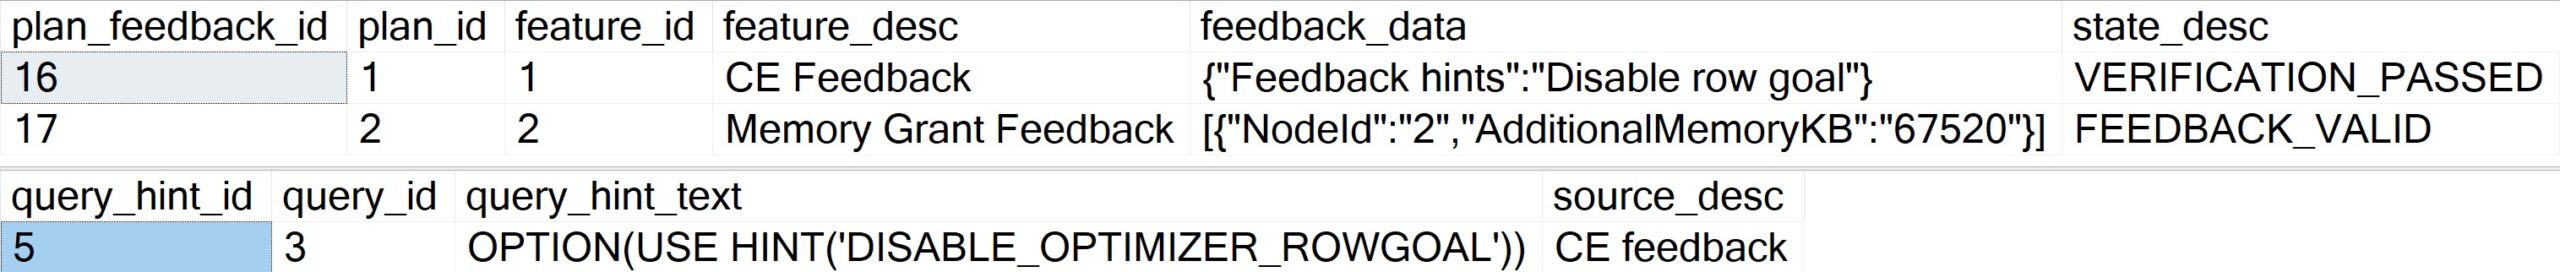
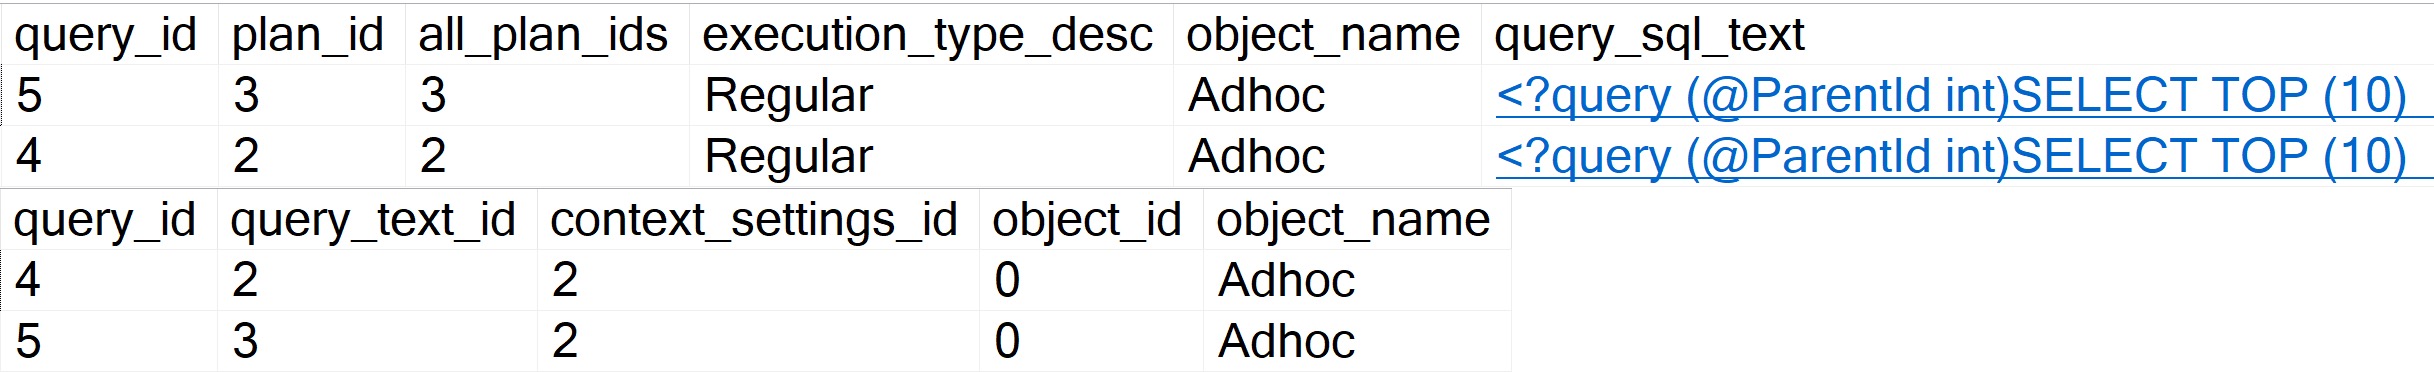
There are a couple views that will detail where hints came from and which were applied:
clowny clown clown
Since I just cleared out query store prior to this running, we can infer some things:
CE Feedback kicked in and gave us a new plan with a hint to disable row goals
The second plan generated was identified by the engine as needing memory grant feedback
I suppose this is a good reason to do some work on sp_QuickieStore so y’all can see this stuff in action.
Thanks for reading!
Going Further
If this is the kind of SQL Server stuff you love learning about, you’ll love my training. I’m offering a 75% discount to my blog readers if you click from here. I’m also available for consulting if you just don’t have time for that and need to solve performance problems quickly.
If you’re ever on a long flight and want something to fall asleep to, ask a DBA how to set MAXDOP.
Sometimes I even ask myself that question when I’m tossing and turning at night.
There are a lot of things to consider when fixing settings globally across a workload. For parallelism, it’s less about individual query performance, and more about overall server/workload performance
After all, letting every query go as absolutely parallel as possible is only good up to a point; that point is usually when you start regularly running out of worker threads, or your CPUs could double as crematoriums.
Setting MAXDOP is about limiting the damage that a parallel workload can do to a server. The expectation is that a query running at DOP 8 will run 8x faster than a query running at DOP 1.
But setting MAXDOP for every query isn’t something you catch even the most persnickety performance tuners doing. Perhaps some of the more critical ones, but you know…
Let Me Rust
I’m not going to demo DOP feedback in this post, I’m just going to show you the situation that it hopes to improve upon.
To do that, I’m going to run a simple aggregation query at different degrees of parallelism, and show you the changes in query timing.
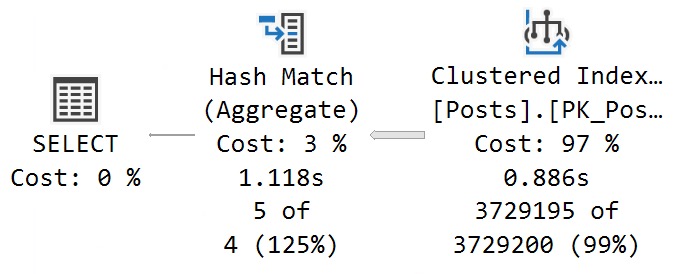
At DOP 1:
The query runs for 1.1 seconds, with 886ms consumed while scanning the Posts table.
DOPPER DON
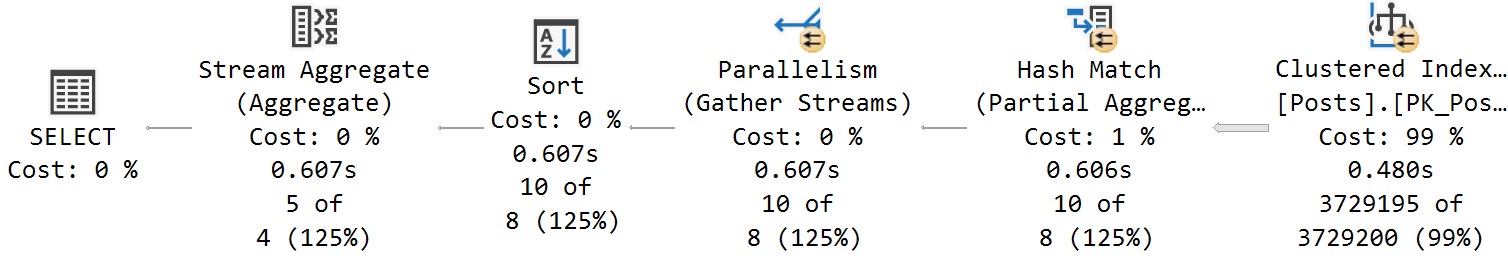
At DOP 2:
The query runs just about twice as fast, starting with the scan of the Posts table taking about half as long. This is good scaling. Add one CPU, go twice as fast as you did with one CPU.
Rip Van Winkle
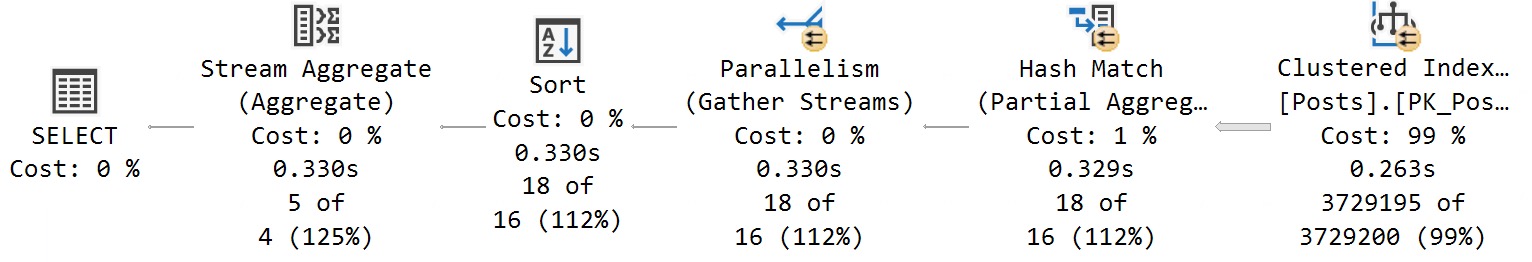
At DOP 4:
The gets about twice as fast again! The scan of the Posts table is now down to 263ms, and the query in total is at 330ms. Adding in two more cores seems a good choice, here.
Bed Rock
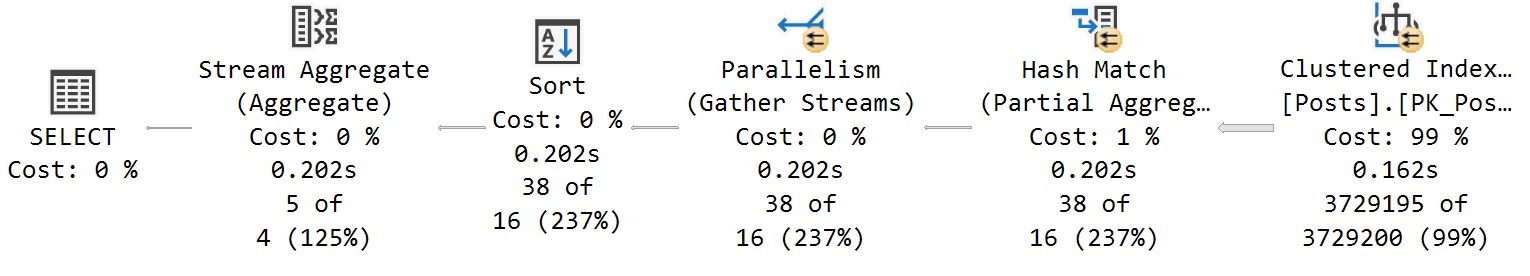
At DOP 8:
The query no longer continues to get 2x faster. This isn’t a knock against DOP 8 in general; my query just happens to hit a wall around DOP 4. With 4 additional CPUs, we only save ~130ms at the end of the day.
Anubis
Why This Is Cool
This new feature will help DBAs have to worry less about getting MAXDOP absolutely right across the board. Who knows, we may even see a day where MAXDOP is left at zero.
But you’d never skip that installer step, would you?
Anyway, for anyone out there who is paranoid about setting DOP too high, this should help your queries find a more approximately-good middle ground.
Hopefully it works as advertised.
Thanks for reading!
Going Further
If this is the kind of SQL Server stuff you love learning about, you’ll love my training. I’m offering a 75% discount to my blog readers if you click from here. I’m also available for consulting if you just don’t have time for that and need to solve performance problems quickly.
SQL Server query plans have had, forever, pretty generic reasons embedded in the XML for why your query was prevented from going parallel.
Not for things like it not breaking the Cost Threshold For Parallelism barrier, which should be obvious to the end user, but certainly for things like scalar UDFs, etc.
The thing is, the reason always seemed to be “Could Not Generate Valid Parallel Plan” for most of them, even though more explicit reasons were available.
They started cropping up, as things do, in Azure SQL DB, and have finally made it to the box product that we all know and mostly love.
Let’s explore some of them! Because that’s what we do.
Generate Valid Blog Post
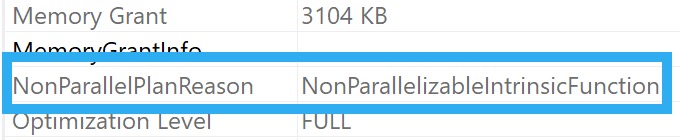
First, some intrinsic functions prevent a parallel plan. You can always see the reason (if one exists) if you look in the properties of the root operator in the query plan.
not for you!
Some Intrinsic Functions
An easy one to validate this with is OBJECT_NAME
SELECT
    c = OBJECT_NAME(COUNT_BIG(*))
FROM dbo.Posts AS p;
There’s always some hijinks about with cursors, but here you go:
DECLARE
    @c bigint;

DECLARE
    c CURSOR
    FAST_FORWARD
FOR
SELECT
    c = COUNT_BIG(*)
FROM dbo.Posts AS p;

OPEN c;

FETCH NEXT
FROM
    c
INTO
    @c;

CLOSE c;
DEALLOCATE c;
GO
This is another reason that I have seen around for a while too, but we may as well be thorough:
CREATE OR ALTER FUNCTION
    dbo.c
(
    @c bigint
)
RETURNS bigint
WITH SCHEMABINDING, RETURNS NULL ON NULL INPUT
AS
BEGIN
    DECLARE /*Ruin UDF inlining with one weird trick*/
        @gd datetime = GETDATE();
    RETURN @c;
END;
GO

SELECT
    c = dbo.c(COUNT_BIG(*))
FROM dbo.Posts AS p;
Fun stuff is always in XML. Just think about all the best times in your life. I bet XML was involved.
Now when you look at it, it will tell you what’s screwing up parallel plan generation in your SQL Server queries.
J’accuse, as they say.
Thanks for reading!
Going Further
If this is the kind of SQL Server stuff you love learning about, you’ll love my training. I’m offering a 75% discount to my blog readers if you click from here. I’m also available for consulting if you just don’t have time for that and need to solve performance problems quickly.
Query hints seem to get treated like prescription drugs. You hear all the problems they can solve, but then you get a long list of problems they can cause.
“Your cholesterol will be lower, but you might bleed to death from your eyes.”
I use query hints all the time to show people what different (and often better) query plans would look like, and why they weren’t chosen.
Sometimes it’s cardinality estimation, sometimes it’s costing, sometimes there was an optimization timeout, and other times…
Msg 8622, Level 16, State 1, Line 20
Query processor could not produce a query plan because of the hints defined in this query. Resubmit the query without specifying any hints and without using SET FORCEPLAN.
Because, you know, you can’t always get what you want.
Problem Statement
When you’re dealing with untouchable vendor code full of mistakes, ORM queries that God has turned away from, and other queries that for some reason can’t be tinkered with, we used to not have a lot of options.
This is going to be a game changer in a lot of cases, because you can hint all sorts of useful changes to queries that would otherwise be stuck forever in their current hell.
Of course, not everything is supported. How could it all be? That would be insane.
According to the docs, here’s what’s supported currently:
These query hints are supported as Query Store hints:
This is where things get… tough. There aren’t any super-important query hints missing, but not being able to use ANY table hints is bad news for a number of reasons.
Duck Hint
Included in the potential table hints are all these delights:
WITH ( <table_hint> [ [, ]…n ] )
<table_hint> ::=
{ NOEXPAND [ , INDEX ( <index_value> [ ,…n ] ) | INDEX = ( <index_value> ) ]
| INDEX ( <index_value> [ ,…n ] ) | INDEX = ( <index_value> )
No index hints, no locking hints, no isolation level hints, no access method hints, and… no NOEXPAND hint 😭
The prior being made even more aggravating because EXPAND VIEWS is a query hint.
No one ever expands indexed views.
Gridlock
This feature has me pretty excited for SQL Server 2022. In particular for Entity Framework queries, I can see myself using:
FORCE ORDER
NO_PERFORMANCE_SPOOL
RECOMPILE
Maybe even all together. The more the merrier! Like beans.
I do hope that at some point there is a workaround for some of the table hints getting used, but in 4 years when folks finally start adopting this newfangled version, I’ll have a grand time fixing problems that used to be out of my reach.
Thanks for reading!
Going Further
If this is the kind of SQL Server stuff you love learning about, you’ll love my training. I’m offering a 75% discount to my blog readers if you click from here. I’m also available for consulting if you just don’t have time for that and need to solve performance problems quickly.
SQL Server 2022 has a new feature in it to help with parameter sensitive query plans.
That is great. Parameter sensitivity, sometimes just called parameter sniffing, can be a real bear to track down, reproduce, and fix.
In a lot of the client work I do, I end up using dynamic SQL like this to get things to behave:
But with this new feature, you get some of the same fixes without having to interfere with the query at all.
How It Works
You can read the full documentation here. But you don’t read the documentation, and the docs are missing some details at the moment anyway.
It only works on equality predicates right now
It only works on one predicate per query
It only gives you three query plan choices, based on stats buckets
There’s also some additional notes in the docs that I’m going to reproduce here, because this is where you’re gonna get tripped up, if your scripts associate statements in the case with calling stored procedures, or using object identifiers from Query Store.
For each query variant mapping to a given dispatcher:
The query_plan_hash is unique. This column is available in sys.dm_exec_query_stats, and other Dynamic Management Views and catalog tables.
The plan_handle is unique. This column is available in sys.dm_exec_query_stats, sys.dm_exec_sql_text, sys.dm_exec_cached_plans, and in other Dynamic Management Views and Functions, and catalog tables.
The query_hash is common to other variants mapping to the same dispatcher, so it’s possible to determine aggregate resource usage for queries that differ only by input parameter values. This column is available in sys.dm_exec_query_stats, sys.query_store_query, and other Dynamic Management Views and catalog tables.
The sql_handle is unique due to special PSP optimization identifiers being added to the query text during compilation. This column is available in sys.dm_exec_query_stats, sys.dm_exec_sql_text, sys.dm_exec_cached_plans, and in other Dynamic Management Views and Functions, and catalog tables. The same handle information is available in the Query Store as the last_compile_batch_sql_handle column in the sys.query_store_query catalog table.
The query_id is unique in the Query Store. This column is available in sys.query_store_query, and other Query Store catalog tables.
The problem is that, sort of like dynamic SQL, this makes each different plan/statement impossible to tie back to the procedure.
What I’ve Tried
Here’s a proc that is eligible for parameter sensitivity training:
CREATE OR ALTER PROCEDURE
    dbo.SQL2022
(
    @ParentId int
)
AS
BEGIN
SET NOCOUNT, XACT_ABORT ON;

    SELECT TOP (10)
        u.DisplayName,
        p.*
    FROM dbo.Posts AS p
    JOIN dbo.Users AS u
        ON p.OwnerUserId = u.Id
    WHERE p.ParentId = @ParentId
    ORDER BY u.Reputation DESC;

END;
GO
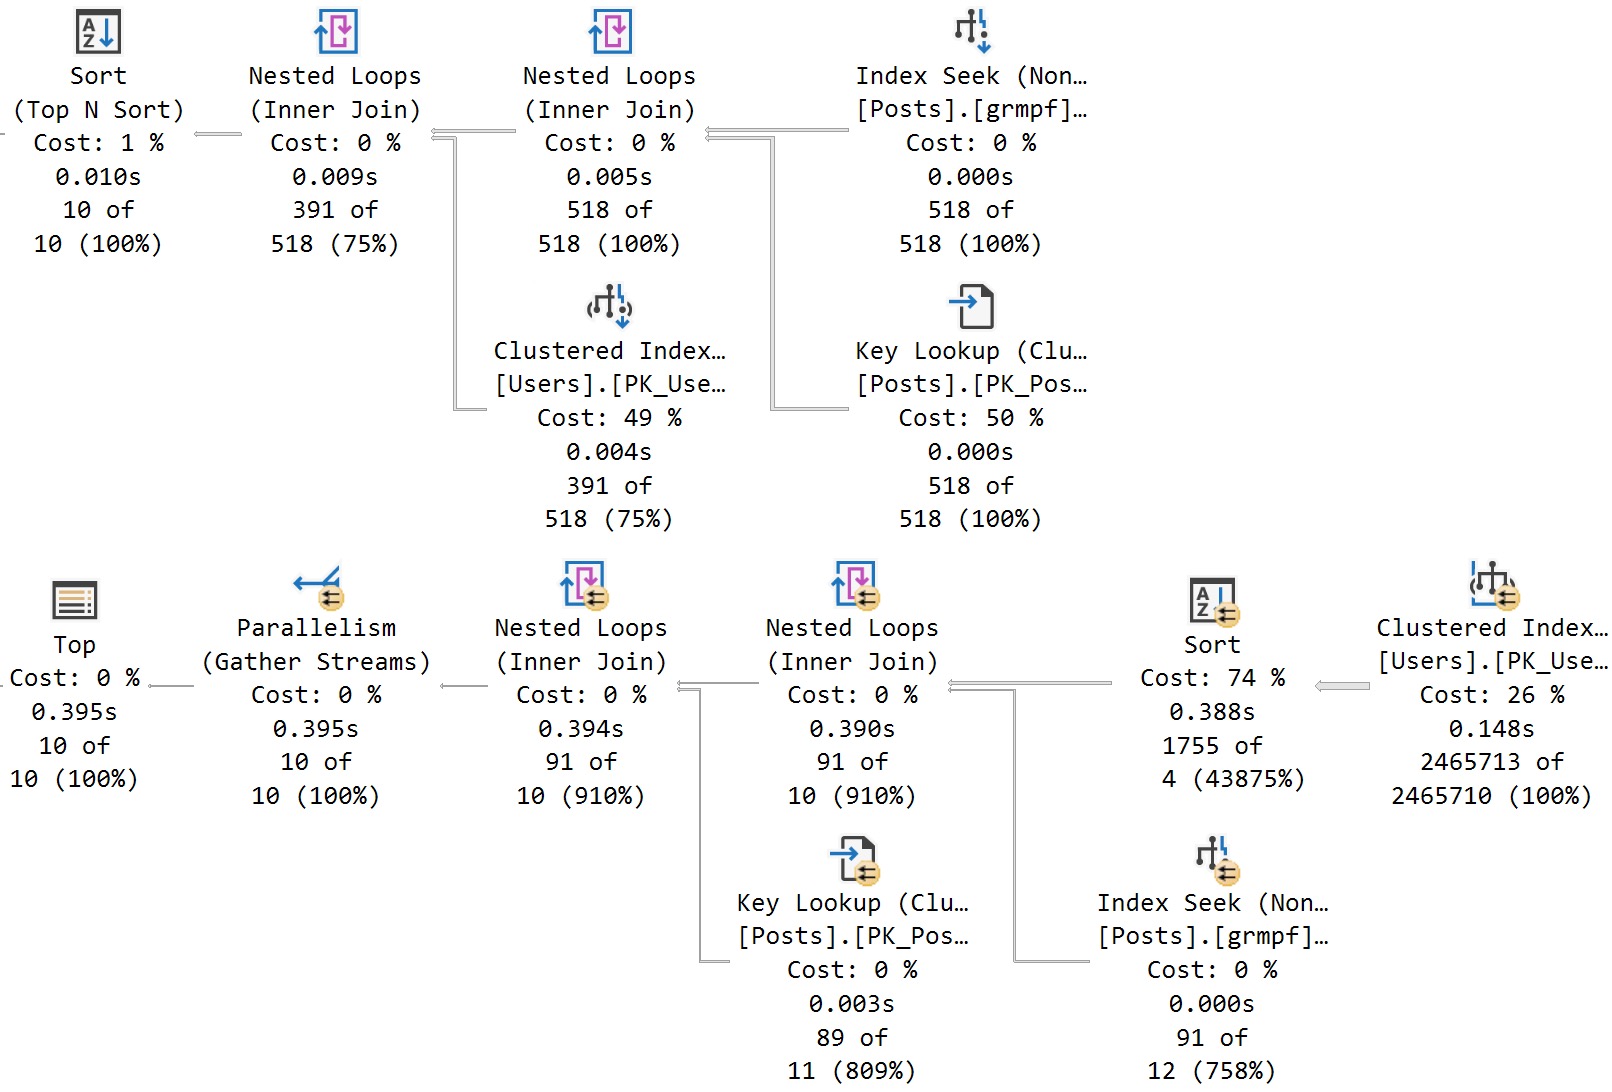
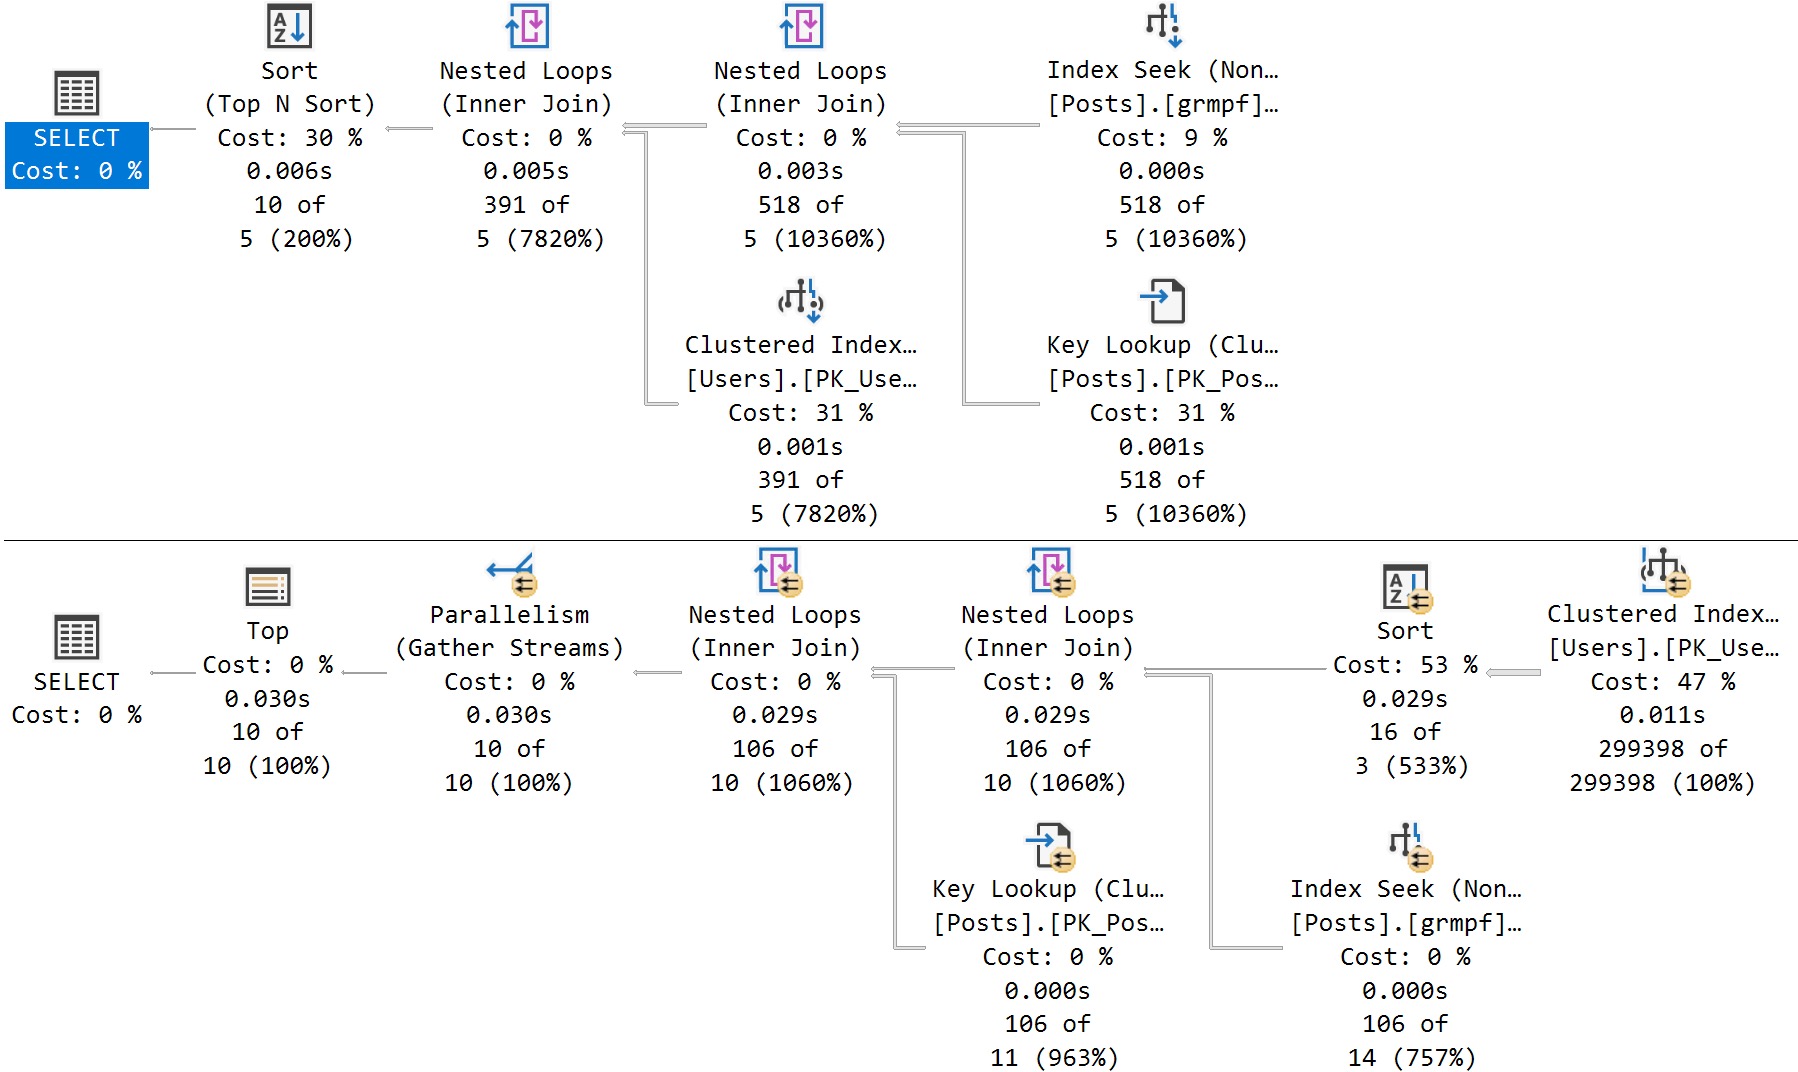
Here’s the cool part! If I run this stored procedure back to back like so, I’ll get two different query plans without recompiling or writing dynamic SQL, or anything else:
EXEC dbo.SQL2022
    @ParentId = 184618;
GO

EXEC dbo.SQL2022
    @ParentId = 0;
GO
amazing!
It happens because the queries look like this under the covers:
SELECT TOP (10)
    u.DisplayName,
    p.*
FROM dbo.Posts AS p
JOIN dbo.Users AS u
    ON p.OwnerUserId = u.Id
WHERE p.ParentId = @ParentId
ORDER BY u.Reputation DESC
OPTION (PLAN PER VALUE(QueryVariantID = 1, predicate_range([StackOverflow2010].[dbo].[Posts].[ParentId] = @ParentId, 100.0, 1000000.0)))

SELECT TOP (10)
    u.DisplayName,
    p.*
FROM dbo.Posts AS p
JOIN dbo.Users AS u
    ON p.OwnerUserId = u.Id
WHERE p.ParentId = @ParentId
ORDER BY u.Reputation DESC
OPTION (PLAN PER VALUE(QueryVariantID = 3, predicate_range([StackOverflow2010].[dbo].[Posts].[ParentId] = @ParentId, 100.0, 1000000.0)))
Where Things Break Down
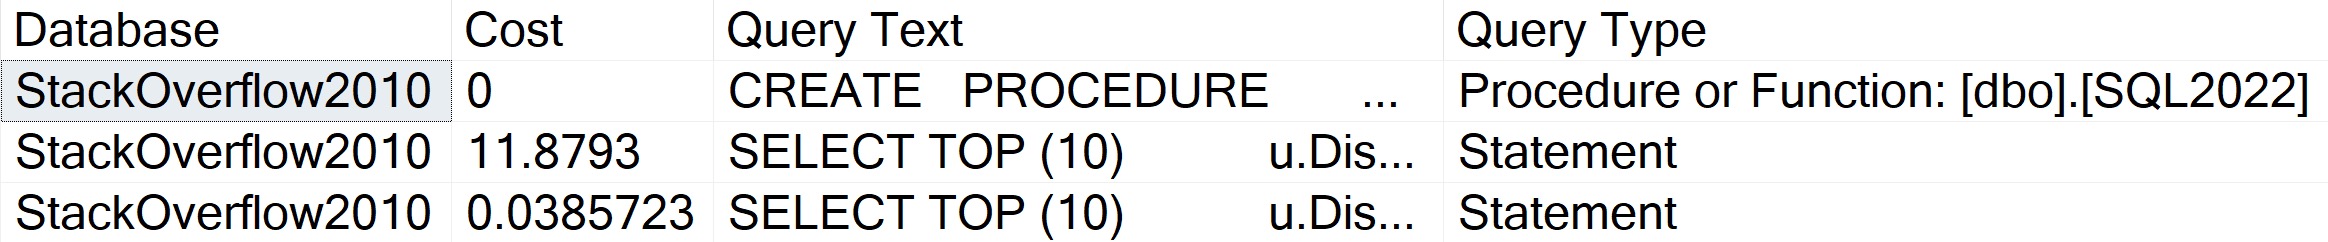
Normally, sp_BlitzCache will go through whatever statements it picks up and associate them with the parent object:
But it doesn’t do that here, it just says that they’re regular ol’ statements:
do i know you?
The way that it attempts to identify queries belonging to objects is like so:
RAISERROR(N'Attempting to get stored procedure name for individual statements', 0, 1) WITH NOWAIT;
UPDATE  p
SET     QueryType = QueryType + ' (parent ' +
                    + QUOTENAME(OBJECT_SCHEMA_NAME(s.object_id, s.database_id))
                    + '.'
                    + QUOTENAME(OBJECT_NAME(s.object_id, s.database_id)) + ')'
FROM    ##BlitzCacheProcs p
        JOIN sys.dm_exec_procedure_stats s ON p.SqlHandle = s.sql_handle
WHERE   QueryType = 'Statement'
AND SPID = @@SPID
OPTION (RECOMPILE);
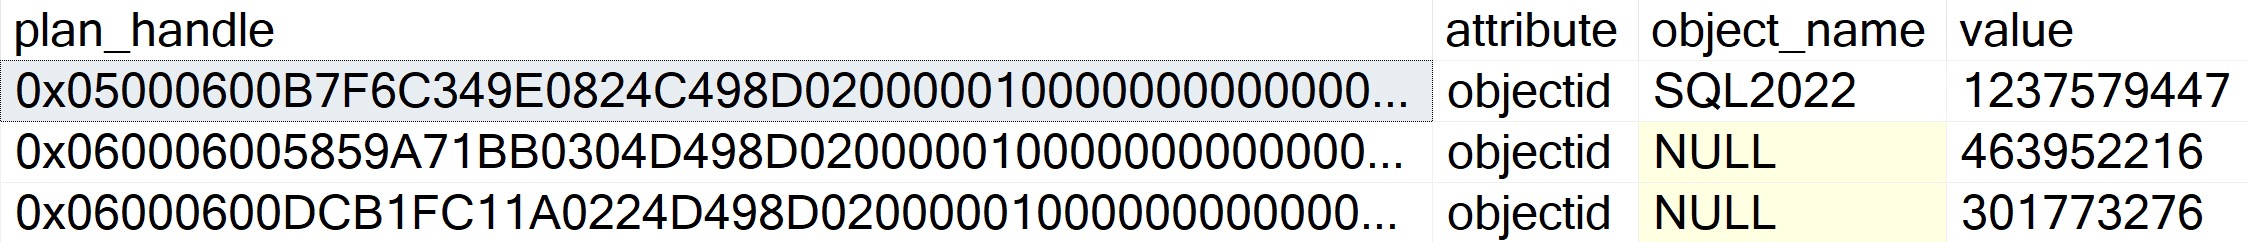
Since SQL handles no longer match, we’re screwed. I also looked into doing something like this, but there’s nothing here!
SELECT
    p.plan_handle,
    pa.attribute,
    object_name =
        OBJECT_NAME(CONVERT(int, pa.value)),
    pa.value
FROM
(
    SELECT 0x05000600B7F6C349E0824C498D02000001000000000000000000000000000000000000000000000000000000 --Proc plan handle
    UNION ALL
    SELECT 0x060006005859A71BB0304D498D02000001000000000000000000000000000000000000000000000000000000 --Query plan handle
    UNION ALL
    SELECT 0x06000600DCB1FC11A0224D498D02000001000000000000000000000000000000000000000000000000000000 --Query plan handle
) AS p (plan_handle)
CROSS APPLY sys.dm_exec_plan_attributes (p.plan_handle) AS pa
WHERE pa.attribute = 'objectid';
The object identifiers are 0 for these two queries.
One Giant Leap
This isn’t a complaint as much as it is a warning. If you’re a monitoring tool vendor, script writer, or script relier, this is gonna make things harder for you.
Perhaps it’s something that can or will be fixed in a future build, but I have no idea at all what’s going to happen with it.
Maybe we’ll have to figure out a different way to do the association, but stored procedures don’t get query hashes or query plan hashes, only the queries inside it do.
This is gonna be a tough one!
Thanks for reading!
Going Further
If this is the kind of SQL Server stuff you love learning about, you’ll love my training. I’m offering a 75% discount to my blog readers if you click from here. I’m also available for consulting if you just don’t have time for that and need to solve performance problems quickly.
Well, okay. But we can try to get it working on our own. Usually I use this method to figure out what parameters a new thing requires to run.
Not this time!
Trial And Error
What I usually do is stick NULL or DEFAULT after the EXEC to to see what comes back. Sometimes using a number or something makes sense too, but whatever.
This at least helps you figure out:
Number of parameters
Expected data types
Parameter NULLability
Etc. and whenceforth
Eventually, I figured out that sp_copy_data_in_batches requires two strings, and that it expects those strings to exist as tables.
The final command that ended up working was this. Note that there is no third parameter at present to specify a batch size.
sp_copy_data_in_batches
    N'dbo.art',
    N'dbo.fart';
Path To Existence
This, of course, depends on two tables existing that match those names.
CREATE TABLE dbo.art(id int NOT NULL PRIMARY KEY);
CREATE TABLE dbo.fart(id int NOT NULL PRIMARY KEY);
One thing to note here is that you don’t need a primary key to do this, but the table definitions do need to match exactly or else you’ll get this error:
Msg 37486, Level 16, State 2, Procedure sp_copy_data_in_batches, Line 1 [Batch Start Line 63]
'sp_copy_data_in_batches' failed because column 'id' does not have the same collation,
nullability, sparse, ANSI_PADDING, vardecimal, identity or generated always attribute, CLR type
or schema collection in tables '[dbo].[art]' and '[dbo].[fart]'.
Because GENERATE_SERIES is still a bit rough around the edges, I’m gonna do this the old fashioned way, which turns out a bit faster.
INSERT
    dbo.art WITH(TABLOCK)
(
    id
)
SELECT TOP (10000000)
    id =
        ROW_NUMBER() OVER
        (
            ORDER BY 1/0
        )
FROM sys.messages AS m
CROSS JOIN sys.messages AS m2;
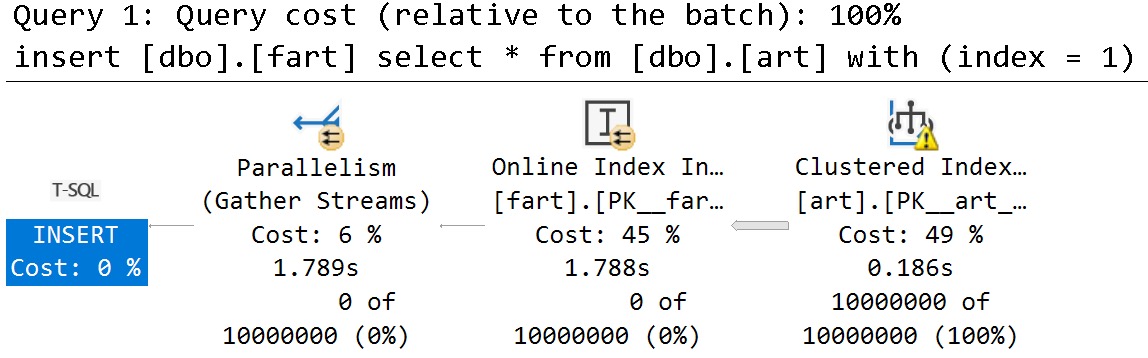
Behind The Scenes
I sort of expected to run some before and after stuff, and see the count slowly increment, but the query plan for sp_copy_data_in_batches just showed this:
wink wink
I’m not really sure what the batching is here.
Also, this is an online index operation, so perhaps it won’t work in Standard Edition. If there even is a Standard Edition anymore?
Has anyone heard from Standard Edition lately?
Thanks for reading!
Going Further
If this is the kind of SQL Server stuff you love learning about, you’ll love my training. I’m offering a 75% discount to my blog readers if you click from here. I’m also available for consulting if you just don’t have time for that and need to solve performance problems quickly.