Putting Spinlocks In Perspective In SQL Server

Get Around


The more people want to avoid fixing what’s really wrong with their server, the more they go out and find all the weird stuff that they can blame on something else (usually the product), or keep doing the same things that aren’t fixing the problem.

Spinlocks are one of those things. People will measure them, stare at them, Google them, and have no idea what to make of them, all while being sure there’s something going on with them.

I don’t want to discount when spinlocks can actually cause a problem, but you shouldn’t treat every performance problem like it’s a bridge too far from what you can solve.

Before you go ignoring all the other things that are going wrong, here’s a simple script to give you some idea if you need to follow the spinlock trail any further. Note that it might also be worth replacing the s.spins sort order with s.spins_per_collision, too.

Which sort order you choose long-term will depend on which yields numbers of interest on your system, which I can’t predict. Sorry about that.

SELECT TOP (20)
    days_uptime = 
        CONVERT(decimal(38,2), d.seconds_uptime / 86400.),
    rundate = 
        SYSDATETIME(),
    s.name,
    s.collisions,
    collisions_per_second = 
        CONVERT(bigint, s.collisions / d.seconds_uptime),
    s.spins,
    spins_per_second = 
        CONVERT(bigint, s.spins / d.seconds_uptime),
    s.spins_per_collision,
    spins_per_collision_per_second = 
        CONVERT(decimal(38,6), s.spins_per_collision / d.seconds_uptime),
    s.sleep_time,
    sleep_time_per_second = 
        CONVERT(bigint, s.sleep_time / d.seconds_uptime),
    s.backoffs,
    backoffs_per_second = 
        CONVERT(bigint, s.backoffs / d.seconds_uptime)
FROM sys.dm_os_spinlock_stats AS s 
CROSS JOIN
(
    SELECT 
        seconds_uptime = 
            DATEDIFF
            (
                SECOND, 
                d.sqlserver_start_time, 
                SYSDATETIME()
            )
    FROM sys.dm_os_sys_info AS d
) AS d
ORDER BY s.spins DESC;

Telltale


I understand that some spinlocks tend to happen in storms, and that this isn’t going to help to illuminate many situations when run in isolation. Bursty workloads, or workloads that only hit some crazy amount of spinlocks during shorter periods of high activity might escape it.

It can help you put the number of spinlocks you’re hitting in perspective compared to uptime, though.

If you see any numbers in the results that still make you say the big wow at your screen, you can easily log the output to a table every X minutes to gather more detail on when it’s happening.

Once you figure out when any potentially large spikes in spinlocks are occurring, you can match that up with:

  • Any independent query logging you’re doing
  • The plan cache, if it’s reliable
  • Query Store, if you’re smart enough to turn it on
  • Your monitoring tool data

Which should tell you which queries were executing at the time. I’d probably look for any high CPU effort queries, since those tend to be the spinlockiest in my experience.

Thanks for reading!

Going Further


If this is the kind of SQL Server stuff you love learning about, you’ll love my training. I’m offering a 75% discount to my blog readers if you click from here. I’m also available for consulting if you just don’t have time for that and need to solve performance problems quickly.
Using Views To Reduce Memory Grants In SQL Server

We All Have It


You know those tables, right? The ones where developers went and got lazy or didn’t know any better and decided every string column was going to be gigantic.

They may have read, of course, that SQL Server’s super-smart variable length data types only consume necessary space.

It’s free real estate.

Except it isn’t, especially not when it comes to query memory grants.

The bigger a string column’s defined byte length is, the bigger the optimizer’s memory grant for it will be.

Memory Grant Primer


In case you need some background, the short story version is:

  • All queries ask for some memory for general execution needs
  • Sorts, Hashes, and Optimized Nested Loops ask for additional memory grants
  • Memory grants are decided based on things like number of rows, width of rows, and concurrently executing operators
  • Memory grants are divided by DOP, not multiplied by DOP
  • By default, any query can ask for up to 25% of max server memory for a memory grant
  • Approximately 75% of max server memory is available for memory grants at one

Needless to say, memory grants are very sensitive to misestimates by the optimizer. Going over can be especially painful, because that memory will most often get pulled from the buffer pool, and queries will end up going to disk more.

Underestimates often mean spills to disk, of course. Those are usually less painful, but can of course be a problem when they’re large enough. In particular, hash spills are worth paying extra attention to.

Memory grant feedback does supply some relief under modern query execution models. That’s a nice way of saying probably not what you have going on.

Query Noogies


Getting back to the point: It’s a real pain in the captain’s quarters to modify columns on big tables, even if it’s reducing the size.

SQL Server’s storage engine has to check page values to make sure you’re not gonna lose any data fidelity in the process. That’ a nice way of saying you’re not gonna truncate any strings.

But if you do something cute like run a MAX(LEN(StringCol) and see what you’re up against, you can use a view on top of your table to assuage SQL Server’s concerns about such things.

After all, functions are temporary. Data types are forever (usually).

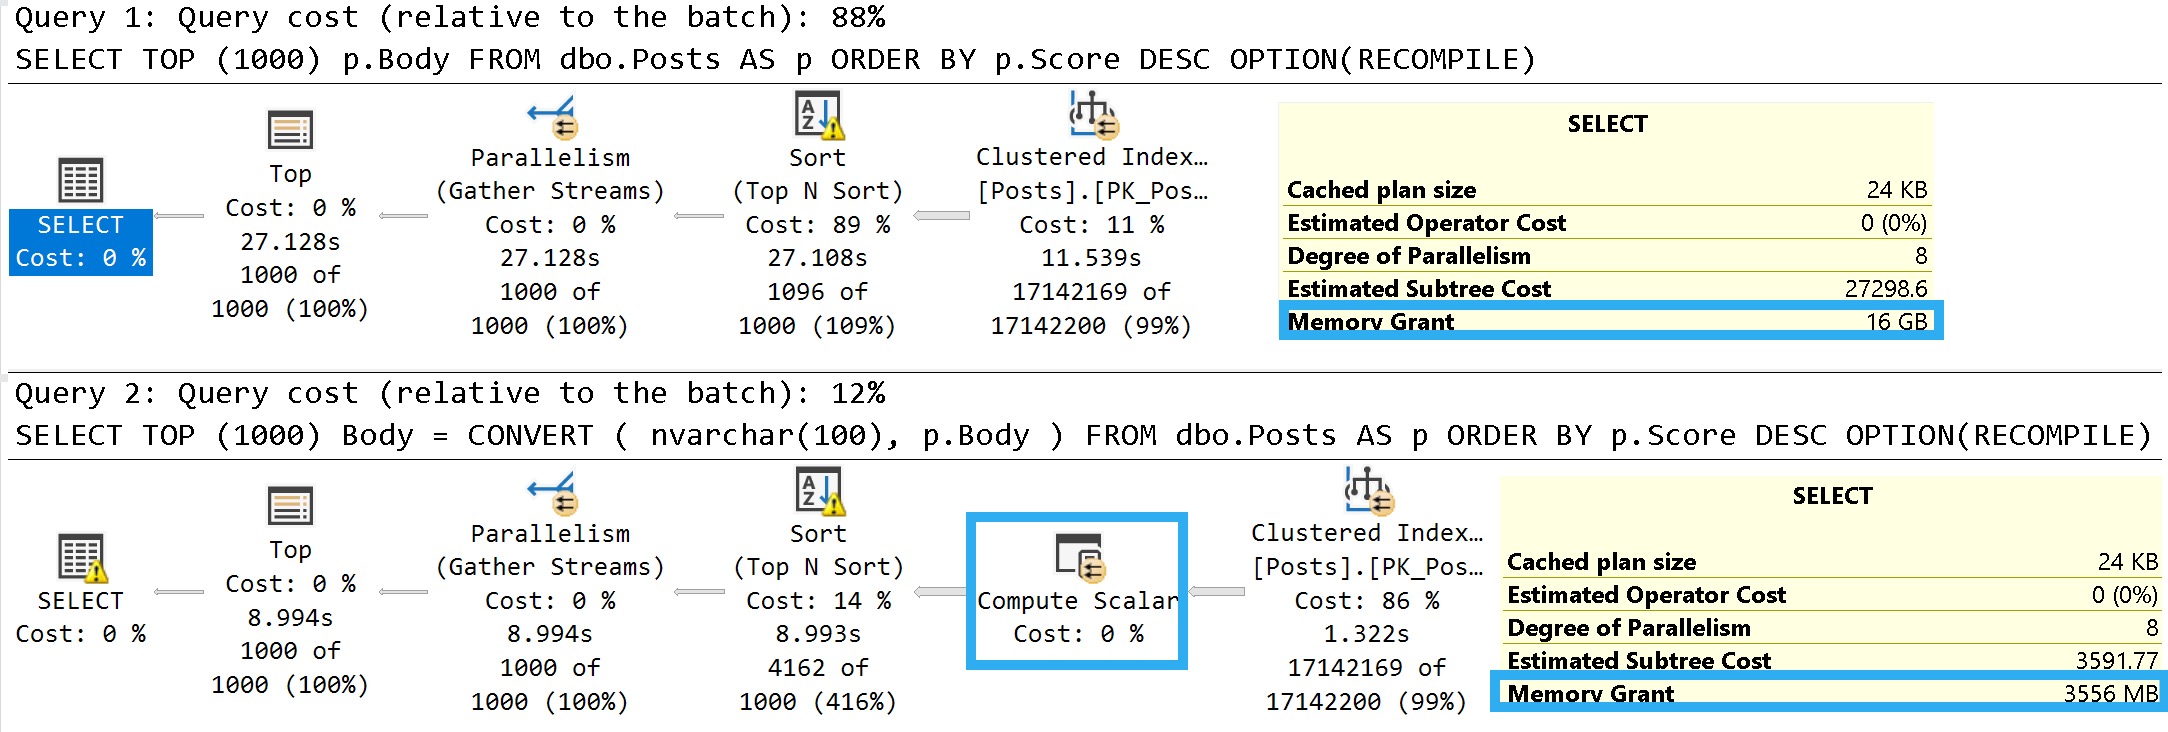
An easy way to illustrate what I mean is to look at the details of these two queries:

SELECT TOP (1000)
    p.Body
FROM dbo.Posts AS p
ORDER BY p.Score DESC
OPTION(RECOMPILE);

SELECT TOP (1000)
    Body = 
        CONVERT
        (
            nvarchar(100), 
            p.Body
        )
FROM dbo.Posts AS p
ORDER BY p.Score DESC
OPTION(RECOMPILE);

Some of this working is dependent on the query plan, so let’s look at those.

Pink Belly Plans


You can ignore the execution times here. The Body column is not a good representation of an oversized column.

It’s defined as nvarchar(max), but (if I’m remembering my Stack lore correctly) is internally limited to 30k characters. Many questions and answers are longer than 100 characters anyway, but on to the plans!

SQL Server Query Plan
janitor

In the plan where the Body column isn’t converted to a smaller string length, the optimizer asks for a 16GB memory grant, and in the second plan the grant is reduced to ~3.5GB.

This is dependent on the compute scalar occurring prior to the Top N Sort operator, of course. This is where the convert function is applied to the Body column, and why the grant is reduced

If you were to build a view on top of the Posts table with this conversion, you could point queries to the view instead. That would get you the memory grant reduction without the pain of altering the column, or moving the data into a new table with the correct definition.

Thanks for reading!

Going Further


If this is the kind of SQL Server stuff you love learning about, you’ll love my training. I’m offering a 75% discount to my blog readers if you click from here. I’m also available for consulting if you just don’t have time for that and need to solve performance problems quickly.
Common SQL Server Consulting Advice: Setting Target Recovery Interval

Everywhere You Look


Finding out about this was probably like when some probably guy probably in a wig or something discovered atoms and was like “ohh wowwe therre are’st atommes ev’rywhislt I doth looketh, happie dais!”.

If that’s not historically accurate, I apologize. I’m a child of divorce and public school systems.

If you want a quick and dirty way to see if your server is having a tough time with checkpoint activity, you can run this to search your most recent error log for relevant messages.

  • If you recently restarted your server, you may need to search additional error logs
  • If you cycle your error logs frequently, you may need to search additional error logs
  • If your server is associated with Cloud Nonsense© these commands may not work
CREATE TABLE 
    #ErikLog
(
    LogDate datetime,
    ProcessInfo varchar(50),
    Text varchar(MAX)
);

INSERT 
    #ErikLog WITH(TABLOCK)
(
    LogDate,
    ProcessInfo,
    Text
)
EXEC sys.xp_readerrorlog 
    0, --Just the first log file
    1, --SQL Server error log
    N'FlushCache'; --Search string

INSERT 
    #ErikLog WITH(TABLOCK)
(
    LogDate,
    ProcessInfo,
    Text
)
EXEC sys.xp_readerrorlog 
    0, --Just the first log file
    1, --SQL Server error log
    N'saturation'; --Search string

SELECT
    el.*
FROM #ErikLog AS el
ORDER BY el.LogDate;

DROP TABLE IF EXISTS
    #ErikLog;

You can adjust the first parameter there to look back at older log files, too, if you need to.

So what happened? Was it everything you imagined?

Did You Find Anything?


If you got some hits searching through the error log, it may be a sign that you need to make a change.

  • Who can change this? You!
  • What change? Target Recovery Interval!
  • Where do I change it? At the database level!
  • When should I change it? Whenever, my friend!
  • Why database level and not at the server level? If your databases are in an AG or something, you want the change to follow them to other servers!
  • How do I change it? Like so!
DECLARE 
    @sql nvarchar(max) = N'';
 
SELECT 
    @sql += 
        N'ALTER DATABASE ' + 
        QUOTENAME(d.name) + 
        N' SET TARGET_RECOVERY_TIME = 60 SECONDS;' + 
        NCHAR(13)
FROM sys.databases AS d 
WHERE d.target_recovery_time_in_seconds <> 60
AND   d.database_id > 4 
AND   d.state = 0 
AND   d.is_in_standby = 0 
AND   d.is_read_only = 0;
 
SELECT 
    cmd = @sql;

Why Are We Doing This?


Long checkpoints can cause all sorts of weirdball issues while they’re happening, and they don’t just happen when you run a checkpoint command.

Log and differential backups cause them, as well as internal stuff around recovery time.

The good news is that this is the default for databases creating on SQL Server 2016 or better. The bad news is that most of you out there started creating your databases way before that, and you’ve just been restoring them to newer versions without checking out any of the hot new gadgets and gizmos available.

Not that I blame you. Stuff like this doesn’t exactly make headlines, and you’re busy with important stuff, like hemming and hawing over fill factor.

Thanks for reading!

Going Further


If this is the kind of SQL Server stuff you love learning about, you’ll love my training. I’m offering a 75% discount to my blog readers if you click from here. I’m also available for consulting if you just don’t have time for that and need to solve performance problems quickly.

Common SQL Server Consulting Advice: Setting Instant File Initialization

Did You Forget?


This is another one of those settings that’s so important, Microsoft put a switch for it in the installer. And yet, I end up looking at servers where it’s not enabled.

When I ask why, I usually expect to hear some 2003 wisdom about security. But that doesn’t happen; it’s just blank stares.

How do you know if this is enabled?

SELECT  
    dss.servicename,
    dss.service_account,
    dss.instant_file_initialization_enabled 
FROM sys.dm_server_services AS dss;

Simple as that.

Why Enable Instant File Initialization?


Turning this on allows SQL Server data files to grow without writing a bunch of zeroes out to disk. That can be useful in a number of ways.

Just picture SQL Server giving disk space a big ol’ hug and Windows not even getting jealous.

But Erik, you said data files, what about all those important transaction log files?

Sorry, there’s no helping them.

Put them on the fastest storage you can get and pray.

Enabling Instant File Initialization


You can use this command from dbatools to enable IFI. If you’re not comfortable with PowerShell, you can get it done this way:

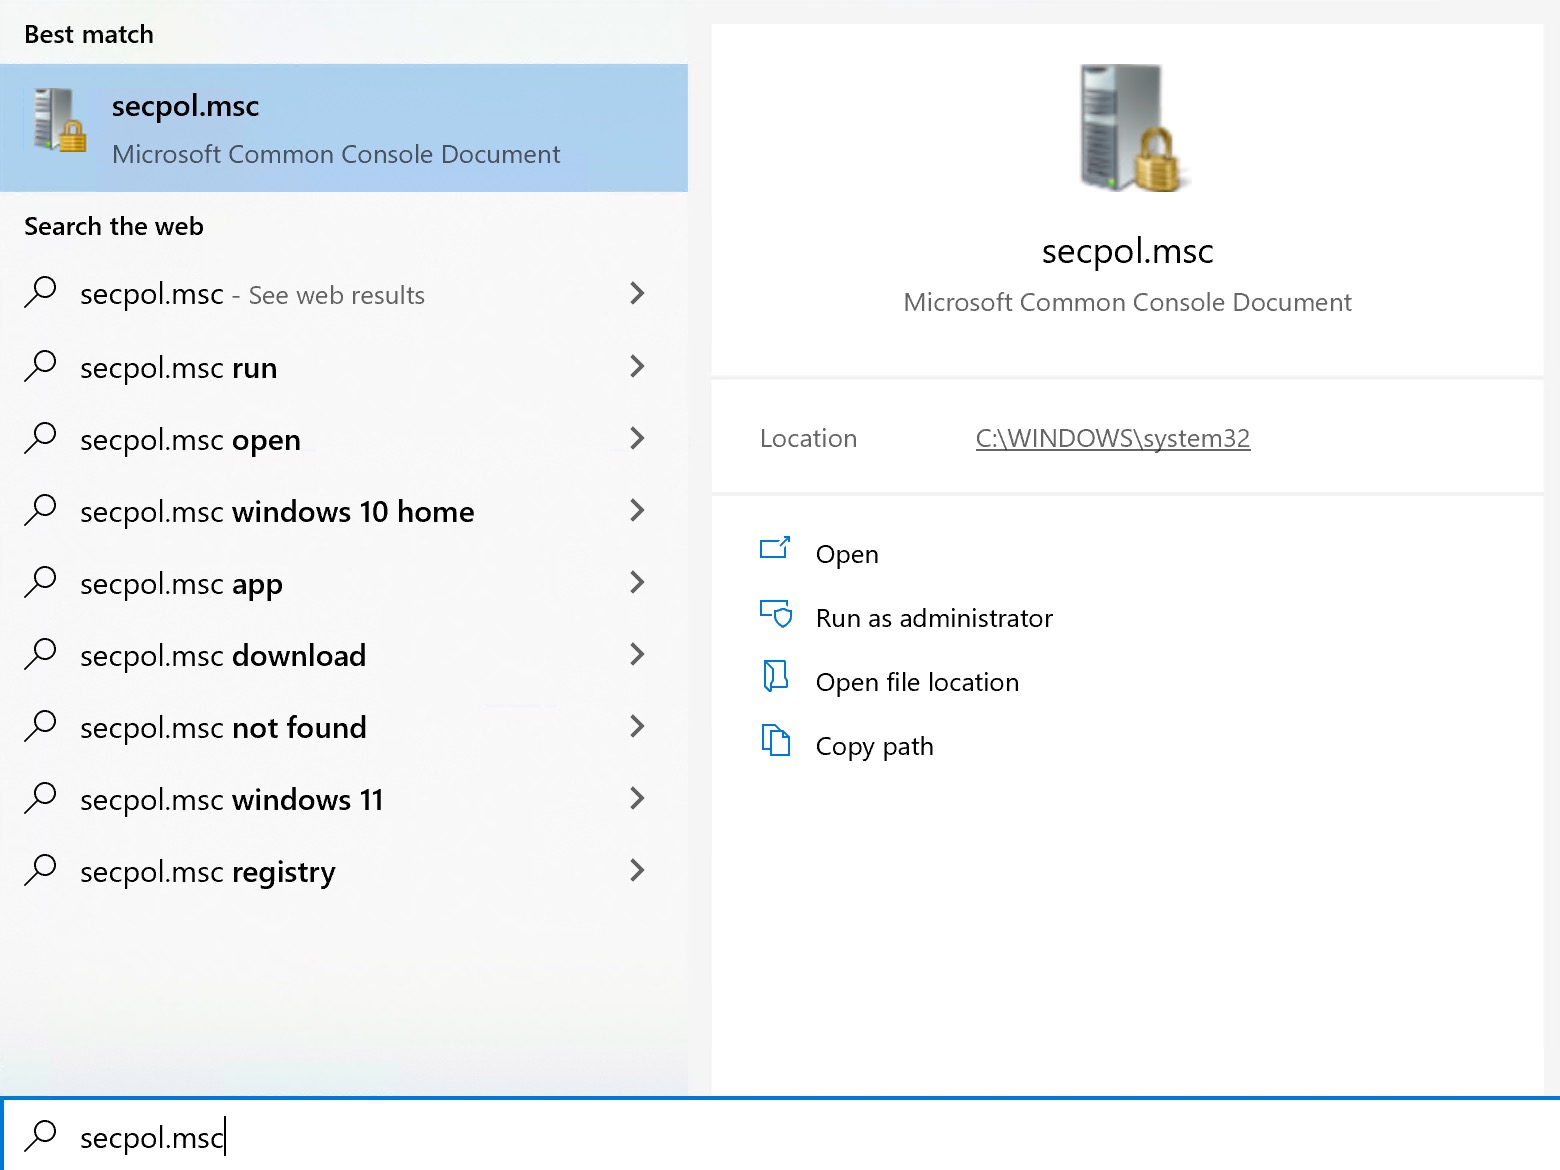
If for some reason you didn’t turn this on when you installed SQL Server, just take the service account you got from up yonder, and type “secpol.msc” into the search bar.

Security Policy
tell somebody

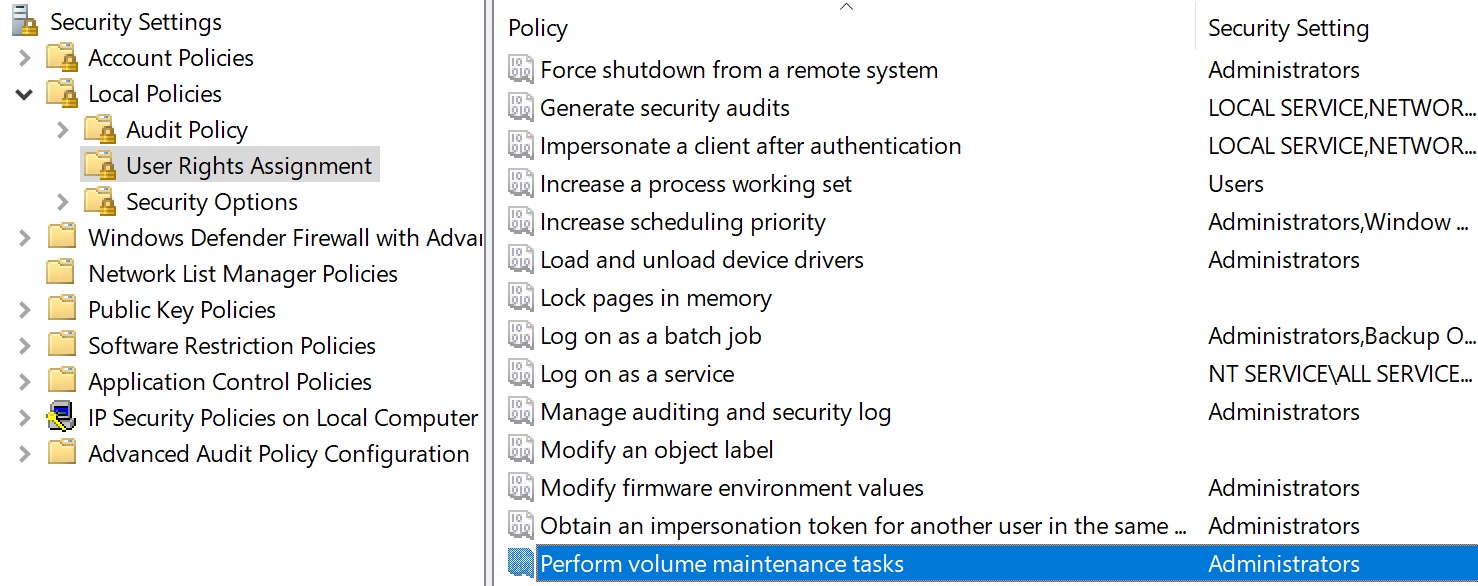
After that, click on “User Rights Assignment” and look for the “Perform Volume Maintenance Tasks” entry in the Policy tab.

Security Policy
no mistake

From there, it’s a matter of adding the service account here. If you’re using the default SQL Server service account, “NT Service\MSSQLSERVER…” it will likely already have it.

But you know, just in case. G’head and click that.

Thanks for reading!

Going Further


If this is the kind of SQL Server stuff you love learning about, you’ll love my training. I’m offering a 75% discount to my blog readers if you click from here. I’m also available for consulting if you just don’t have time for that and need to solve performance problems quickly.
Common SQL Server Consulting Advice: Setting Lock Pages In Memory

Locked Up


It seems lately that every time I get someone to enable lock pages in memory on a server with a lot of memory, things change for the better.

Not because SQL Server is some how holding onto memory better, but because it gets direct access to physical memory without having to muck about with a bunch of virtual memory first. SQL Servers with large amounts of memory can especially benefit from this setting, because it allows them to access memory via a different API. The easy way to think of it is that SQL Server will get direct access to physical memory, instead of virtual memory.

Allocates physical memory pages to be mapped and unmapped within any Address Windowing Extensions (AWE) region of a specified process.

The AllocateUserPhysicalPages function is used to allocate physical memory that can later be mapped within the virtual address space of the process. The SeLockMemoryPrivilege privilege must be enabled in the caller’s token or the function will fail with ERROR_PRIVILEGE_NOT_HELD.

I generally advise people with good chunks of memory to enable this setting. There are very few good reasons not to on big boxes, and that’s why it should be called out in the installation process. Enabling it later means rebooting, and that sucks.

Let’s figure out if we’re using that setting!

SELECT
    locked_page_allocations_gb = 
        CONVERT
        (
            decimal
            (38, 2), 
            dopm.locked_page_allocations_kb / 1024. / 1024.
        ),
    large_page_allocations_gb = 
        CONVERT
        (
            decimal
            (38, 2), 
            dopm.large_page_allocations_kb / 1024. / 1024.
        ),
    memory_model = 
        (
            SELECT 
                dosi.sql_memory_model_desc 
            FROM sys.dm_os_sys_info AS dosi
        )
FROM sys.dm_os_process_memory AS dopm;

This will tell you how many gigs of pages and large pages are currently locked in memory, along with the memory model in use for your server.

Most common are:

  • Conventional (boo, probably)
  • Lock Pages (yay, definitely)

You may see large pages if you use lock pages in memory alongside trace flag 834, but that’s less common.

In my experience, you’ll see large page allocations even without that trace flag if column store indexes are in use. There may be other factors, but that’s what I’ve noticed.

Locked Down


If you’re into PowerShell, you can use this command from dbatools to set “LPIM”.

I usually go in the ol’ fashioned way.

The first thing you need to do is get the login that SQL Server uses. You can get this from:

  • SQL Server Configuration Manager
  • The Services control panel
  • The below query
SELECT  
    dss.servicename,
    dss.service_account
FROM sys.dm_server_services AS dss;

I don’t care which one you use. I think the control panel route is more reliable, because like 9000% of the time when I search the *&^(*&% search bar for configuration manager it can’t find it, and then when it does you get some snap error.

So, services it is. Copy that haughty chieftain down somewhere. Then type “secpol.msc” into the search bar, because somehow Windows can always find that.

Security Policy
tell somebody

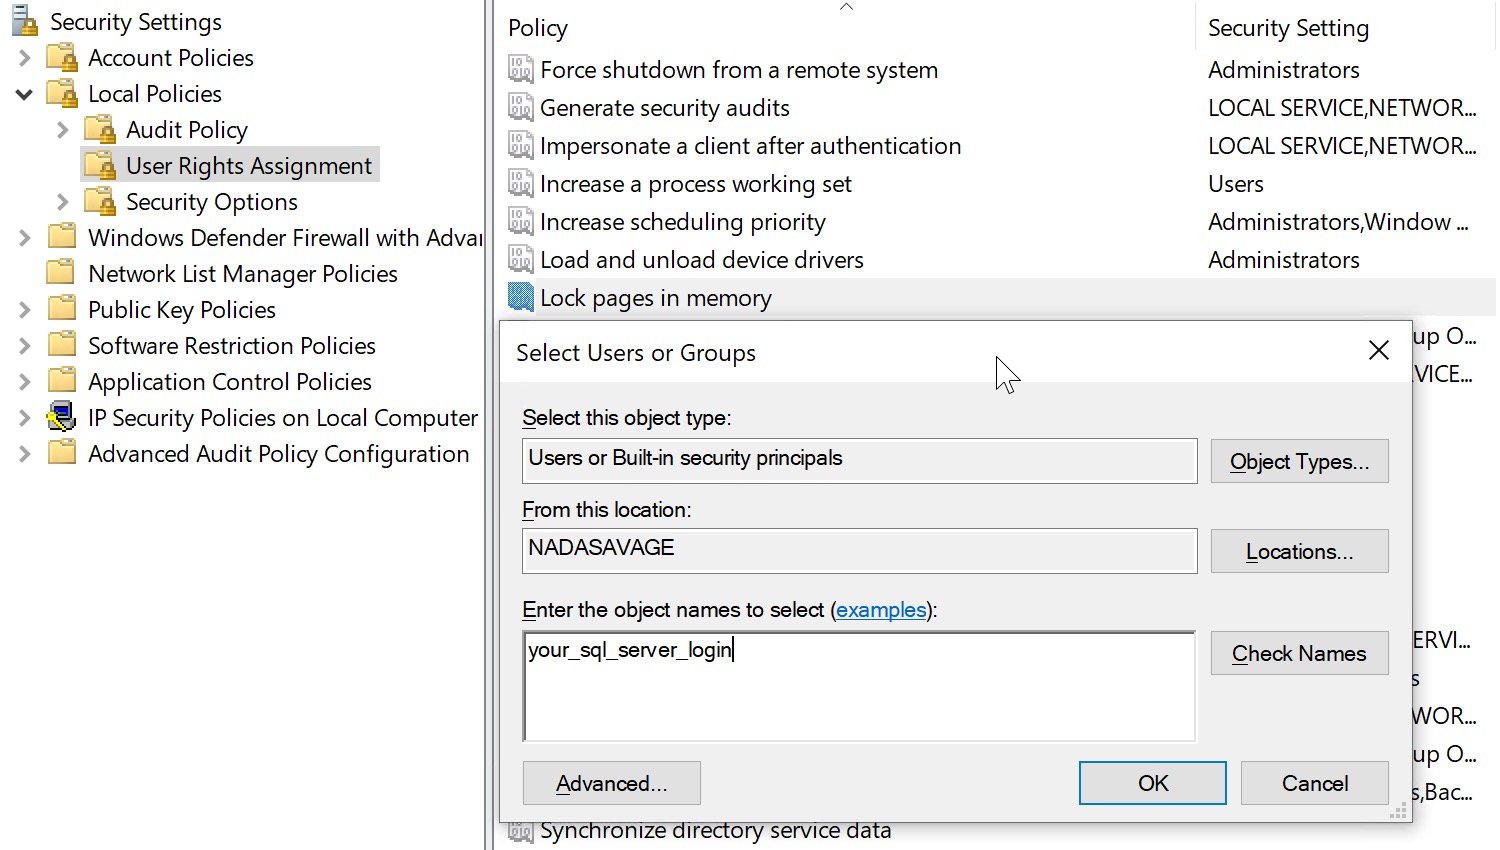
Click on “User Right Assignment”, Then find the “Lock Pages In Memory” entry in the Policy list, and pop your SQL Server login in there.

Security Policy
ride with

Cool. Great. You’re done, right?

Wrong. You need to recycle SQL Server services for it to kick in.

But you can do that whenever, right?

Thanks for reading!

Going Further


If this is the kind of SQL Server stuff you love learning about, you’ll love my training. I’m offering a 75% discount to my blog readers if you click from here. I’m also available for consulting if you just don’t have time for that and need to solve performance problems quickly.

Common SQL Server Consulting Advice: Setting Min Server Memory And Max Server Memory

The Max For The Minimum


I’ve written several hundred thousand times about how important memory is to SQL Server, and to most databases in general. But once you have it, how do you make the most of it?

Well, there’ll be a few posts in this series that cover different ways of doing that, but we’re gonna start with some basic ones that I see folks tinker with in all the wrong ways.

If you don’t know how to change these settings, here are some example commands. Note that the max server memory command is supplied with -1, which will throw an error.

Why? Because this is highly dependent on Local Factors©

EXEC sys.sp_configure
    @configname = 'show advanced options',
    @configvalue = 1;
RECONFIGURE;

EXEC sys.sp_configure
    @configname = 'min server memory (MB)',
    @configvalue = 0;
RECONFIGURE;

EXEC sys.sp_configure
    @configname = 'max server memory (MB)',
    @configvalue = -1;
RECONFIGURE;

Let’s figure out those local factors!

First, let’s get a stupid query to see what you have things set to:

SELECT
    x.name, 
    x.value_gb, 
    x.value_in_use_gb, 
    x.total_physical_memory_gb,
    percent_of_total_memory = 
        (x.value_in_use_gb / x.total_physical_memory_gb) * 100
FROM 
    (
    SELECT
        c.name,
        value_gb = 
            CONVERT
            (
                bigint,
                c.value
            ) / 1024,
        value_in_use_gb = 
            CONVERT
            (
                bigint,
                c.value_in_use
            ) / 1024,
        dosm.total_physical_memory_gb     
    FROM sys.configurations AS c
    CROSS JOIN
    (
        SELECT 
            total_physical_memory_gb = 
                CEILING
                (
                    dosm.total_physical_memory_kb / 1024. / 1024.
                )
        FROM sys.dm_os_sys_memory AS dosm
    ) dosm
    WHERE c.name IN 
    (
        N'min server memory (MB)',
        N'max server memory (MB)'
    )
) AS x;

This will tell you what you have min and max server memory set to, what the total physical memory in the server is, and what percent of the total memory each setting is.

Now that you have those numbers in mind, let’s talk about them.

Min Server Memory


This section can be nice and short: If you have this set to a number other than zero (which is the default, don’t play with me on this one), someone either changed the wrong setting, or took all their goofy pills.

Or both. One thing leads to another, as they say.

There are some weird cases where you might see 16, which shows up on some servers running 64bit versions of SQL Server.

If you see an 8 here, that means you’ve temporarily spawned in the wrong timeline and you need to speak to your handler about being sent back to when 32bit software was acceptable.

The worst case here is having min server memory set equal to max server memory, which prevents SQL Server from using dynamic memory, and can cause all sorts of weird issues. Bottom line: don’t do it.

If the same value is specified for both min server memory and max server memory, then once the memory allocated to the SQL Server Database Engine reaches that value, the SQL Server Database Engine stops dynamically freeing and acquiring memory for the buffer pool.

If you have weird stuff going on with your server, like the plan cache throwing up constantly, queries that are struggling with memory grants, or other oddities, you should check to make sure min server memory is not set to max server memory.

Max Server Memory


Okay, let’s make this creakin’ easy, too. If the percent_of_total_memory column is over 100% then we’re back to the goofy pills theory of database administration.

If it’s a number between 70 and 90%, you’re probably in okay shape. Any lower, and you’re probably doing something asinine like stacking SQL Server instances and we’re back to the goofy pills theory of database administration.

But look, there’s all sorts of stuff you have to think about when you set max server memory in some situations:

  • Is SSAS, SSIS, or SSRS installed?
  • Are you running a workload with column store and/or batch mode components?

I’ve never opened up any SS*S component, so I’m not going to tell you how much memory you should set aside for them. I also don’t want to get in the habit of giving the wrong advice, either. You should install these things on their own server where they can use their own local resources and be much less of a bother to your production workload.

The middle point is becoming more and more of an issue though. Column store indexes and Batch Mode query execution are… different about memory.

You’ll either need to over-provision memory for those workloads, or set max server memory to a lower number than you’d would usually to accommodate them.

Pacer


That’s recap backwards, in case you were wondering.

Hopefully this post gives you a useful query to look at memory settings, and how they compare to the memory your SQL Server has in it.

Tomorrow, we’ll talk about Lock Pages In Memory. It’s one of my favorite settings.

Thanks for reading!

Going Further


If this is the kind of SQL Server stuff you love learning about, you’ll love my training. I’m offering a 75% discount to my blog readers if you click from here. I’m also available for consulting if you just don’t have time for that and need to solve performance problems quickly.

Signs You Need More Memory In Your SQL Server

Guessotron


Most of these signs have to do with wait stats. One could venture out and say that if you have way less memory than data, you need more memory, but… If the server is sitting around bored, who cares?

If we’re going to spend money on memory, let’s make sure it’ll get used. When I’m talking to people with performance problems that memory would solve, here are some of the top reasons.

You’re In The Cloud Where Storage Sucks

Okay, okay, storage can totally suck other places, too. I’ve seen some JBOD setups that would make you cry, and some of them weren’t in the cloud. Where you need to differentiate a little bit here is that memory isn’t going to help slow writes directly. If you add a bunch more memory and free up some network bandwidth for writes by focusing the reads more from the buffer pool, it might.

Look, just avoid disk as much as possible and you’ll be happy.

You’re Using Column Store And/Or Batch Mode

Good column store compression can often rely on adequate memory, but you also need to account for the much larger memory grants that batch mode queries ask for. As more and more workloads move towards SQL Server 2019 and beyond, query memory needs are going to go up because Batch Mode On Row Store will become more common.

You’re Waiting On RESOURCE_SEMAPHORE A Lot

This wait shows up when a bunch of queries are contending for memory grants, but SQL Server has given out all it can. If you run into these a lot, it’s a pretty good sign you need more memory. Especially if you’ve already tuned queries and indexes a bunch, or you’re dealing with a vendor app where they refuse to fix anything.

Other things that might help? The MAX_GRANT_PERCENT hint or Resource Governor

You’re Waiting On RESOURCE_SEMAPHORE_QUERY_COMPILE A Lot

This is another “queue” wait, but it’s for query compilation rather than query execution. Having more memory can certainly help this quite a bit, but so can simplifying queries so that the amount of memory SQL Server has to throw at compiling them chills out a little. You can start by reconsidering those views nested 10 levels deep and the schema design that leads you to needing a 23 table join to construct one row.

You’re Waiting On PAGEIOLATCH_SH Or PAGEIOLATCH_EX A Lot

These waits show up when data pages your query needs aren’t already there. The more you see these, the more latency you’re adding to your workload by constantly shuffling out to disk to get them. Of course, there’s other stuff you can do, like clean up unused and overlapping indexes, compress your indexes, etc. But not everyone is comfortable with or able to do that.

Thanks for reading!

Going Further


If this is the kind of SQL Server stuff you love learning about, you’ll love my training. I’m offering a 75% discount to my blog readers if you click from here. I’m also available for consulting if you just don’t have time for that and need to solve performance problems quickly.

You Probably Don’t Need To Offload SQL Server Reads To Another Server

Moneybags


Duplicating data for reporting, outside of moving it to a data warehouse where there’s some transformations involved, can be an expensive and perilous task.

Your options come down to a native solution like AGs, Replication, or Log Shipping. You can brew something up yourself that relies on native stuff too, like Change Data Capture, Change Tracking, Temporal Tables, or triggers.

Outside of that, you’re getting into the world of SSIS/ADF, other third party vendors, etc. to get data where it ought to go. That’s none of my business, and good luck to you.

As soon as you let people read that data, you have to fully license the SQL Server that it’s sitting on.

Alt Rock


I’ve talked to a few dozen people about this over the years, too. Most were shocked to learn about the licensing implications, thinking that having Software Assurance from Microsoft covered their needs.

The most frequent desire for offloading reads is real-time reporting, and the most frequently cited reason is that reporting queries put too much load on the current server hardware.

You can see where the conflict sits, here. People think they’re getting a free SQL Server to report off of, so they don’t need to up their current hardware and pay for it. Microsoft may be dumb, but it ain’t that dumb.

Once you get people past the licensing issues, tuning the current hardware becomes a more approachable subject.

Gestalt Block


Of course, the idea of tuning the reporting queries has occurred to most people, but the attempts at tuning are usually flailing attempts to solve problems that aren’t there.

  • Maybe this local variable will do a thing for parameter sniffing
  • NOLOCK is better for reports, anyway
  • Don’t forget to recompile, too
  • Add a DISTINCT, there’s too many rows
  • Throw up hands, rebuild indexes

While everything has its place, it’s rare that this combination will get you past all of your performance issues. Reporting queries are especially interesting to me, because of how few people embrace batch mode to any degree for them.

The cost of tuning queries is far cheaper than the cost of licensing a whole other server, especially for Enterprise Edition customers. If you’re on Standard Edition, you have many other problems. Many, many other problems, standing in the way of scaling and performance issues.

If this is the kind of thing you need help with, drop me a line. This is exactly the kind of thing I do.

Thanks for reading!

Going Further


If this is the kind of SQL Server stuff you love learning about, you’ll love my training. I’m offering a 75% discount to my blog readers if you click from here. I’m also available for consulting if you just don’t have time for that and need to solve performance problems quickly.

Why Reporting Tables Aren’t A Great Idea In SQL Server Databases

Headway


I’ve seen a lot of crazy ways for people to run reports on live data, but one of the worst ideas is creating a reporting table based on the set of data a user wants, and then letting them query that data.

Here’s why:

  • You still have to run the query to populate them, which hits the server with load you’re adverse to
  • The buffer pool gets taken up by all these reporting tables, which only one person uses
  • It’s hard to index the reporting tables, and column store isn’t useful on Standard Edition
  • They get stale quickly, and refreshing them means re-running the original query, or
  • A dynamic Merge statement, because no two tables will have the same columns
  • Generic reporting tables will often use the wrong data types for columns and be very wide

Put all that together, and you’ve got a pretty bad solution for your server and your users.

Money Talks


I’m gonna say that there are better ways to do this, and I’m gonna be right, but they’re all gonna take work and/or money.

The ones that take money are reporting off a copy of the data, which you can do with Availability Groups, Replication, or Log Shipping. You have to fully license the other server that you’re reading from no matter which you choose.

I have no interest in deep-diving into any one of those here, but I’m gonna generalize a little bit to make sure you’re not totally in the dark:

  • Availability Groups are easy to set up, sometimes complicated to manage and patch, and require databases in full recovery model, but give you pretty up-to-date data on the secondary for users to get at.
  • Replication is a lot like the above, except it makes me way more nervous. Snapshot Replication gets bonus points for allowing you to create different indexes on the subscriber, which AGs and Log Shipping don’t let you do. The freshness of the data does depend on which type of Replication you choose, so choose wisely.
  • Log Shipping just ships transaction log backups, which is pretty dead simple unless you need to deal with servers that can’t directly see each other for whatever reason. Simple is nice, but simple means you’re gonna have to stale data, since you have to kick users out to restore more transaction logs.

Manifesto


The solutions that require work are usually ones that you implement locally. I’m not going to talk about data warehouses here, because it’s a lot like the stuff up there, just with ETL in the middle. Or ELT. Whatever.

Getting reporting working from live data usually takes a few steps, depending on your situation:

  • Nonclustered column store indexes if you’re on Enterprise Edition
  • Indexed views if you’re on Standard Edition (I’ll talk more about this in a minute)
  • Enabling snapshot isolation just for reporting queries to not get blocked
  • Tuning the hell out of your report code to not beat the server up too bad

Indexed views have a lot of rules, and if you’re lucky you can get some mileage out of them to speed up aggregations on Standard Edition. You can try using column store, but it’s really severely hobbled on Standard Edition. The DOP two limit is especially a killer in a lot of cases.

All of this is work though, and it at least partially assumes your server can come anywhere near being able to handle the additional workload. If it’s just limping along now, you probably don’t wanna keep throwing straw at Joe Camel.

Out There


What I left out a little bit are tables that everyone can report from, because every time I’ve seen them implemented, it’s been an absolute mess of triggers or periodic data synchronizations that left users unhappy.

Either because their transactional workload slowed way down to keep things up to date synchronously, or because the background process that started out running every 10 minutes beat the crap out of the server every 10 minutes, so now it runs every hour but there’s another Agent job to kill that job if it runs more than five minutes because that means something bad is about to happen.

This is why most of the time, I’m happy to do the work to report off the live data.

Thanks for reading!

Going Further


If this is the kind of SQL Server stuff you love learning about, you’ll love my training. I’m offering a 75% discount to my blog readers if you click from here. I’m also available for consulting if you just don’t have time for that and need to solve performance problems quickly.

Steps For Getting Rid Of NOLOCK Hints In SQL Server Queries

Way Out


Whenever I see people using NOLOCK hints, I try to point out that they’re not a great idea, for various reasons explained in detail all across the internet.

At minimum, I want them to understand that the hint name is the same as setting the entire transaction isolation level to READ UNCOMMITTED, and that the hint name is quite misleading. It doesn’t mean your query takes no locks, it means your query ignores locks taken by other queries.

That’s how you can end up getting incorrect results.

That warning often comes with a lot of questions about how to fix blocking problems so you can get rid of those hints.

After all, if you get rid of them, your SQL Server queries will (most likely) go back to using the READ COMMITTED isolation level and we all know that read committed is a garbage isolation level, anyway.

Cause and Wrecked


An important thing to understand is why the hint was used in the first place. I’ve worked with some nice developers who slapped it on every query just in case.

There was no blocking or deadlocking. They just always used it, and never stopped.

Not that I blame them; the blocking that can occur under read committed the garbage isolation level is plain stupid, and no respectable database platform should use it as a default.

In many ways, it’s easier for a user to re-run a query and hopefully get the right result and shrug and mumble something about computers being awful, which is also true.

So, first step: ask yourself if there was ever really a blocking problem to begin with.

Bing Tutsby


Next, we need to understand where the blocking was coming from. Under read committed the garbage isolation level, writers can block readers, and readers can block writers.

In most cases though, people have added the hint to all of their queries, even ones that never participated in blocking.

  • If the problem was writers blocking writers, no isolation can help you.
  • If the problem was readers blocking writers, you may need to look at long running queries with Key Lookups

If the problem was writers blocking readers, you’d have to look at a few things:

If you have query store enabled, you can use sp_QuickieStore to search it for queries that do a lot of writes. If you don’t, you can use sp_BlitzCache to search the plan cache for them.

Best Case


Of course, you can avoid all of these problems, except for writers blocking writers, by using an optimistic isolation level like Read Committed Snapshot Isolation or Snapshot Isolation.

In the past, people made a lot of fuss about turning these on, because

  • You may not have tempdb configured correctly
  • You have queue type code that relied on blocking for correctness

But in reasonably new versions of SQL Server, tempdb’s setup is part of the install process, and the wacky trace flags you used to have to turn on are the default behavior.

If you do have code in your application that processes queues and relies on locking to correctly process them, you’re better off using locking hints in that code, and using an optimistic isolation level for the rest of your queries. This may also be true of triggers that are used to enforce referential integrity, which would need READCOMMITTEDLOCK hints.

The reason why they’re a much better choice than using uncommitted isolation levels is because rather than get a bunch of dirty reads from in-flight changes, you read the last known good version of the row before a modification started.

This may not be perfect, but it will prevent the absolute majority of your blocking headaches. It will even prevent deadlocks between readers and writers.

No, Lock


If your code has a lot of either NOLOCK hints or READ UNCOMITTED usage, you should absolutely be worried about incorrect results.

There are much better ways to deal with blocking, and I’ve outlined some of them in this post.

Thanks for reading!

Going Further


If this is the kind of SQL Server stuff you love learning about, you’ll love my training. I’m offering a 75% discount to my blog readers if you click from here. I’m also available for consulting if you just don’t have time for that and need to solve performance problems quickly.