SQL Server 2022: Cardinality Estimation Feedback

Quiet As Kept


I’ve been trying to take the general temperature when it comes to SQL Server 2022. At least from a performance perspective, some interesting things have been introduced so far.

There have been a few neat things:

  • Parameter Sensitive Plan optimizations
  • Query Store Hints
  • Memory Grant Feedback improvements
  • DOP Feedback
  • Cardinality Estimation Feedback

I’m not seeing a whole lot out there. I’m not sure why. I follow quite a few SQL bloggers via Feedly.

Perhaps it’s just too new. Maybe everyone is waiting for CTP SP1.

Well, anyway. In this post I want to talk a little bit about what Cardinality Estimation Feedback can do, and what it can’t do.

What It Do


First, you need Query Store enabled to get this to work. It relies on the Query Store Plan hints also introduced for SQL Server 2022.

For queries that execute frequently and retain cached plans, the optimizer will look at some of the assumptions that get made under different Cardinality Estimation models.

Things like:

  • Row Goals
  • Predicate independence/correlation
  • Join containment being simple or base

What each of those things means isn’t terribly important to the post, but all of them are things that are influenced by using the legacy or default cardinality estimators.

As I understand it, this is a bit like Memory Grant Feedback. If estimation issues are detected, a different plan will be attempted. If that plan corrects a performance issue, then the hint will get persisted in Query Store.

Pretty cool, but…

What It Don’t Do


It doesn’t fix things while they’re running, like Adaptive Joins can do. That’s sort of unfortunate! Hear me out on why.

Often, when model errors are incorrect, queries run for a long time. Particularly when row goals are introduced, query plans are quite sensitive to those goals not being met quickly.

It’d be really unfortunate for you to sit around waiting for 15-16 executions of a poor performing query to finish executing before an intervention happens.

I would have either:

  • Reduced, or made this threshold configurable
  • Been more aggressive about introducing Adaptive Joins when CE models influence plan choices

After all, Adaptive Joins help queries at runtime rather than waiting for an arbitrary number of executions and then stepping in.

Perhaps there was a good reason for not doing this, but those were the first two things to cross my mind when looking into the feature.

How It Do


I was able to get the feature to kick in using a familiar query.

Here’s the setup script:

DBCC FREEPROCCACHE;
ALTER DATABASE 
    StackOverflow2010 
SET 
    QUERY_STORE CLEAR;
GO

    CREATE INDEX whatever 
        ON dbo.Votes(CreationDate, VoteTypeId, PostId);
    
    CREATE INDEX apathy
        ON dbo.Posts (PostTypeId)
            INCLUDE (OwnerUserId, Score, Title);
GO

    SELECT TOP (2500) 
        p.OwnerUserId, 
        p.Score, 
        p.Title, 
        v.CreationDate,
        ISNULL(v.BountyAmount, 0) AS BountyAmount
    FROM dbo.Posts AS p
    JOIN dbo.Votes AS v
        ON  p.Id = v.PostId
    WHERE v.VoteTypeId = 1
    AND   p.PostTypeId = 1
    ORDER BY v.CreationDate DESC;
    GO 17

SELECT qspf.* FROM sys.query_store_plan_feedback AS qspf;

SELECT qsqh.* FROM sys.query_store_query_hints AS qsqh;

For the first 16 runs, we get the same query plan that takes about 2 seconds.
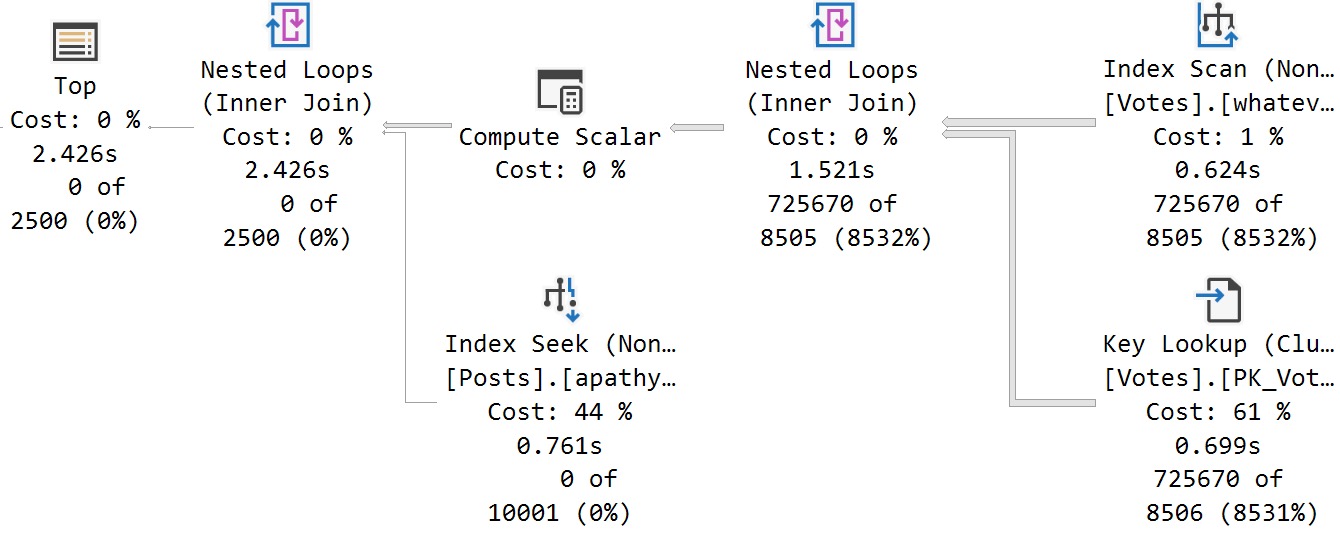
SQL Server Query Plan
if you got a problem

Then, magically, on run #17, we get a different query plan!
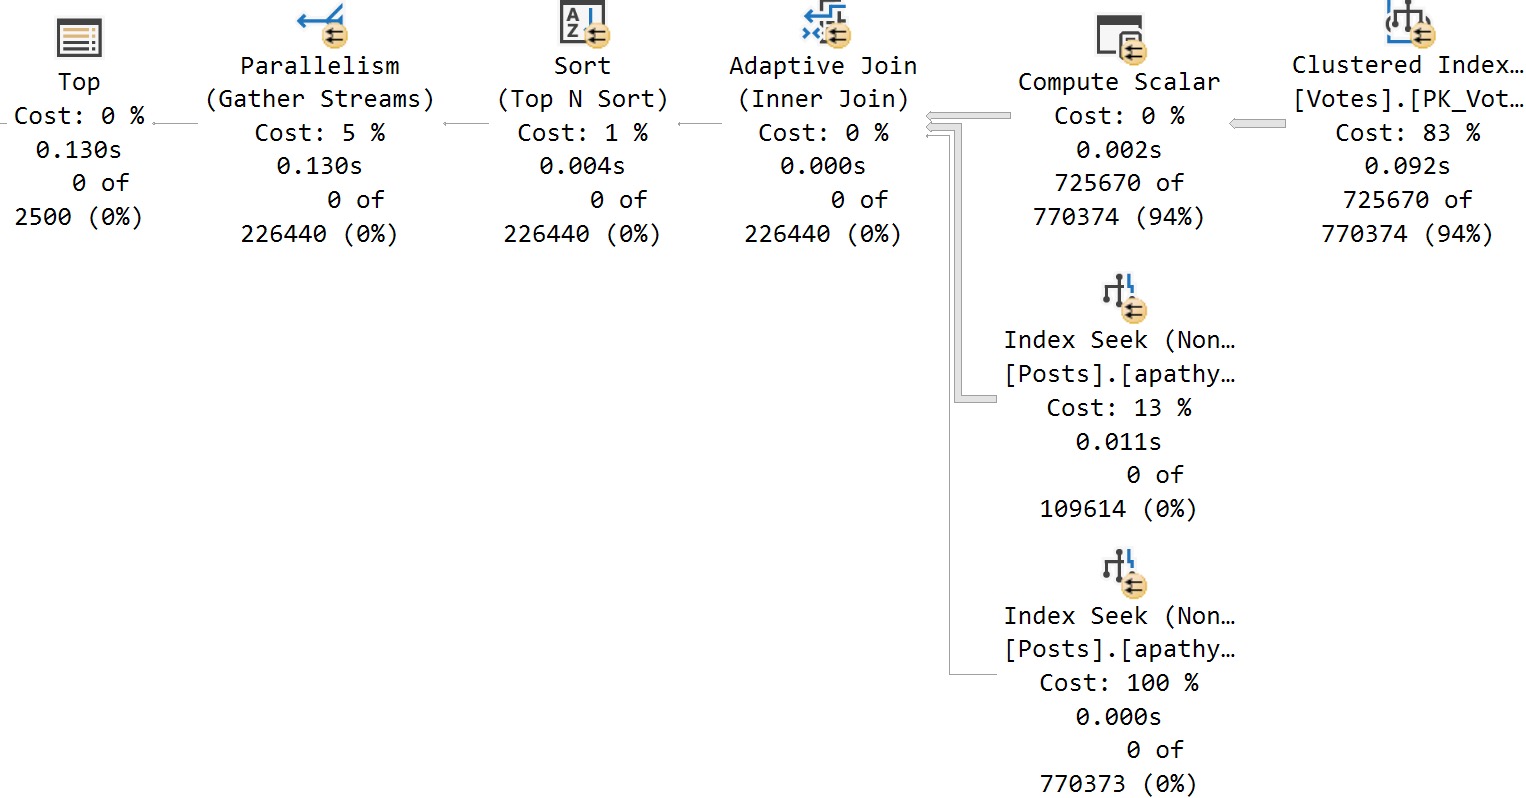
SQL Server Query Plan
yo i’ll solve it

Pretty cool! The plan totally changed, and clearly got better. I am happy about this. Not so happy that it would have taken 16 executions of a Potentially Painful© query to get here, but you know.

Here we are.

In Query Store


There are a couple views that will detail where hints came from and which were applied:

SQL Server Query Results
clowny clown clown

Since I just cleared out query store prior to this running, we can infer some things:

  • CE Feedback kicked in and gave us a new plan with a hint to disable row goals
  • The second plan generated was identified by the engine as needing memory grant feedback

I suppose this is a good reason to do some work on sp_QuickieStore so y’all can see this stuff in action.

Thanks for reading!

Going Further


If this is the kind of SQL Server stuff you love learning about, you’ll love my training. I’m offering a 75% discount to my blog readers if you click from here. I’m also available for consulting if you just don’t have time for that and need to solve performance problems quickly.
What Do Optimizer Timeouts Really Mean In SQL Server Query Plans?

Time Is On My Side


Whenever I’m looking over query plans with clients, their eyes get drawn towards many things that I’ve learned to ignore over the years.

It’s not that they’re never important, it’s just that, you know… There’s usually more important stuff.

One of those things is compilation timeouts. Most people think that it’s time-based, and it means that their query timed out or took a long time to compile.

Not so! It’s purely a set number of steps the optimizer will take to figure out things like:

  • Join order
  • Join/Aggregate type
  • Index usage
  • Seeks vs Scans
  • Parallelism

And probably some other stuff that I just don’t have the Friday afternoon energy to think about any more.

But anyway, the point is that it’s not a sign that your query timed out, or even that plan compilation took a long time.

The initial number of steps allowed is based on the optimizer’s assessment of statement complexity, which includes the number of joins (of course), in case you were wondering.

From there each additional stage gets a set number of steps based on the number of steps that the previous stage took.

Plan Cache Script


You can use this script to look in your plan cache for plans that the optimizer has marked as having a timeout.

WITH 
    XMLNAMESPACES
(
    DEFAULT 'http://schemas.microsoft.com/sqlserver/2004/07/showplan'
)
SELECT
    query_text = 
        SUBSTRING
        (
            st.text,
            qs.statement_start_offset / 2 + 1,
            CASE qs.statement_start_offset
                 WHEN -1 
                 THEN DATALENGTH(st.text)
                 ELSE qs.statement_end_offset
            END - qs.statement_start_offset / 2 + 1
        ),
    compile_time_ms = 
        qs.query_plan.value('(//StmtSimple/QueryPlan/@CompileTime)[1]', 'bigint'),
    compile_cpu_ms = 
        qs.query_plan.value('(//StmtSimple/QueryPlan/@CompileCPU)[1]', 'bigint'),
    compile_memory_mb = 
        qs.query_plan.value('(//StmtSimple/QueryPlan/@CompileMemory)[1]', 'bigint') / 1024.,
    qs.query_plan,
    qs.execution_count,
    qs.total_worker_time,
    qs.last_execution_time
FROM
(
    SELECT TOP (10)
        qs.plan_handle,
        qs.sql_handle,
        qs.statement_start_offset,
        qs.statement_end_offset,
        qs.last_execution_time,
        qs.execution_count,
        qs.total_worker_time,
        qp.query_plan
    FROM sys.dm_exec_query_stats AS qs
    CROSS APPLY sys.dm_exec_query_plan(qs.plan_handle) AS qp
    WHERE qp.query_plan.exist('//StmtSimple/@StatementOptmEarlyAbortReason[.="TimeOut"]') = 1
    ORDER BY
        total_worker_time / qs.execution_count DESC
) AS qs
CROSS APPLY sys.dm_exec_sql_text(qs.sql_handle) AS st;

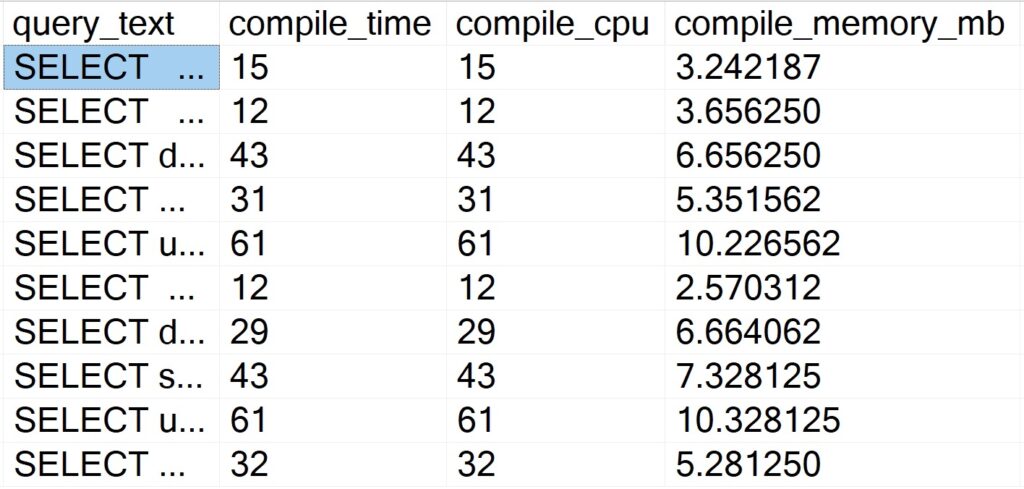
There’s not a whole lot of sense to this query other than to prove a point. Here are some abridged results from a client system:

SQL Server Query Results
amanaplanacanalpanama

Despite all of these queries “timing out” during optimization phases, the longest compile time is 61 milliseconds.

Query Store Script


Like above, there’s not a lot of sense to this one. It is nice to be able to skip some of the additional XML shredding and go to some of the plan metadata stored in Query Store:

WITH 
    XMLNAMESPACES
(
    DEFAULT 'http://schemas.microsoft.com/sqlserver/2004/07/showplan'
),
    queries
AS
    (
        SELECT TOP (101)
            parent_object_name = 
                ISNULL
                (
                    OBJECT_NAME(qsq.object_id), 
                    'No Parent Object'
                ),
            qsqt.query_sql_text,
            query_plan = 
                TRY_CAST(qsp.query_plan AS xml),
            qsrs.last_execution_time,
            qsrs.count_executions,
            qsrs.avg_duration,
            qsrs.avg_cpu_time,
            avg_compile_duration_ms = 
                qsq.avg_compile_duration / 1000.,
            avg_compile_memory_mb = 
                qsq.avg_compile_memory_kb / 1024.,
            avg_optimize_cpu_time_ms = 
                qsq.avg_optimize_cpu_time / 1024.
        FROM sys.query_store_runtime_stats AS qsrs
        JOIN sys.query_store_plan AS qsp
            ON qsp.plan_id = qsrs.plan_id
        JOIN sys.query_store_query AS qsq
            ON qsq.query_id = qsp.query_id
        JOIN sys.query_store_query_text AS qsqt
            ON qsqt.query_text_id = qsq.query_text_id
        WHERE qsrs.last_execution_time >= DATEADD(DAY, -7, SYSDATETIME())
        AND   qsrs.avg_cpu_time >= (10 * 1000)
        AND   qsq.is_internal_query = 0
        AND   qsp.is_online_index_plan = 0
        AND   TRY_CAST(qsp.query_plan AS xml).exist('//StmtSimple/@StatementOptmEarlyAbortReason[.="TimeOut"]') = 1
        ORDER BY
            qsrs.avg_cpu_time DESC
    )
SELECT
    qs.query_sql_text,
    qs.parent_object_name,    
    qs.query_plan,
    qs.avg_compile_duration_ms,
    qs.avg_optimize_cpu_time_ms,
    qs.avg_compile_memory_mb,
    qs.count_executions,
    qs.avg_duration,
    qs.avg_cpu_time,
    qs.last_execution_time
FROM
    queries AS qs
ORDER BY
    qs.avg_cpu_time DESC
OPTION (RECOMPILE);

Also like above, the results bring back very short compile times.

So There


The point of this post was that you don’t need to worry about these timeouts from a plan compilation time perspective.

Of course, it may represent a plan quality issue, but that’s much harder to prove from first glances. You’d need to dig into that on your own Friday afternoon.

If you find user queries experiencing optimizer timeouts, it may solve the problem to simplify them as much as possible. Breaking long queries up into #temp tables is a popular solution for this.

Thanks for reading!

Going Further


If this is the kind of SQL Server stuff you love learning about, you’ll love my training. I’m offering a 75% discount to my blog readers if you click from here. I’m also available for consulting if you just don’t have time for that and need to solve performance problems quickly.

Some Thoughts On Query Store Hints In SQL Server 2022

Young And Old


Query hints seem to get treated like prescription drugs. You hear all the problems they can solve, but then you get a long list of problems they can cause.

“Your cholesterol will be lower, but you might bleed to death from your eyes.”

I use query hints all the time to show people what different (and often better) query plans would look like, and why they weren’t chosen.

Sometimes it’s cardinality estimation, sometimes it’s costing, sometimes there was an optimization timeout, and other times…

Msg 8622, Level 16, State 1, Line 20
Query processor could not produce a query plan because of the hints defined in this query. Resubmit the query without specifying any hints and without using SET FORCEPLAN.

Because, you know, you can’t always get what you want.

Problem Statement


When you’re dealing with untouchable vendor code full of mistakes, ORM queries that God has turned away from, and other queries that for some reason can’t be tinkered with, we used to not have a lot of options.

In SQL Server 2022, Query Store gains a new super power: you can add hints to queries without intercepting the code in some other manner.

This is going to be a game changer in a lot of cases, because you can hint all sorts of useful changes to queries that would otherwise be stuck forever in their current hell.

Of course, not everything is supported. How could it all be? That would be insane.

According to the docs, here’s what’s supported currently:

These query hints are supported as Query Store hints:

{ HASH | ORDER } GROUP   
  | { CONCAT | HASH | MERGE } UNION   
  | { LOOP | MERGE | HASH } JOIN   
  | EXPAND VIEWS   
  | FAST number_rows   
  | FORCE ORDER   
  | IGNORE_NONCLUSTERED_COLUMNSTORE_INDEX  
  | KEEP PLAN   
  | KEEPFIXED PLAN  
  | MAX_GRANT_PERCENT = percent  
  | MIN_GRANT_PERCENT = percent  
  | MAXDOP number_of_processors   
  | NO_PERFORMANCE_SPOOL   
  | OPTIMIZE FOR UNKNOWN  
  | PARAMETERIZATION { SIMPLE | FORCED }   
  | RECOMPILE  
  | ROBUST PLAN   
  | USE HINT   ( '<hint_name>' [ , ...n ] )

And here’s what’s not supported:

The following query hints are currently unsupported:

This is where things get… tough. There aren’t any super-important query hints missing, but not being able to use ANY table hints is bad news for a number of reasons.

Duck Hint


Included in the potential table hints are all these delights:

WITH ( <table_hint> [ [, ]…n ] )
<table_hint> ::=
{ NOEXPAND [ , INDEX ( <index_value> [ ,…n ] ) | INDEX = ( <index_value> ) ]
| INDEX ( <index_value> [ ,…n ] ) | INDEX = ( <index_value> )
| FORCESEEK [ ( <index_value> ( <index_column_name> [,… ] ) ) ]
| FORCESCAN
| FORCESEEK
| HOLDLOCK
| NOLOCK
| NOWAIT
| PAGLOCK
| READCOMMITTED
| READCOMMITTEDLOCK
| READPAST
| READUNCOMMITTED
| REPEATABLEREAD
| ROWLOCK
| SERIALIZABLE
| SNAPSHOT
| SPATIAL_WINDOW_MAX_CELLS = <integer_value>
| TABLOCK
| TABLOCKX
| UPDLOCK
| XLOCK
}
No index hints, no locking hints, no isolation level hints, no access method hints, and… no NOEXPAND hint 😭
The prior being made even more aggravating because EXPAND VIEWS is a query hint.
No one ever expands indexed views.

Gridlock


This feature has me pretty excited for SQL Server 2022. In particular for Entity Framework queries, I can see myself using:

  • FORCE ORDER
  • NO_PERFORMANCE_SPOOL
  • RECOMPILE

Maybe even all together. The more the merrier! Like beans.

I do hope that at some point there is a workaround for some of the table hints getting used, but in 4 years when folks finally start adopting this newfangled version, I’ll have a grand time fixing problems that used to be out of my reach.

Thanks for reading!

Going Further


If this is the kind of SQL Server stuff you love learning about, you’ll love my training. I’m offering a 75% discount to my blog readers if you click from here. I’m also available for consulting if you just don’t have time for that and need to solve performance problems quickly.

SQL Server 2022 Is Going To Mess Up Your Query Monitoring Scripts

At Least For Now


SQL Server 2022 has a new feature in it to help with parameter sensitive query plans.

That is great. Parameter sensitivity, sometimes just called parameter sniffing, can be a real bear to track down, reproduce, and fix.

In a lot of the client work I do, I end up using dynamic SQL like this to get things to behave:

But with this new feature, you get some of the same fixes without having to interfere with the query at all.

How It Works


You can read the full documentation here. But you don’t read the documentation, and the docs are missing some details at the moment anyway.

  • It only works on equality predicates right now
  • It only works on one predicate per query
  • It only gives you three query plan choices, based on stats buckets

There’s also some additional notes in the docs that I’m going to reproduce here, because this is where you’re gonna get tripped up, if your scripts associate statements in the case with calling stored procedures, or using object identifiers from Query Store.

For each query variant mapping to a given dispatcher:

  • The query_plan_hash is unique. This column is available in sys.dm_exec_query_stats, and other Dynamic Management Views and catalog tables.

  • The plan_handle is unique. This column is available in sys.dm_exec_query_statssys.dm_exec_sql_textsys.dm_exec_cached_plans, and in other Dynamic Management Views and Functions, and catalog tables.

  • The query_hash is common to other variants mapping to the same dispatcher, so it’s possible to determine aggregate resource usage for queries that differ only by input parameter values. This column is available in sys.dm_exec_query_statssys.query_store_query, and other Dynamic Management Views and catalog tables.

  • The sql_handle is unique due to special PSP optimization identifiers being added to the query text during compilation. This column is available in sys.dm_exec_query_statssys.dm_exec_sql_textsys.dm_exec_cached_plans, and in other Dynamic Management Views and Functions, and catalog tables. The same handle information is available in the Query Store as the last_compile_batch_sql_handle column in the sys.query_store_query catalog table.

  • The query_id is unique in the Query Store. This column is available in sys.query_store_query, and other Query Store catalog tables.

The problem is that, sort of like dynamic SQL, this makes each different plan/statement impossible to tie back to the procedure.

What I’ve Tried


Here’s a proc that is eligible for parameter sensitivity training:

CREATE OR ALTER PROCEDURE 
    dbo.SQL2022
(
    @ParentId int
)
AS
BEGIN
SET NOCOUNT, XACT_ABORT ON;

    SELECT TOP (10) 
        u.DisplayName, 
        p.*
    FROM dbo.Posts AS p
    JOIN dbo.Users AS u
        ON p.OwnerUserId = u.Id
    WHERE p.ParentId = @ParentId
    ORDER BY u.Reputation DESC;

END;
GO

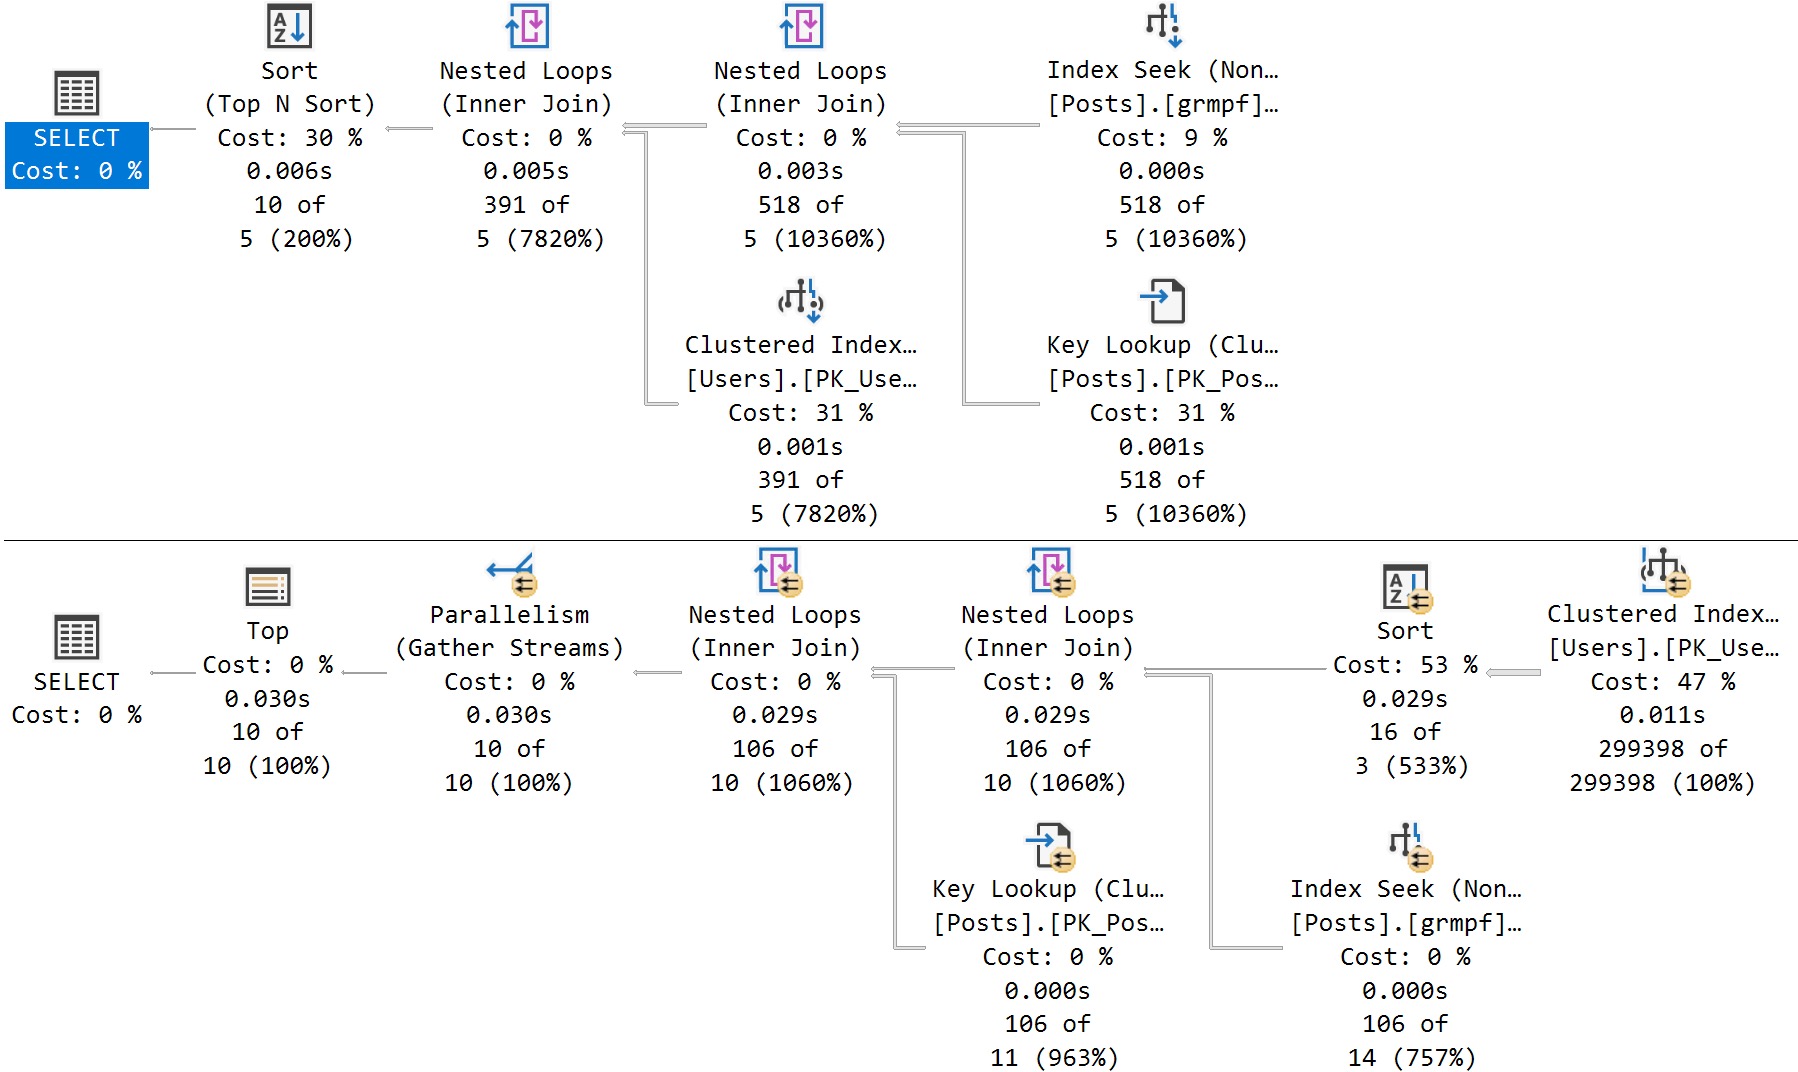
Here’s the cool part! If I run this stored procedure back to back like so, I’ll get two different query plans without recompiling or writing dynamic SQL, or anything else:

EXEC dbo.SQL2022
    @ParentId = 184618;
GO 

EXEC dbo.SQL2022 
    @ParentId = 0;
GO
SQL Server Query Plan
amazing!

It happens because the queries look like this under the covers:

SELECT TOP (10) 
    u.DisplayName, 
    p.*
FROM dbo.Posts AS p
JOIN dbo.Users AS u
    ON p.OwnerUserId = u.Id
WHERE p.ParentId = @ParentId
ORDER BY u.Reputation DESC 
OPTION (PLAN PER VALUE(QueryVariantID = 1, predicate_range([StackOverflow2010].[dbo].[Posts].[ParentId] = @ParentId, 100.0, 1000000.0)))

SELECT TOP (10) 
    u.DisplayName, 
    p.*
FROM dbo.Posts AS p
JOIN dbo.Users AS u
    ON p.OwnerUserId = u.Id
WHERE p.ParentId = @ParentId
ORDER BY u.Reputation DESC 
OPTION (PLAN PER VALUE(QueryVariantID = 3, predicate_range([StackOverflow2010].[dbo].[Posts].[ParentId] = @ParentId, 100.0, 1000000.0)))

Where Things Break Down


Normally, sp_BlitzCache will go through whatever statements it picks up and associate them with the parent object:

EXEC sp_BlitzCache
    @DatabaseName = 'StackOverflow2010';

But it doesn’t do that here, it just says that they’re regular ol’ statements:

SQL Server Query Results
do i know you?

The way that it attempts to identify queries belonging to objects is like so:

RAISERROR(N'Attempting to get stored procedure name for individual statements', 0, 1) WITH NOWAIT;
UPDATE  p
SET     QueryType = QueryType + ' (parent ' +
                    + QUOTENAME(OBJECT_SCHEMA_NAME(s.object_id, s.database_id))
                    + '.'
                    + QUOTENAME(OBJECT_NAME(s.object_id, s.database_id)) + ')'
FROM    ##BlitzCacheProcs p
        JOIN sys.dm_exec_procedure_stats s ON p.SqlHandle = s.sql_handle
WHERE   QueryType = 'Statement'
AND SPID = @@SPID
OPTION (RECOMPILE);

Since SQL handles no longer match, we’re screwed. I also looked into doing something like this, but there’s nothing here!

SELECT 
    p.plan_handle, 
    pa.attribute, 
    object_name = 
        OBJECT_NAME(CONVERT(int, pa.value)),
    pa.value
FROM
(
    SELECT 0x05000600B7F6C349E0824C498D02000001000000000000000000000000000000000000000000000000000000 --Proc plan handle
    UNION ALL 
    SELECT 0x060006005859A71BB0304D498D02000001000000000000000000000000000000000000000000000000000000 --Query plan handle
    UNION ALL
    SELECT 0x06000600DCB1FC11A0224D498D02000001000000000000000000000000000000000000000000000000000000 --Query plan handle
) AS p (plan_handle)
CROSS APPLY sys.dm_exec_plan_attributes (p.plan_handle) AS pa
WHERE pa.attribute = 'objectid';

The object identifiers are all amok:

SQL Server Query Results
oops i didn’t do it again

Only the stored procedure has the correct one.

The same thing happens in Query Store, too:

EXEC sp_QuickieStore
    @debug = 1;
SQL Server Query Result
lost in translation

The object identifiers are 0 for these two queries.

One Giant Leap


This isn’t a complaint as much as it is a warning. If you’re a monitoring tool vendor, script writer, or script relier, this is gonna make things harder for you.

Perhaps it’s something that can or will be fixed in a future build, but I have no idea at all what’s going to happen with it.

Maybe we’ll have to figure out a different way to do the association, but stored procedures don’t get query hashes or query plan hashes, only the queries inside it do.

This is gonna be a tough one!

Thanks for reading!

Going Further


If this is the kind of SQL Server stuff you love learning about, you’ll love my training. I’m offering a 75% discount to my blog readers if you click from here. I’m also available for consulting if you just don’t have time for that and need to solve performance problems quickly.

Finding Query Store Queries With Missing Index Requests In SQL Server 2019

All The Pretty Little Caveats


I’ve said quite a bit about missing index request utility generally in SQL Server, even as recently as last week!

But then I got a user question about using Query Store to do something similar, so here goes.

If you need a pre-2019 way to do this with Query Store, Kendra Little has a blog post about that here.

WITH
    queries AS
(
    SELECT TOP (100)
        parent_object_name = 
            ISNULL
            (
                OBJECT_NAME(qsq.object_id),
                'No Parent Object'
            ),
        qsqt.query_sql_text,
        query_plan = 
            TRY_CAST(qsp.query_plan AS xml),
        qsrs.first_execution_time,
        qsrs.last_execution_time,
        qsrs.count_executions,
        qsrs.avg_duration,
        qsrs.avg_cpu_time,
        qsp.query_plan_hash,
        qsq.query_hash
    FROM sys.query_store_runtime_stats AS qsrs
    JOIN sys.query_store_plan AS qsp
        ON qsp.plan_id = qsrs.plan_id
    JOIN sys.query_store_query AS qsq
        ON qsq.query_id = qsp.query_id
    JOIN sys.query_store_query_text AS qsqt
        ON qsqt.query_text_id = qsq.query_text_id
    WHERE qsrs.last_execution_time >= DATEADD(DAY, -7, SYSDATETIME())
    AND   qsrs.avg_cpu_time >= (10 * 1000)
    AND   qsq.is_internal_query = 0
    AND   qsp.is_online_index_plan = 0
    ORDER BY qsrs.avg_cpu_time DESC
)
SELECT
    qs.*
FROM queries AS qs
CROSS APPLY
(
    SELECT TOP (1)
        gqs.*
    FROM sys.dm_db_missing_index_group_stats_query AS gqs
    WHERE qs.query_hash = gqs.query_hash
    AND   qs.query_plan_hash = gqs.query_plan_hash
    ORDER BY
        gqs.last_user_seek DESC,
        gqs.last_user_scan DESC
) AS gqs
ORDER BY qs.avg_cpu_time DESC
OPTION(RECOMPILE);

I don’t love this query, because I don’t love querying Query Store views. That’s why I wrote sp_QuickieStore to make it a whole lot easier.

But anyway, this will get you a similar bunch of information.

Thanks for reading!

Going Further


If this is the kind of SQL Server stuff you love learning about, you’ll love my training. I’m offering a 75% discount to my blog readers if you click from here. I’m also available for consulting if you just don’t have time for that and need to solve performance problems quickly.
Should Query Store Also Capture Blocking And Deadlocks?

Big Ideas


The more I used third party monitoring tools, the more annoyed I get. So much is missing from the details, configurability, and user experience.

I often find myself insisting on also having Query Store enabled. As much as I’d love other improvements, I think it’s also important to have a centralized experience for SQL Server users to track down tricky issues.

There are so many views and metrics out there, it would be nice to have a one stop shop to see important things.

Among those important things are blocking and deadlocks.

Deadlockness


Deadlocks are perhaps the more obvious choice, since they’re already logged to the system health extended event session.

Rather than leave folks with a bazillion scripts and stored procedures to track them down, Query Store should add a view to pull data from there.

If Microsoft is embarrassed by how slow it is to grab all that session data, and they should be, perhaps that’s a reasonable first step to having Query Store live up to its potential.

Most folks out there have no idea where to look for that stuff, and a lot of scripts that purport to get you detail are either wildly outdated, or are a small detail away from turning no results and leaving them frustrated as hell.

I know because I talk to them.

Blockhead


Blocking, by default, is not logged anywhere at all in SQL Server.

If you wanna get that, you have to be ready for it, and turn on the Blocked Process Report:

sp_configure 
    'show advanced options', 
    1;  
GO  
RECONFIGURE;  
GO  
sp_configure 
    'blocked process threshold', 
    10;  
GO  
RECONFIGURE;  
GO

Of course, from there you have to… do more to get the data.

Michael J Swart has a bunch of neat posts on that. For my part, I wrote sp_HumanEvents to help you spin up an Extended Event session to capture that.

Awful lot of prep work to catch blocking in a database with a pessimistic isolation level on by default, eh?

Left Out


If you want to take this to the next level, it could also grab CPU from the ring buffer, file stats, and a whole lot more. Basically everything other than PLE.

Never look at PLE.

Thanks for reading!

Going Further


If this is the kind of SQL Server stuff you love learning about, you’ll love my training. I’m offering a 75% discount to my blog readers if you click from here. I’m also available for consulting if you just don’t have time for that and need to solve performance problems quickly.

Common SQL Server Consulting Advice: Enabling Query Store

Captain, Captain


Third party monitoring tools are in rough shape these days. That’s all I’m gonna say about the situation. I get enough letters from lawyers on account of my BTS fanfic sites.

With that out of the way, let’s talk about something you can do to get a handle on which queries are having problems: Enable Query Store.

You can do that using this command:

ALTER DATABASE 
    [YourDatabase]
SET QUERY_STORE 
(
    OPERATION_MODE = READ_WRITE,
    MAX_STORAGE_SIZE_MB = 1024,
    QUERY_CAPTURE_MODE = AUTO
);

The reason I use this command specifically us because it will override some bad defaults that have been corrected over various service packs and cumulative updates.

You know what I hate doing? Stopping to look at which service packs and cumulative updates fixed certain Query Store defaults.

The important things that this script does is:

  • Turn on Query Store
  • Give it a decent amount of space to store data in
  • Not capture every single tiny little query that runs

What a nice setup.

Okay, Now What?


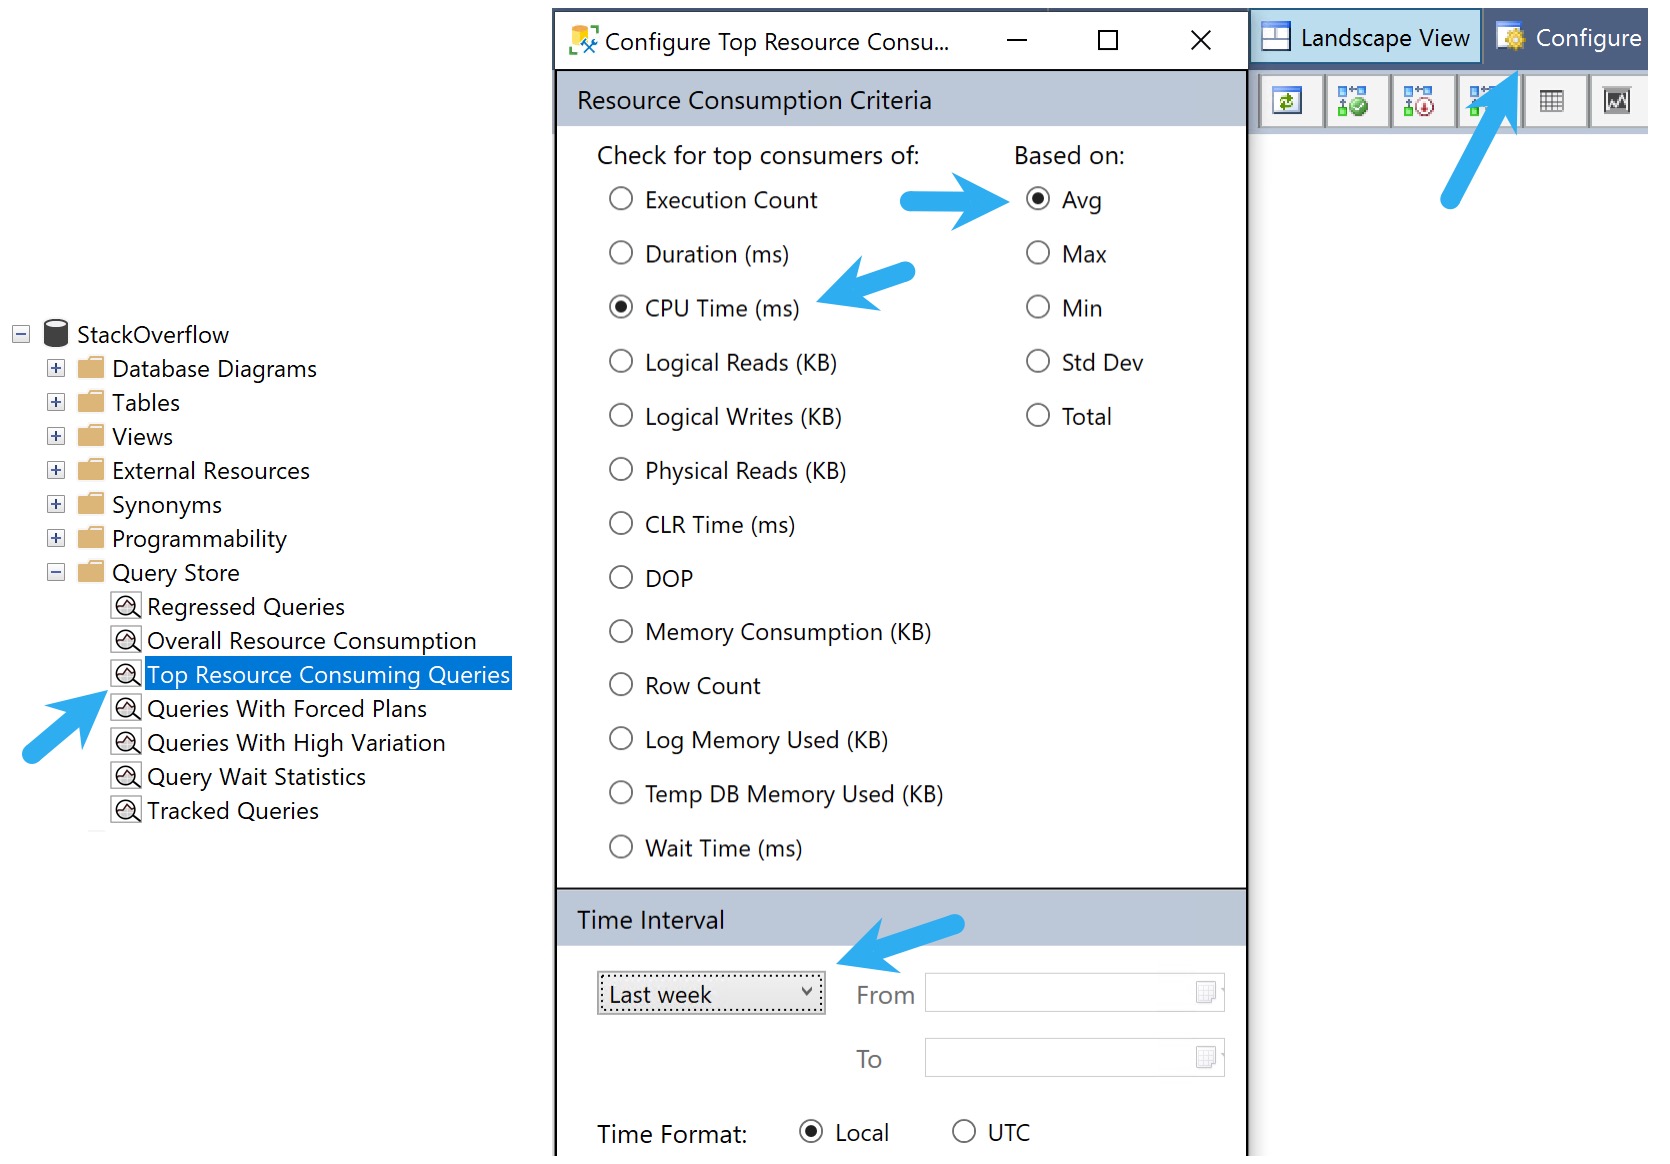
Once Query Store is enabled, assuming the goal is to track down and solve performance problems, the easiest way to start digging in is the GUI.

I usually go into Top Resource Consuming Queries, then look at what used the most average CPU over the last week.

SQL Server Query Store
cherry

This view won’t tell you everything of course, but it’s a good starting place.

Okay, But I Need More


The GUI itself right now doesn’t allow for much beyond showing you the top whatever by whatever for whenever. If you want to search through Query Store data for specific plan or query IDs, procedure names, or query text, you’ll need to use my free script sp_QuickieStore.

To get you started, here are a bunch of example commands:

--Get help!
EXEC dbo.sp_QuickieStore
    @help = 1;


--Find top 10 sorted by memory 
EXEC dbo.sp_QuickieStore
    @database_name = 'StackOverflow2013',
    @sort_order = 'memory',
    @top = 10;              


--Search for specific query_ids
EXEC dbo.sp_QuickieStore
    @database_name = 'StackOverflow2013',
    @top = 10,
    @include_query_ids = '13977, 13978';    


--Search for specific plan_ids
EXEC dbo.sp_QuickieStore
    @database_name = 'StackOverflow2013',
    @sort_order = 'memory',
    @top = 10,
    @start_date = '20210320',
    @include_plan_ids = '1896, 1897';

    
--Ignore for specific query_ids
EXEC dbo.sp_QuickieStore
    @database_name = 'StackOverflow2013',
    @top = 10,
    @ignore_query_ids = '13977, 13978';    


--Ignore for specific plan_ids
EXEC dbo.sp_QuickieStore
    @database_name = 'StackOverflow2013',
    @sort_order = 'memory',
    @top = 10,
    @start_date = '20210320',
    @ignore_plan_ids = '1896, 1897'; 


--Search for queries within a date range
EXEC dbo.sp_QuickieStore
    @database_name = 'StackOverflow2013',
    @sort_order = 'memory',
    @top = 10,
    @start_date = '20210320',
    @end_date = '20210321';              


--Search for queries with a minimum execution count
EXEC dbo.sp_QuickieStore
    @database_name = 'StackOverflow2013',
    @top = 10,
    @execution_count = 10;


--Search for queries over a specific duration
EXEC dbo.sp_QuickieStore
    @database_name = 'StackOverflow2013',
    @top = 10,
    @duration_ms = 10000;


--Search for a specific stored procedure
EXEC dbo.sp_QuickieStore
    @database_name = 'StackOverflow2013',
    @procedure_name = 'top_percent_sniffer';   


--Search for specific query tex
EXEC dbo.sp_QuickieStore
    @database_name = 'StackOverflow2013',
    @query_text_search = 'WITH Comment'


--Use expert mode to return additional columns
EXEC dbo.sp_QuickieStore
    @database_name = 'StackOverflow2013',
    @sort_order = 'memory',
    @top = 10,
    @expert_mode = 1;              


--Use format output to add commas to larger numbers
EXEC dbo.sp_QuickieStore
    @database_name = 'StackOverflow2013',
    @sort_order = 'memory',
    @top = 10,
    @format_output = 1;


--Use wait filter to search for queries responsible for high waits
EXEC dbo.sp_QuickieStore
    @database_name = 'StackOverflow2013',
    @wait_filter = 'memory',
    @sort_order = 'memory';


--Troubleshoot performance
EXEC dbo.sp_QuickieStore
    @database_name = 'StackOverflow2013',
    @troubleshoot_performance = 1;


--Debug dynamic SQL and temp table contents
EXEC dbo.sp_QuickieStore
    @database_name = 'StackOverflow2013',
    @debug = 1;

Thanks for reading!

Going Further


If this is the kind of SQL Server stuff you love learning about, you’ll love my training. I’m offering a 75% discount to my blog readers if you click from here. I’m also available for consulting if you just don’t have time for that and need to solve performance problems quickly.

Working With A SQL Server Consultant Checklist: Monitoring Tools And Query Store

Forensics


I get called in to help with a lot of interesting performance problems. I’m gonna say something that sounds harsh right up front: very few people are prepared for sudden issues.

After the fact (and usually after a reboot that clears out all the useful information) people start doing all sorts of things, like logging sp_WhoIsActive to a table.

Consider a couple things for a second though (aside from the fact that rebooting clears out all your important server metrics)

  • Nothing captures blocking by default (you need the blocked process report for this)
  • The system health session keeps limited information in it about things like deadlocks
  • SQL Server doesn’t time-slice wait stats or any other metrics
  • The plan cache is usually highly volatile for a number of reasons

With SQL Server, you need to prepare today for emergencies tomorrow.

Query Store


One way you can get some of this stuff is by enabling Query Store on your important databases.

It’s not perfect, and there’s certainly a risk of introducing unacceptable observer overheard in environments with a really high rate of transactions.

But it’s a whole lot better than the plan cache for looking back in time at query performance issues, and starting with SQL Server 2017 we started getting high-level waits stats too.

It’s not a replacement for a monitoring tool, and there’s enough functionality missing that I wrote a stored procedure called sp_QuickieStore to search through it, but it’s better than nothing.

The odds of relevant query plans from a performance meltdown being in the plan cache several days later is nearly zero. People just do too many bad things that make it fill up or clear out:

  • They don’t parameterize queries
  • They turn on optimize for ad hoc workloads
  • They don’t give SQL Server enough memory
  • They stack dozens of databases or schema

SQL Server 2019 added a bunch of switches you can tweak to reduce the overhead and the queries you collect in Query Store, which is super helpful.

Monitoring Tools


I hear a lot of people say they have SQL Server monitoring tools, but they either:

  • Are really crappy and impossible to use
  • Don’t really monitor SQL Server well

That doesn’t even begin to account for end-user issues, like:

  • Broken monitoring tool installs not collecting data
  • Software being way out of date, or…
  • Them not not knowing what to look at because they’ve never opened it

But if you have a good monitoring tool collecting a variety of important SQL Server metrics, you have a much better chance of being able to root cause performance issues:

  • Blocking
  • Deadlocks
  • Wait Stats
  • Query Performance
  • Disk Stuff
  • Memory Stuff
  • CPU Stuff

You get the idea — your monitoring tool should collect a wide enough variety of metrics that common problems don’t totally escape it — but probably not show you every single meaningless metric that you can possibly collect.

Easy Street


As a consultant, I love having these things to comb through to either troubleshoot a past performance issue, or just find candidate queries to tune for clients.

Without them, it makes my job a lot harder — or even impossible sometimes, when data is gone for good — and I have to spend a lot of time waiting for an issue to crop up again to see what was involved, or do a bunch of generalized performance tuning in order to hopefully avoid future issues.

In tomorrow’s post, I’m going to talk about some of the common tools and scripts that I use while consulting (though not how to use them). If you’re talking to anyone in the SQL Server consulting space, these are good tools to have available.

Thanks for reading!

Going Further


If this is the kind of SQL Server stuff you love learning about, you’ll love my training. I’m offering a 75% discount to my blog readers if you click from here. I’m also available for consulting if you just don’t have time for that and need to solve performance problems quickly.

SQL Server Query Store Improvements I’d Like To See

Not Love Or Hate


I like Query Store, I do. I don’t love the GUI, though. In fact, I kinda hate it — enough that I spent a hundred or so hours writing a script called sp_QuickieStore to avoid it — which should prove a point.

In the war of Chicken v Egg, one might say that it’s not worth developing a feature that isn’t exactly widely in use. Of course, the reason for that might be that… What got developed isn’t what people need.

Here are some similar examples:

  • Chicago Pizza
  • Tabs
  • Cats
  • Chunky peanut butter

See what I mean? I want better for Query Store.

With that said, here’s what I think it should do better.

Searching


Query Store needs to give you a way to search for things you care about. A few of the things sp_QuickieStore lets you search for:

  • Query Ids
  • Plan Ids
  • Object names (functions, procedures)
  • Query Text

I built that because I need that, and so do a lot of other people. Just opening up a GUI and sorting by some metrics doesn’t help you when you need to find a specific thing that’s causing a problem.

If I can write queries to do that, I’m sure the fine folks at Microsoft can manage. I’m not that bright.

Ignoring


Some queries you don’t care about. At all. Ever.

You know how you can track some queries? I’d love a way to unsubscribe from some queries, too.

And uh, sp_QuickieStore lets you ignore a list of Query and Plan Ids in the output.

It should also ignore a few other things that you can’t really tune:

  • Index maintenance
  • Statistics updates
  • Query Store Queries

If you’ve ever looked in Query Store, seen some crazy outlier, and found one of the queries you just ran to populate the GUI, you’re not alone.

Visualizing


In SQL Server 2017, Query Store started collecting high level wait stats. I’m not asking for anything more granular, but how about giving me an option to see them broken down over time?

Right now, you open that view up and there are some columns that show you the highest waits, but not when they happened.

When is pretty important! You might wanna see things that use high CPU, but only during the day. Sure, that’s easy if you know when you want to look at, but if you just wanna get a sense of how things ebbed and flowed over the last day or week, you’re outta luck.

A nice line graph that you can choose which waits to include in broken down over time would be awesome, especially if you could zoom in to find out what was running during a window.

The reports now are all very rudimentary. Maybe Microsoft is being nice to monitoring tool companies and not stepping on their toes, but not everyone has one of those.

Or will ever have one of those.

Please, help!

Collecting


I’ve griped before about this, but Query Store doesn’t collect one of the most useful metrics from a query: the granted memory. It only collects used memory.

You can get that from the Plan Cache, but that thing is an unreliable grump. And yeah, you can get that if you look in the query plan, but… If I want to do some analysis and quickly figure out which queries asked for huge grants and then didn’t use them, it’s not very practical to open every query plan to do it.

I’d also love if it stored some of the actual/runtime metrics. Not every one. Maybe the last 1-5 plans, either for tracked queries, or for ones that meet a certain threshold for resource usage.

Imagine if you could get the compile and runtime parameters for a query you know is sensitive to parameter sniffing, so that you could easily reproduce the issue?

Your life would get a whole lot easier.

Analyzing


Since Query Store is somewhat asynchronous, it would be helpful if you could get some advice about some of the gremlins in your Query Plan.

There’s a ton of detail and data in those query plans that’s ripe for analysis. If you’ve ever looked at the Warnings column in sp_BlitzCache, you’ll understand what I mean.

Yeah, that all comes from a bunch of terrible XQuery, but dammit… Normal folks looking at query plans don’t always know what to look for.

Heck, I’d forget to look for everything on that list, too, and I spend a good chunk of my days staring at these darn things.

It doesn’t have to be as exhaustive, but it would give civilians a fighting chance of understanding why things are bonked.

Thanks for reading!

Going Further


If this is the kind of SQL Server stuff you love learning about, you’ll love my training. I’m offering a 75% discount to my blog readers if you click from here. I’m also available for consulting if you just don’t have time for that and need to solve performance problems quickly.

Query Store Improvements I’d Like To See For SQL Server: Get The Full Query Text From The GUI

Spirited Away


This week’s posts are a series of short, and, admittedly lazy ones about improvements I’d like to see in Query Store.

I’m away from home for the Holiday Week, and I don’t have a lot of time to write at the moment. Normally I’d put these all into one post. I do hope you, dear reader, will forgive me. In the spirit of the holidays, or something.

Problem Five


People write big queries, whether it’s an ORM, in a stored procedure, or any other vehicle for sending your ANSI torture to SQL Server’s humble ports. Unfortunately, query plans don’t store the full text.

If you’re looking at query plans in Query Store’s GUI for a big query, you get AN ABSOLUTELY ENORMOUS pop up window, with a preview of the query text. But only a preview.

You can even get the full text if you query the underlying views directly. But most people aren’t taking that dive.

Often, getting the full query text is necessary for, you know… running the query without error. If it’s cut off, you can’t do that, and right now there’s no way to fetch it from the main dashboard screens.

That’s a major shortcoming, and fixing it would make life easier for anyone who uses Query Store for query tuning.

Thanks for reading!

Going Further


If this is the kind of SQL Server stuff you love learning about, you’ll love my training. I’m offering a 75% discount to my blog readers if you click from here. I’m also available for consulting if you just don’t have time for that and need to solve performance problems quickly.