Detecting Long Query Plan Compilation Times In SQL Server Queries

Rarities


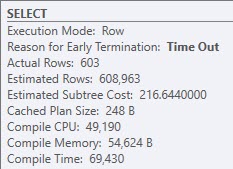
I ran into a very funny situation while working with a client recently. They were using Entity Framework, and a query with around 10 left joins ended up with a compile time of nearly 70 seconds.
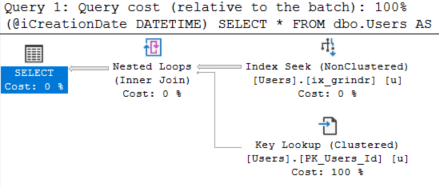
SQL Server Query Plan
Relatively.

Once the query finished compiling, it ran instantly with a pretty simple plan with all nested loops joins.

So what happened?

Tracing Flags


For science, I broke out a Rocket Science Trace Flag™ that will show optimization phases and how long were spent in them.

What came back looked like this:

end exploration, tasks: 3098 Cost = 242.433 time: 0 net: 0 total: 0.049 net: 0.047
end exploration, tasks: 3099 Cost = 242.433 time: 0 net: 0 total: 0.049 net: 0.047
end exploration, tasks: 3104 Cost = 242.433 time: 0 net: 0 total: 0.049 net: 0.048
end exploration, tasks: 3331 Cost = 242.433 time: 0.002 net: 0.002 total: 0.052 net: 0.05
end exploration, tasks: 3332 Cost = 242.433 time: 0 net: 0 total: 0.052 net: 0.05
end search(1),  cost: 210.273 tasks: 3332 time: 0 net: 0 total: 0.052 net: 0.05
*** Optimizer time out abort at task 211100 ***
end search(2),  cost: 210.273 tasks: 211100 time: 69.214 net: 69.678 total: 69.267 net: 69.729
*** Optimizer time out abort at task 211100 ***
End of post optimization rewrite, time: 0.001 net: 0.001 total: 69.268 net: 69.73
End of query plan compilation, time: 0.002 net: 0.002 total: 69.271 net: 69.732

The numbers aren’t quite the same, since the plan is from a different run than when I captured the trace flag (8675) output.

But you can see pretty clearly, in Search 2, we hung out for a while trying different rewrites.

What happens during Search 2? The whole enchilada.

In this case? Probably mostly join reordering.

Tracking Lags


If you don’t have query store enabled, it’s possible to search the plan cache, or get a warning from BlitzCache for long compile times.

If you do have Query Store enabled, compile time is logged in a couple places:

SELECT TOP (10)
       qsq.query_id,
       qsq.query_text_id,
       qsq.initial_compile_start_time,
       qsq.last_compile_start_time,
       qsq.last_execution_time,
       qsq.count_compiles,
	   qsq.last_compile_duration / 1000000. last_compile_duration,
       qsq.avg_compile_duration / 1000000. avg_compile_duration,
       qsq.avg_bind_duration / 1000000. avg_bind_duration,
       qsq.avg_bind_cpu_time / 1000000. avg_bind_cpu_time,
       qsq.avg_optimize_duration / 1000000. avg_optimize_duration,
       qsq.avg_optimize_cpu_time / 1000000. avg_optimize_cpu_time,
       qsq.avg_compile_memory_kb / 1024. avg_compile_memory_mb,
       qsq.max_compile_memory_kb / 1024. max_compile_memory_mb
--INTO   #query_store_query
FROM sys.query_store_query AS qsq
WHERE qsq.is_internal_query = 0
AND qsq.avg_compile_duration >= 1000000. --This is one second in microseconds
ORDER BY avg_compile_duration DESC

SELECT TOP (10)
       qsp.plan_id,
       qsp.query_id,
       qsp.engine_version,
       qsp.count_compiles,
       qsp.initial_compile_start_time,
       qsp.last_compile_start_time,
       qsp.last_execution_time,
       qsp.avg_compile_duration / 1000000. avg_compile_duration,
       qsp.last_compile_duration / 1000000. last_compile_duration,
       CONVERT(XML, qsp.query_plan) query_plan
--INTO   #query_store_plan
FROM sys.query_store_plan AS qsp
WHERE  qsp.avg_compile_duration >= 1000000. --This is one second in microseconds
ORDER BY  qsp.avg_compile_duration DESC

I’ve seen different numbers show up in these, so I like to look at both. I don’t know why that happens. There’s probably a reasonable explanation.

If you wanted to add in some other metrics, you could do this:

DROP TABLE IF EXISTS #query_store_query;
DROP TABLE IF EXISTS #query_store_plan;

SELECT TOP (10)
       qsq.query_id,
       qsq.query_text_id,
       qsq.initial_compile_start_time,
       qsq.last_compile_start_time,
       qsq.last_execution_time,
       qsq.count_compiles,
	   qsq.last_compile_duration / 1000000. last_compile_duration,
       qsq.avg_compile_duration / 1000000. avg_compile_duration,
       qsq.avg_bind_duration / 1000000. avg_bind_duration,
       qsq.avg_bind_cpu_time / 1000000. avg_bind_cpu_time,
       qsq.avg_optimize_duration / 1000000. avg_optimize_duration,
       qsq.avg_optimize_cpu_time / 1000000. avg_optimize_cpu_time,
       qsq.avg_compile_memory_kb / 1024. avg_compile_memory_mb,
       qsq.max_compile_memory_kb / 1024. max_compile_memory_mb
INTO   #query_store_query
FROM sys.query_store_query AS qsq
WHERE qsq.is_internal_query = 0
AND qsq.avg_compile_duration >= 1000000. --This is one second in microseconds
ORDER BY avg_compile_duration DESC;

SELECT TOP (10)
       qsp.plan_id,
       qsp.query_id,
       qsp.engine_version,
       qsp.count_compiles,
       qsp.initial_compile_start_time,
       qsp.last_compile_start_time,
       qsp.last_execution_time,
       qsp.avg_compile_duration / 1000000. avg_compile_duration,
       qsp.last_compile_duration / 1000000. last_compile_duration,
       CONVERT(XML, qsp.query_plan) query_plan
INTO   #query_store_plan
FROM sys.query_store_plan AS qsp
WHERE  qsp.avg_compile_duration >= 1000000. --This is one second in microseconds
ORDER BY  qsp.avg_compile_duration DESC;

SELECT (avg_cpu_time - qsq.avg_compile_duration) AS cpu_time_minus_qsq_compile_time,
       (avg_cpu_time - qsp.avg_compile_duration) AS cpu_time_minus_qsp_compile_time,
       qsrs.avg_cpu_time,
       qsrs.avg_duration,
       qsq.avg_compile_duration,
       qsq.avg_bind_duration,
       qsq.avg_bind_cpu_time,
       qsq.avg_optimize_duration,
       qsq.avg_optimize_cpu_time,
       qsq.avg_compile_memory_mb,
       qsp.avg_compile_duration,
       qsq.count_compiles,
       qsrs.count_executions,
       qsp.engine_version,
       qsp.query_id,
	   qsp.plan_id,
	   CONVERT(XML, qsp.query_plan) query_plan,
       qsqt.query_sql_text,
       qsrs.first_execution_time,
       qsrs.last_execution_time,
       qsq.initial_compile_start_time,
       qsq.last_compile_start_time,
       qsq.last_execution_time
FROM #query_store_query AS qsq
JOIN #query_store_plan AS qsp
ON qsq.query_id = qsp.query_id
JOIN sys.query_store_query_text AS qsqt
ON qsqt.query_text_id = qsq.query_text_id
JOIN 
(
SELECT qsrs.plan_id,
       qsrs.first_execution_time,
       qsrs.last_execution_time,
       qsrs.count_executions,
       qsrs.avg_duration / 1000000. avg_duration,
       qsrs.avg_cpu_time / 1000000. avg_cpu_time
FROM sys.query_store_runtime_stats AS qsrs
) AS qsrs
ON qsrs.plan_id = qsp.plan_id
ORDER BY qsq.avg_compile_duration DESC;
--ORDER BY qsp.avg_compile_duration DESC;

Fixes?


For EF, the only solution was to use a plan guide with a FORCE ORDER hint supplied. This let us arm wrestle the optimizer into just joining the tables in the order that the joins are written in the query. For some reason, forcing the plan with query store did not force the plan that forced the order.

I didn’t dig much into why. I do not get along with query store most of the time.

If you’re finding this happen with queries you have control over, doing your own rewrites to simplify the query and reduce the number of joins that the optimizer has to consider can help.

Thanks for reading!

Going Further


If this is the kind of SQL Server stuff you love learning about, you’ll love my training. I’m offering a 75% discount to my blog readers if you click from here. I’m also available for consulting if you just don’t have time for that and need to solve performance problems quickly.

When Parameterizing Queries Won’t Help SQL Server Performance

Multitude


There are many good reasons to parameterize queries.

There are, of course, downsides, too. Parameter sensitivity, AKA parameter sniffing, being the prime one.

But let’s say you consult the internet, or find a consultant on the internet, and they tell you that you ought to parameterize your queries.

It all sounds like a grand idea — you’ll get better plan reuse, and hopefully the plan cache will stop clearing itself out like a drunken ourobouros.

You could even use a setting called forced parameterization, which doesn’t always work.

Apart from the normal rules about when parameteriztion, forced or not, may not work, there’s another situation that can make things difficult.

Client Per Thing


Let’s assume for a second that you have a client-per-database, or client-per-schema model.

If I execute parameterized code like this:

DECLARE @i INT = 2
DECLARE @sql NVARCHAR(MAX) = N'
SELECT COUNT(*) AS records
FROM dbo.Users AS u
WHERE u.Reputation = @ii
'

EXEC sys.sp_executesql @sql, N'@ii INT', @ii = @i;

But from different database contexts (I have a few different versions of StackOverflow on my server, but I’m going to show results from 2013 and 2010), we’ll get separate cached plans, despite them having identical:

  • Costs
  • Query Plans
  • SQL Handles
  • Query Hashes
SQL Server Plan Cache Query Results
Frida Fredo

The same thing would happen with any parameterized code executed in a different context — stored procedures, functions… well. You get the idea.

Forced parameterization may help queries within the same context with plan reuse, but there are certain boundaries they won’t cross.

Don’t get me wrong, here. I’m not complaining. There’s so much that could be different, I wouldn’t want plan reuse across these boundaries. Heck, I may even separate stuff specifically to get different plans. As usual, I don’t want you, dear reader, to be surprised by this behavior.

Thanks for reading!

Going Further


If this is the kind of SQL Server stuff you love learning about, you’ll love my training. I’m offering a 75% discount to my blog readers if you click from here. I’m also available for consulting if you just don’t have time for that and need to solve performance problems quickly.

A Quirk With Plan Caching And Dynamic SQL In SQL Server

Have All Thirteen


Going Further


If this is the kind of SQL Server stuff you love learning about, you’ll love my training. I’m offering a 75% discount to my blog readers if you click from here. I’m also available for consulting if you just don’t have time for that and need to solve performance problems quickly.

Why You Should Look At Your Plan Cache By Averages, Too

Like vim, I Can’t Quit You


I’m going to be honest with you, I have no idea how most people who use sp_BlitzCache run it.

Most people I talk to are like “oh, that’s not sp_Blitz?”

Ahem.

Anyway, I’m going to show you a cool way to look at your plan cache a little bit more differenter than usual.

Average The Life


When you run it and use @SortOrder, it will sort by the “total” column of whichever metric you pick. CPU, Reads, Duration, Writes — you get the picture.

But you can also run it to sort by what uses the most of a metric on average.

Sure, totals point out what runs a lot — but things that run a lot might not have much to tune.

You can make a note like “Should we be caching this?” for you developers to laugh at.

Here are some examples:

EXEC sp_BlitzCache @SortOrder = 'avg cpu';
EXEC sp_BlitzCache @SortOrder = 'avg duration';
EXEC sp_BlitzCache @SortOrder = 'avg reads';
EXEC sp_BlitzCache @SortOrder = 'avg writes';
EXEC sp_BlitzCache @SortOrder = 'avg spills';
EXEC sp_BlitzCache @SortOrder = 'memory grant';

No, memory grant isn’t an average. But it can show you some real bangers.

Here’s an example of why you should use those average sort orders:

EXEC sp_BlitzCache @SortOrder = 'cpu'
Public Visitation

Those queries all executed a whole bunch. They racked up a bunch of total CPU time.

But looking at any of those execution plans, aside from not running the query so much, there’s nothing really to tune.

We met at GitHubs

But if we look at the plan cache by averages…

EXEC sp_BlitzCache @SortOrder = 'avg cpu'
Told her she take me back

We get… Alright, look. Those queries all have recompile hints. They still show up.

But the top one is interesting! It has way higher average CPU than the rest.

SQL Server Query Plan
I’ll make more pull requests

This query plan is a little bit different. It’s scanning the clustered index rather than seeking, and it’s got a missing index request.

In total, it wasn’t using a lot of CPU compared to other queries, but on average it was a lot suckier.

SQL University


I always look at the averages, because you can find some really interesting plans in there.

Sure, you might find some one-off stuff that you can ignore, but that’s what @MinimumExecutionCount is for.

You did read the documentation, didn’t you?

Queries that use a lot of resources on average often stand a good chance at being tuned, where queries that just use a lot of resources because of how frequently they run may not.

Anyway, that’ll be $1.

Thanks for reading!

Going Further


If this is the kind of SQL Server stuff you love learning about, you’ll love my training. I’m offering a 75% discount to my blog readers if you click from here. I’m also available for consulting if you just don’t have time for that and need to solve performance problems quickly.

SQL Server Needs Built-In Performance Views

No, Not More DMVs


Though I would be cool with new ones, as long as they’re not memes.

When you’re trying to gauge some high level performance metrics on a new server, you probably have your favorite scripts.

They could be various Blitzes, they could be some stuff you’ve had sitting in your script folder, maybe they’re from the Tiger Toolbox.

Whatever.

The point is that you, dear reader, are smart and engaged enough to know about and use these things.

A lot of people aren’t.

I’m not talking about another thing to go find and install. I mean these should come with the product.

Perf Schema


It would be really cool if SQL Server had a system schema called perf. In there you could have views to all sorts of neat things.

It would exist in every database, and it would have views in it to fully assemble the mess of DMVs that accompany:

  • Query Store
  • Plan Cache
  • Index Usage
  • Missing Indexes
  • File Stats
  • Wait Stats
  • Locking
  • Deadlocks

Assembling all those views is painful for beginners (heck Query Store is painful for everyone). Worse, they may find scripts on the internet that are wrong or outdated (meaning they may not have new columns, or they may give outdated advice on things).

What would make these particularly helpful is that they could aggregate metrics at the database level. Server-wide counters are cool until your server is really wide, and it’s impossible to tell where stuff like wait stats are coming from. This wouldn’t be too difficult to implement, since Azure SQLDB already has to have a bunch of self-contained stuff, due to the lack of cross-database queries.

Best of all, Microsoft can keep them up to date based on which version and edition of SQL Server you’re on, and if certain changes get back ported.

Thanks for reading!

Going Further


If this is the kind of SQL Server stuff you love learning about, you’ll love my training. I’m offering a 75% discount to my blog readers if you click from here. I’m also available for consulting if you just don’t have time for that and need to solve performance problems quickly.
Function Plan Caching In SQL Server: Inlined Functions

Led Better


In yesterday’s post, we looked at MSTVFs. Today, we’re going to look at inlined functions.

And I know, that sounds weird. But it’s because we’re going to circle back to scalar valued functions, and how they’re inlined in SQL Server 2019 as well.

There’s stuff in here you’ll have to look out for when you move to SQL Server 2019.

Side By Side


The first thing we need is the function itself, which is just an inlined version of the others.

CREATE OR ALTER FUNCTION dbo.CommentsAreHorribleInline(@Id INT)
RETURNS TABLE
WITH SCHEMABINDING
AS
RETURN
SELECT (SELECT SUM(Score) FROM dbo.Posts AS p WHERE p.OwnerUserId <= @Id)
	   -
	   (SELECT COUNT_BIG(*) FROM dbo.Comments AS c WHERE c.UserId <= @Id) AS Tally
GO

Where these differ from both kinds of functions, is that you can’t find them ANYWHERE on their own.

They don’t appear in any DMVs, or in the plan cache as isolated code. Since they’re inlined, it’s just a part of whatever query references it.

Let’s start simple, though:

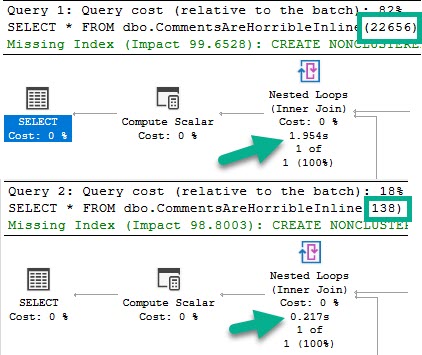
SELECT * FROM dbo.CommentsAreHorribleInline(22656);

SELECT * FROM dbo.CommentsAreHorribleInline(138);

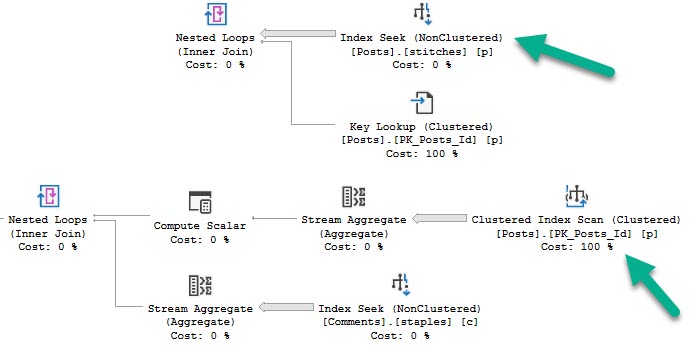
Like in the other posts, the chief difference between these two plans is the index access choice.

The 22656 plan scans the clustered index, and the 138 plan does a nonclustered index seek with a key lookup.

Check the other posts in the series for pictures of that if you’re interested.

SQL Server Query Plan
Tops and Bottoms

As in the other examples, the clustered index scan is considerably slower than the nonclustered index seek plan.

But that’s not where things are interesting. Where they’re interesting is when we call the function in a “larger” query.

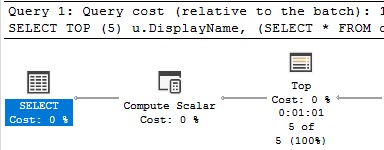
SELECT TOP (5) u.DisplayName,
       (SELECT * FROM dbo.CommentsAreHorribleInline(u.Id))
FROM dbo.Users AS u
GO

Spool And Spool Alike


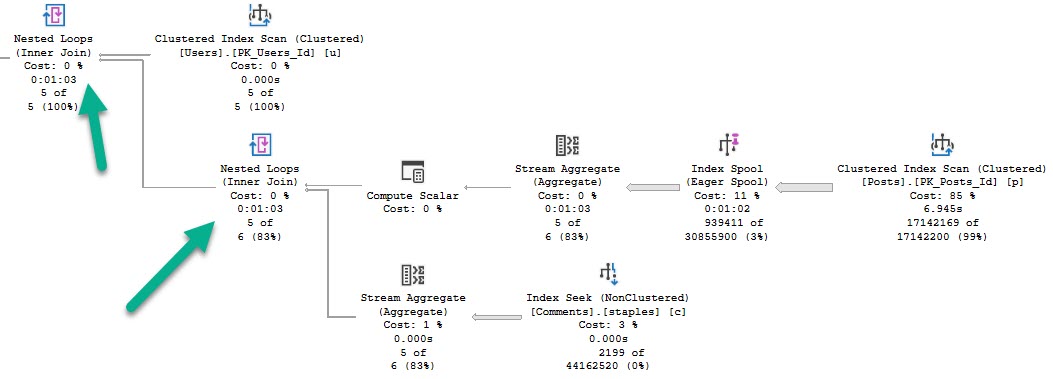
This query runs for a full minute.

SQL Server Query Plan
Adios

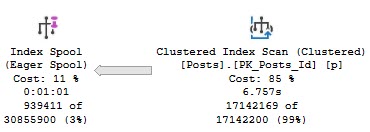
We see why early on — an eager index spool.

SQL Server Query Plan
You again.

This appears to happen because the optimizer is drunk as hell doesn’t like the idea of scanning the clustered index, or recycling the seek + lookup 5 times.

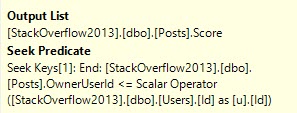
The index reflects what a two column clustered index keyed on OwnerUserId would look like.

Think about it like if you selected OwnerUserId and Score into a #temp table and put a clustered index on the table with the key on OwnerUserId.

SQL Server Query Plan
Damaja

Remember that part of the reason for this plan change is that we’re no longer just subtracting one aggregate from another like when we call the function on its own, there’s the additional “join” to the Users table. Correlated subqueries are just that — joins.

SQL Server Query Plan
Solitaire

Futurist


I’d love to have more to say about how this changes in SQL Server 2019, but an identical pattern occurs, similar to what I blogged about earlier in the summer.

I caught some private flack about how the TOP (1) pattern in that post could easily be replace with an aggregate like MIN.

While that’s totally true, there’s no similar replacement for this pattern. We could expand the index to cover the Score column to get rid of the spool, which goes back to another post I wrote about 2019 optimizer features, where you’ll need wider (covering) indexes for them to be used.

Thanks for reading!

Going Further


If this is the kind of SQL Server stuff you love learning about, you’ll love my training. I’m offering a 75% discount to my blog readers if you click from here. I’m also available for consulting if you just don’t have time for that and need to solve performance problems quickly.
Function Plan Caching In SQL Server: Multi Statement Table Valued Functions

Too Clean


In yesterday’s post, we looked at we looked at simple scalar function plan caching.

Today, we’ll look at MSTVFs. If you’re not sure what that means, look at the title of the post real quick.

Yeah, up there.

On we go.

Dirty Version


The function will do the same thing as before, just rewritten to be a MSVTF.

CREATE OR ALTER FUNCTION dbo.CommentsAreHorribleMulti(@Id INT)
RETURNS @Tally TABLE(Tally BIGINT)
WITH SCHEMABINDING
AS
BEGIN
INSERT @Tally ( Tally )
SELECT (SELECT SUM(Score) FROM dbo.Posts AS p WHERE p.OwnerUserId <= @Id)
	   -
	   (SELECT COUNT_BIG(*) FROM dbo.Comments AS c WHERE c.UserId <= @Id)
RETURN
END
GO

Now, where these differ immediately from SVFs (scalar valued functions), is that they don’t show up in the plan cache by name.

Wrong Hook

Note that these are both “statements”.

Also, unlike SVFs, they don’t show up in dm_exec_function_stats. This is documented behavior, but whatever.

And even though they’re called a “Proc” in dm_exec_cached_plans, they only show up in dm_exec_query_stats, not dm_exec_procedure_stats (which is why BlitzCache calls them a Statement).

Different Sniffint


Unlike SVFs, which don’t have a restriction on the function body using parallelism, all table variable modifications are forced to run serially (unless you’re sneaky).

That means both insert queries will be serialized, with the main difference being index access.

SQL Server Query Plan
arrowed

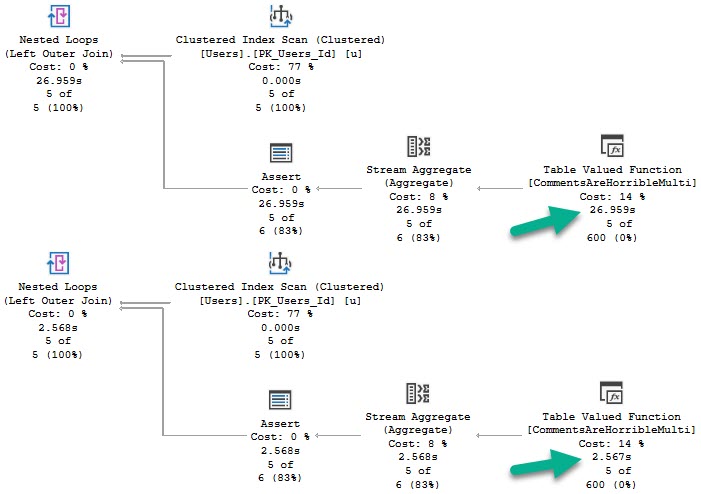
Like before, if we cache either plan, it will get reused. And just like before, the clustered index scan plan is significantly slower.

SELECT TOP (5) u.DisplayName,
       (SELECT * FROM dbo.CommentsAreHorribleMulti(u.Id))
FROM dbo.Users AS u
SQL Server Query Plan
Old Dress

Plan Noir


Just like scalar functions, these can have different plans cached and reused, and may fall victim to parameter sniffing.

Again, this depends a lot on how the function is called and used. It’s just something to be aware of when tuning queries that call functions.

Execution times may vary greatly depending on… well…

Parameters.

Thanks for reading!

Going Further


If this is the kind of SQL Server stuff you love learning about, you’ll love my training. I’m offering a 75% discount to my blog readers if you click from here. I’m also available for consulting if you just don’t have time for that and need to solve performance problems quickly.
Function Plan Caching In SQL Server: Scalar Valued Functions

The End Is Nigh-Ish


Yes. SQL Server 2019. Scalar Function Inlining. Froid.

This post isn’t about any of that. It’s about scalar valued functions as we know them now.

Terrible, horrible, no-good, very-bad, presentation-filler.

But to make matters worse, we’re going to combine them with a problem no one is pretending to solve: bad parameter sniffing.

After all, that’s what can go wrong when you cache a plan, right?

Our Dummy


This is our function. It’s set up to do something that should happen on Stack sites: users should be penalized for leaving comments.

Okay, so this isn’t exactly how it would work. But stick with me, because it makes a better demo.

CREATE OR ALTER FUNCTION dbo.CommentsAreHorribleScalar(@Id INT)
RETURNS BIGINT
WITH SCHEMABINDING, RETURNS NULL ON NULL INPUT
AS
BEGIN
DECLARE @Tally BIGINT
SELECT @Tally = 
	   (SELECT SUM(Score) FROM dbo.Posts AS p WHERE p.OwnerUserId = @Id)
	   -
	   (SELECT COUNT_BIG(*) FROM dbo.Comments AS c WHERE c.UserId = @Id)
RETURN @Tally
END
GO

Really, we’re just getting a sum of all the scores in the Posts table for a user, then subtracting the count of comments they’ve left.

Because comments are horrible.

Anyway.

Individually


If we run these two queries, the plan will get reused.

SELECT dbo.CommentsAreHorribleScalar(22656);

SELECT dbo.CommentsAreHorribleScalar(138);

We can free the cache, run them in the other order, and the same will happen in reverse.

Of course, each one gets a different plan.

SQL Server Query Plan
22656
SQL Server Query Plan
138

Tangentially, these functions will end up dm_exec_function_stats, which was introduced in 2016, and can also be identified by name in the plan cache.

SELECT * 
FROM sys.dm_exec_function_stats AS defs;

EXEC sp_BlitzCache @StoredProcName = 'CommentsAreHorribleScalar';

Sniffing


If we cache a plan for 22656 or 138, and then run a query like this:

SELECT TOP (100) u.DisplayName,
       dbo.CommentsAreHorribleScalar(u.Id)
FROM dbo.Users AS u;

The query will reuse whatever the cached plan is.

Again, using BlitzCache to track the plan down:

SQL Server Query Results
Favorite shoe

In this case, the query is simple enough that the plan difference doesn’t change performance very much.

Let’s change our function a little bit to see a better example.

Appalled


Here it is:

CREATE OR ALTER FUNCTION dbo.CommentsAreHorribleScalar(@Id INT)
RETURNS BIGINT
WITH SCHEMABINDING, RETURNS NULL ON NULL INPUT
AS
BEGIN

DECLARE @Tally BIGINT

SELECT @Tally = 
	   (SELECT SUM(Score) FROM dbo.Posts AS p WHERE p.OwnerUserId <= @Id)
	   -
	   (SELECT COUNT_BIG(*) FROM dbo.Comments AS c WHERE c.UserId <= @Id)

RETURN @Tally

END
GO

The plans are way different now:

SQL Server Query Plan
Bananas

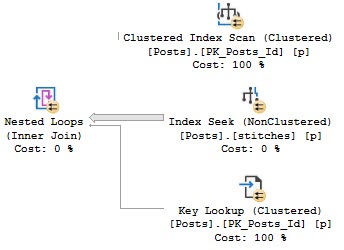
22656 scans the clustered index, and 138 seeks into the nonclustered index with a key lookup.

For the record, the bad plan is the clustered index scan, and the fast plan is the nonclustered index seek.

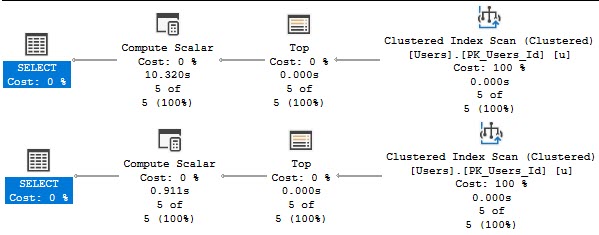
Running a smaller query (because the top hundred made me impatient), the difference is obvious.

SELECT TOP (5) u.DisplayName,
       dbo.CommentsAreHorribleScalar(u.Id)
FROM dbo.Users AS u;
SQL Server Query Plan
Compute hahahahahahahalar

The version of the query that gets the bad function plan has a 10 second compute scalar, and the version of the query that gets the good function plan finishes in 900ms.

Functions Can Get Different Plans


Depending on how you call them, and how much data they might have to touch, this can be a big deal or no deal.

Because I know I’ll get some semi-related questions:

  • The body of scalar functions have no restrictions on parallelism, only the calling statements are forced to run serially
  • Functions run “once per row”, with the number of rows being dependent on where in the plan the compute scalar appears

Thanks for reading!

Going Further


If this is the kind of SQL Server stuff you love learning about, you’ll love my training. I’m offering a 75% discount to my blog readers if you click from here. I’m also available for consulting if you just don’t have time for that and need to solve performance problems quickly.
What Parameter Sniffing Looks Like In SQL Server’s Plan Cache

A Plan Has No Name


There are so many ways this question gets phrased.

  • Why is my query sometimes slow?
  • Why does restarting SQL Server make my query fast again?
  • Why does clearing the plan cache fix performance?

A while back, I put together a pretty good rundown of this on the DBA Stack Exchange site.

In the plan cache, it’s really hard to tell if a query is suffering from parameter sniffing in isolation.

By that I mean, if someone sends you a cached plan that’s slow, how can you tell if it’s because of parameter sniffing?

Cached Plans Lie


Here’s a simple example with a simple index:

CREATE INDEX ix_grindr 
    ON dbo.Users (CreationDate);

This query will return a couple days of data:

DECLARE @CreationDate DATETIME = '2013-12-30'
DECLARE @sql NVARCHAR(MAX) = 
N'
SELECT *
FROM dbo.Users AS u
WHERE u.CreationDate >= @iCreationDate
ORDER BY u.CreationDate DESC;
'

EXEC sys.sp_executesql @sql, 
                       N'@iCreationDate DATETIME', 
					   @iCreationDate = @CreationDate;
GO

This query will return a year and a couple days worth of data:

DECLARE @CreationDate DATETIME = '2012-12-30'
DECLARE @sql NVARCHAR(MAX) = 
N'
SELECT *
FROM dbo.Users AS u
WHERE u.CreationDate >= @iCreationDate
ORDER BY u.CreationDate DESC;
'

EXEC sys.sp_executesql @sql, 
                       N'@iCreationDate DATETIME', 
					   @iCreationDate = @CreationDate;
GO 

Time After Time


If we run those one right after the other, the query that returns a year of data will use the query plan of the query that returns a day of data.

This is what performance tuners call “bad”.

Let’s look at the cached plan!

SELECT ds.execution_count,
       ds.min_worker_time / 1000000. AS min_worker_time_ms,
	   ds.max_worker_time / 1000000. AS max_worker_time_ms,
	   ds.min_elapsed_time / 1000000. AS min_elapsed_time_ms,
	   ds.max_elapsed_time / 1000000. AS max_elapsed_time_ms,
	   ds.min_logical_reads,
	   ds.max_logical_reads,
	   ds.min_rows,
	   ds.max_rows,
       SUBSTRING(st.text, (ds.statement_start_offset / 2) +1,   
                 ((CASE ds.statement_end_offset  
                       WHEN -1 
				       THEN DATALENGTH(st.text)  
                       ELSE ds.statement_end_offset  
                   END - ds.statement_start_offset) / 2) +1) AS text,
	   dp.query_plan
FROM sys.dm_exec_query_stats AS ds
CROSS APPLY sys.dm_exec_sql_text(ds.plan_handle) AS st
CROSS APPLY sys.dm_exec_query_plan(ds.plan_handle) AS dp
WHERE st.dbid = DB_ID()
AND ds.query_plan_hash = 0x2D530BDF87345191
OPTION(RECOMPILE);

This query will go look at some details about the queries I ran.

Since my code is parameterized, the cached plan for both executions looks like this:

SQL Server Query Plan
So cute though

How could this plan cause any trouble?

Metric System


The plan isn’t telling us everything, though.

Look what those other columns have to say:

SQL Server Query Execution Details
Sometimes~

We have two executions, which we knew! We ran it twice.

But the min and max for many important metrics are very different.

CPU, wall clock time, reads, rows… They all tell me that this query has wild swings in performance.

On Your Own


One simple way to go about finding queries with parameter sniffing issues might be to just look for ones with much different CPU usage.

You could easily do with this other metrics; I just like CPU as a measure of these things.

SELECT TOP (100) ds.execution_count,
       ds.min_worker_time / 1000000. AS min_worker_time_ms,
	   ds.max_worker_time / 1000000. AS max_worker_time_ms,
	   ds.min_elapsed_time / 1000000. AS min_elapsed_time_ms,
	   ds.max_elapsed_time / 1000000. AS max_elapsed_time_ms,
	   ds.min_logical_reads,
	   ds.max_logical_reads,
	   ds.min_rows,
	   ds.max_rows,
       SUBSTRING(st.text, (ds.statement_start_offset / 2) +1,   
                 ((CASE ds.statement_end_offset  
                       WHEN -1 
				       THEN DATALENGTH(st.text)  
                       ELSE ds.statement_end_offset  
                   END - ds.statement_start_offset) / 2) +1) AS text,
	   dp.query_plan
FROM sys.dm_exec_query_stats AS ds
CROSS APPLY sys.dm_exec_sql_text(ds.plan_handle) AS st
CROSS APPLY sys.dm_exec_query_plan(ds.plan_handle) AS dp
WHERE st.dbid = DB_ID()
AND ds.execution_count > 1
AND (ds.min_worker_time / 1000000.) * 100. < (ds.max_worker_time / 1000000.)
ORDER BY max_worker_time_ms DESC
OPTION(RECOMPILE);

Thanks for reading!

Going Further


If this is the kind of SQL Server stuff you love learning about, you’ll love my training. I’m offering a 75% discount to my blog readers if you click from here. I’m also available for consulting if you just don’t have time for that and need to solve performance problems quickly.
Why Plan Cache Scripts For SQL Server Can Be Misleading

A Long Way From Home


Most scripts (even ones I’ve worked on!) that look at the plan cache, have had the ability to sort it by different metrics: CPU, reads, writes, duration, etc.

A lot of people are very interested in long running queries — and I am too!

Heck, they’re how I make money. Blogging pays like crap.

But there’s a slight problem with only looking at query duration.

Fake Locks


Let’s say I have a stored procedure that looks like this:

CREATE OR ALTER PROCEDURE dbo.dblock (@id INT)
AS
BEGIN
    BEGIN TRAN
        UPDATE u
        SET u.Reputation = 2147483647 
        FROM dbo.Users AS u
        WHERE u.Id = @id
        
        WAITFOR DELAY '00:00:07.000'
    ROLLBACK
END;
GO

It’s there to simulate a long running modification query. You know, the kind of thing that’ll lead to blocking.

The kind of blocking that can make other queries feel like they take a long time.

Street Team


Here’s another stored procedure:

CREATE OR ALTER PROCEDURE dbo.the_lox (@id INT)
AS
BEGIN
    SELECT u.Id
    FROM dbo.Users AS u
    WHERE u.Id = @id
END;
GO

This will finish instantly. The Id column of the Users table is the Primary Key, as well as the Clustered Index.

There is literally nothing to tune here.

But it may look like it, sometimes…

D’evils


If I run these in different windows, the lox will be blocked by dblock.

--One Window
EXEC dbo.dblock @id = 22656;
GO 

--Other window
EXEC dbo.the_lox @id = 22656;
GO

If you were wondering why I had a 7 second wait, it’s because it generally takes me two seconds to flip windows and run a query.

When the situation resolves, this is what the metrics look like:

SELECT OBJECT_NAME(deps.object_id) AS stored_procedure_name,
       ( deps.last_worker_time / 1000. ) AS cpu_time,
       ( deps.last_elapsed_time / 1000. ) AS run_time
FROM   sys.dm_exec_procedure_stats AS deps
WHERE  deps.object_id = OBJECT_ID('dbo.the_lox');
GO
Everything You Got

The query barely used any CPU, but it ran for 5 seconds.

If you order your plan cache by elapsed time, you might see blameless queries up at the top.

There are a lot of reasons why they could end up there, and blocking is one of them.

Unfortunately, there’s currently nothing to tell you why. If you’re just getting started with query tuning, this could look befuddling.

Are Averages Better?


Sometimes it helps to look at what runs for a long time on average — you can figure that out by looking at the number of executions.

That can make better sense of things, but not if a query has only run once, or if it gets blocked a lot.

It may make more sense to factor in metrics that represent physical work, like CPU, reads, or writes, rather than just relying purely on wall clock time.

Thanks for reading!

Going Further


If this is the kind of SQL Server stuff you love learning about, you’ll love my training. I’m offering a 75% discount to my blog readers if you click from here. I’m also available for consulting if you just don’t have time for that and need to solve performance problems quickly.