Why does FAST_FORWARD make some cursors so much faster in SQL Server?

If you’re like me, you started your database journey by defining cursors with the default options. This went on until a senior developer or DBA kindly pointed out that you can get better performance by using the FAST_FORWARD option. Or maybe you were a real go-getter and found Aaron Bertrand’s performance benchmarking blog post on different cursor options. I admit that for many years I didn’t care to know why FAST_FORWARD sometimes made my queries faster. It had “FAST” in the name and that was good enough for me.

Recently I saw a production issue where using the right cursor options led to a 1000X performance improvement. I decided that ten years of ignorance was enough and finally did some research on different cursor options. This post contains a reproduction and discussion of the production issue.

A Dramatic Example

The code below creates a 16 GB table. It has a primary key and clustered index on the ID column and a nonclustered index on the ID2 column. You can adjust the TOP value to insert fewer rows if you wish to create a smaller table, but don’t drop it below 200000.

DROP TABLE IF EXISTS tbl_1;

CREATE TABLE tbl_1 (
ID BIGINT NOT NULL,
ID2 BIGINT NOT NULL,
PAGE_FILLER VARCHAR(5000) NOT NULL,
PRIMARY KEY (ID)
);

INSERT INTO tbl_1 WITH (TABLOCK)
SELECT RN, RN % 100000, REPLICATE('Z', 5000)
FROM
(
	SELECT TOP (2000000) ROW_NUMBER() OVER (ORDER BY (SELECT NULL)) RN
	FROM master..spt_values t1
	CROSS JOIN master..spt_values t2
) q
OPTION (MAXDOP 1);

CREATE INDEX IX2 ON tbl_1 (ID2);

Consider the following select query, which is a simplified example of the production query:

Select ID
from tbl_1
WHERE ID2 < 1
ORDER BY ID;

There’s an index on ID2 and the filter is highly selective: only 20 rows out of 2 million will match. I would expect the query optimizer to use that index and for the query to finish instantly. The following stored procedure defines a FAST_FORWARD cursor for that SELECT query, fetches the 20 matching rows, and does nothing with them:

CREATE OR ALTER PROCEDURE CURSOR_WITH_FF
AS
BEGIN
SET NOCOUNT ON;

Declare @ID BIGINT;

Declare FF Cursor FAST_FORWARD for
Select ID
from tbl_1
WHERE ID2 < 1
ORDER BY ID;

Open FF;
Fetch Next from FF into @ID;
WHILE @@FETCH_STATUS = 0
BEGIN
	Fetch Next from FF into @ID;
END;
Close FF;
Deallocate FF;
END;

Executing the stored procedure takes about 2 ms on my machine. In this case, I get a query plan that’s very similar to what I’d get by running a simple SELECT query. There’s some additional cursor garbage, but that doesn’t impact performance in this case:
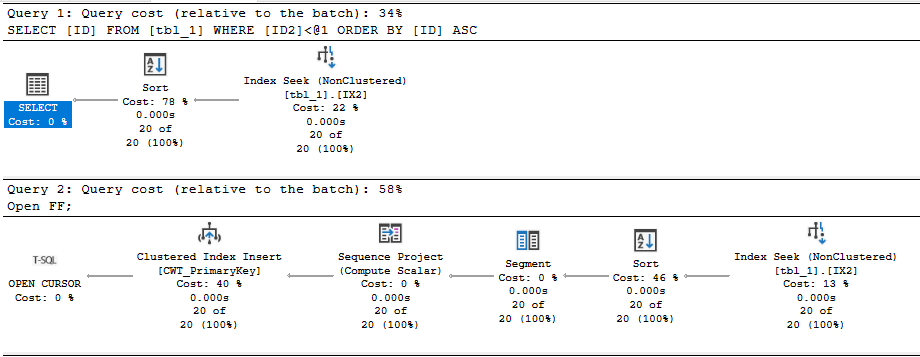
SQL Server Query Plan

Regrettably, the code takes 50 seconds to execute on my machine if I remove the FAST_FORWARD option. What is responsible for the dramatic difference in runtime?

The “What”

We can start by looking at the query plan for the default cursor:

SQL Server Query Plan

The query optimizer decided to do an ordered clustered index scan instead of using the IX2 index. We’re getting all rows from the cursor so we have to read through the whole table. That’s 20 scans with each scan covering about 5% of the table. We should definitely expect this to be less efficient than the FAST_FORWARD plan, but a 50 second execution time felt too slow based on what I know about my hardware. Looking at the wait stats:

SQL Server Query Plan

It’s certainly not surprising that I/O is the biggest contributor to wait time (what else would it be?), but why do I have so much I/O wait time when I have fast, locally attached storage with an average latency less than 1 ms? For a comparison test, I decided to force the query plan that the cursor picks but to run it outside of the cursor. The following code finished in about 8 seconds on my machine:

CHECKPOINT;
DBCC DROPCLEANBUFFERS;

Select ID
from tbl_1 WITH (INDEX(1))
WHERE ID2 < 1
ORDER BY ID
OPTION (MAXDOP 1);

Using sys.dm_io_virtual_file_stats, I found that the cursor was doing about 240000 I/Os with an average I/O size of 66 KB. The single SELECT query did about 10000 I/Os with an average I/O size of 1.7 MB. The key difference is that only the first query execution of the cursor is able to get read-ahead reads:

SQL Server Query Plan

For the cursor execution, we don’t get read ahead reads for 95% of the I/O needed for the query. Even a sub-ms I/O latency can be painful when you have to do 240000 I/Os with a DOP 1 query. In summary, the FAST_FORWARD cursor is able to use an index to efficiently seek to the 20 matching rows. The cursor with default options does about 15 GB of I/O that’s not eligible for read-ahead reads.

Of course, the situation should be expected to be much worse in the cloud. Using the quoted latency of 5-10 ms for general purpose Managed Instances, one might expect the cursor with default options to take between 20 and 40 minutes. Just for fun, I decided to test it against a 4 vCore Managed Instance. The cursor with the FAST_FORWARD option took about 120 ms. The cursor with default options took about 70 minutes. Here are the wait stats for the execution:

SQL Server Query Plan

To put a positive spin on it: using the correct cursor options improved performance by 35000X on the Managed Instance.

The “Why”

I’ll start by saying that I don’t want to be a cursor expert. I’d much rather be an expert in not using cursors. I was having a lot of trouble explaining why the default cursor was getting such a bad query plan, but fortunately I was scooped 12 years ago. I’m going to reproduce the entire section on dynamic plans because you never know when a Microsoft hosted blog post will disappear:

A dynamic plan can be processed incrementally. In SQL Server we do this by serializing the state of the query execution into what we call a marker. Later, we can build a new query execution tree, use the marker to reposition each operator. Moreover, a dynamic plan can move forwards and backwards relative to its current position. Dynamic plans are used by both dynamic and some fast_forward cursors.

A dynamic plan consists only of dynamic operators — operators that support markers and moving forwards and backwards. This corresponds closely, but not exactly, to the query processing notion of streaming operators (vs. stop-and-go). But not every streaming operator is dynamic. In SQL Server, dynamic means:

1. The operator can be repositioned to its current position using a marker, or to a relative position (either next or previous) from its current one.

2. The operator’s state has to be small, so the marker can be small. No row data can be stored in the operator. In particular, no sort table, hash table, or work table. Not even one row can be stored, since a single row can be very large.

Without a dynamic plan, the cursor would need temporary storage to keep the query result set (or keyset thereof). A dynamic plan does no such thing! However, certain operators are disqualified — hash join, hash agg, compute sequence, and sort, for example. This leads to sub-optimal plans.

In short, you can consider a dynamic plan to be similar in concept to a plan with no blocking operators, but there are some additional restrictions. Reliable sources tell me that a cursor with default options will always pick a dynamic plan if one is available. For our SELECT query, a dynamic plan is indeed available. The ordering of the clustered index can be used to return sorted rows without doing an explicit sort. The IX2 index cannot be used for ordering because I’m filtering on ID2 with an inequality. Changing the query to do an equality filter instead allows for a dynamic plan that uses the IX2 index:

SQL Server Query Plan

What about cursors without default options? Going back to the original query, specifying the STATIC or KEYSET option avoids the bad query plan and uses the IX2 index to do an index seek. Both of those options write the cursor result set to a table in tempdb, so it makes intuitive sense that there wouldn’t be some kind of restriction that forces a clustered index scan.

Specifying the FAST_FORWARD option allows the query optimizer to pick between a static and dynamic plan. In this case, the static plan is obviously much more efficient, and the query optimizer is aware of that. It picks the static plan that doesn’t do the clustered index scan.

For completeness, specifying the READ_ONLY option also results in the index seek, as long as the DYNAMIC option isn’t also specified.

In general, I would say that FAST_FORWARD is still a good starting point for your cursors as long as your application code allows for the restrictions that come with it. FAST_FORWARD alone isn’t always sufficient to get query performance that is similar to what you’d get with a standard SELECT. As Erik points out, you’ll end up with a MAXDOP 1 query with that option. The query optimizer may also choose a worse dynamic plan instead of a static plan if the estimated query plan costs don’t reflect reality. Using STATIC instead of FAST_FORWARD can be quite helpful in some cases, but you’ll have to test your cursor specifically to know for sure. Of course, you may be able to write your code without using a cursor instead.

Insufficient Permissions

As someone always on the lookout for cool demos, this bit of the documentation caught my eye:

If a DECLARE CURSOR using Transact-SQL syntax does not specify READ_ONLY, OPTIMISTIC, or SCROLL_LOCKS, the default is as follows:

If the SELECT statement does not support updates (insufficient permissions, accessing remote tables that do not support updates, and so on), the cursor is READ_ONLY.

Could I get better performance by running the code as a login with less privileges? Sadly, I couldn’t get this to work. I verified that the lowly ‘erik’ login couldn’t modify data in the table but I got the same query plan as before. There was also no change in the properties column from the sys.dm_exec_cursors DMF.

I don’t know if the documentation was wrong or if I was doing something wrong on my end. I’d be interested in seeing a working repro of this if anyone has one.

Final Thoughts

Some query patterns can experience extremely poor performance with the default cursor options. You may be able to identify these queries by sorting by total logical reads in the standard SSMS query store reports. In our production environment we had a few cursors that were doing far more logical reads than anything else on the database, so they were easy to pick out. We were able to significantly speed up some of those queries just by adding the FAST_FORWARD option.

Thanks for reading!

Going Further


If this is the kind of SQL Server stuff you love learning about, you’ll love my training. I’m offering a 75% discount to my blog readers if you click from here. I’m also available for consulting if you just don’t have time for that and need to solve performance problems quickly.

Trying out the new premium-series Azure SQL Managed Instances

At Microsoft Ignite 2021, public preview for new “premium-series” hardware was announced for Azure SQL Managed Instances. There’s even a black friday sort of sale during this month where you can do testing on premium-series VMs without paying for the compute costs. As someone without free cloud bucks: sign me up!

I did some basic query benchmarking to get an idea of the performance difference between the new premium VMs and the standard gen 5 VMs. The test VMs aren’t identical in specs: the standard-series has 4 vCore with 20.4 GB of memory and the premium-series has 8 vCore with 56 GB of memory. I will attempt to call out any situations where that spec difference had a measurable impact.

What is an Intel 8370C processor?

When I see an Intel CPU model that I’m not familiar with, the first thing I do is try to look it up on the Intel Ark website. Unfortunately, like other cloud specific CPUs, there is no information available there on the Intel 8370C. I did try to ask around but I didn’t get very far. Here’s everything that I know:

  • 3rd Generation Intel® Xeon® Scalable Processors
  • Ice Lake code name
  • At least 24 cores per socket
  • 2.8 GHz base
  • Turbo clock speed of 3.5GHz
  • Intel Turbo Boost Technology 2.0
  • Intel AVX-512
  • Intel Deep Learning Boost

That will have to do. It’s a bit annoying trying to compare on-prem performance numbers to MI when we don’t have full details about the processor in the cloud, but this seems to be how it is.

What is a Managed Instance vCore?

There are a few things that you need to know in order to put a vCPU or vCore count into perspective:

1) What is the hardware in the physical host? For Managed instances, we know that the gen 5 series physical hosts have Intel E5-2673 v4, SP-8160, or 8272CL processors. For the premium-series, we know that the physical hosts only have Intel 8370C processors. We may not know exactly what those processors are, but we at least have some information.

2) How are the logical cores in the VM spread over the physical costs of the physical host? In other words, are 4 vCores generally spread over 2 physical cores on the host or are they spread over a single hyperthread each from four different physical cores? Those configurations will result in very different application throughput. In a blog post that I haven’t written yet, I present evidence that you should think of Managed Instance VMs as being spread over the minimum number of physical cores on the host. In other words, a 4 vCore VM will at most get 2X the throughput of a single query running at MAXDOP 1.

3) How much CPU oversubscription is there at the physical host level? Your VM may be fighting for CPU time with other VMs on the same physical host. With MI, you only have access to the SQL Server instance. As far as I know, there really isn’t a way to tell if your query runtime is getting penalized due to activity by some other VM. I’ve seen query performance degrade on MI instances with nothing else going on. The only way that I know to explain it is some kind of oversubscription at the host level. Note that Microsoft only offers compute isolation for standard-series VMs at 40+ vCores and for premium-series VMs at 64+ vCores.

You might be wondering why I’m writing all of this in a blog post about query performance testing. The reason is simple: CPU time at the individual query level may be a significantly less consistent performance metric on Managed Instances compared to what you’re used to. As an example from this round of testing, the same query used both 1289 ms of CPU and 1929 ms of CPU under conditions that appeared to be identical. Both hyperthreading and VM oversubscription can contribute to “inflated” CPU times. You might be getting time on one of the processor’s logical cores but that time is shared with whatever else may be running on the other logical core. And who even knows what HyperV is doing in terms of scheduling?

With that said, I did not observe the wild variances in CPU time on the premium-series VM. I suspect that this is a property of the public preview nature of the VM. Still, I ran all queries five times each and averaged the results to mitigate the CPU variance problem. When query tuning on Managed Instances in the real world, do note that if your rewrite reduces CPU time by 20%, you may have not accomplished anything. You’ll need to test performance many times or evaluate performance in a different way, perhaps by examining the query plan shape or (gasp!) looking at logical reads.

While Loop Test

The first test that I did was the simple WHILE loop described here. Managed Instances have significant observer overhead for this code compared to a vanilla SQL Server install. Perhaps it has something to do with all of the extended event sessions mentioned in the MI error log. It could be said that testing this T-SQL is really just benchmarking that observer overhead. However, it’s still CPU work, so why not do it?

The premium-series VM took an average of 663 CPU ms compared to 1043 CPU ms for the standard VMs.

Cross Join Test

For the next test case, I wanted to reduce the observer overhead but still execute a CPU-bound query with a minimum of time lost to waits. I decided on the following query which calculates 6.5 million checksums:

SELECT MIN(CHECKSUM(CAST(t1.number AS BIGint) + CAST(t2.number AS BIGint)))
FROM master..spt_values t1
CROSS JOIN master..spt_values t2
OPTION (MAXDOP 1, NO_PERFORMANCE_SPOOL);

The query plan isn’t very exciting:

The premium-series VM took an average of 1277 CPU ms compared to 1876 CPU ms for the standard VMs.

Batch Mode Test

I also wanted to run a query that does some batch mode work without spilling to tempdb. I don’t know if it applies here, but in some cases, CPUs with newer instruction sets can get better performance with batch mode operations. First I created a simple CCI:

CREATE TABLE dbo.BatchModeTest (
ID1 BIGINT NOT NULL,
ID2 BIGINT NOT NULL,
ID3 BIGINT NOT NULL,
STRING VARCHAR(100),
INDEX CCI CLUSTERED COLUMNSTORE
);

INSERT INTO dbo.BatchModeTest WITH (TABLOCK)
SELECT q.RN, q.RN, q.RN, REPLICATE('Z', 100)
FROM
(
    SELECT ROW_NUMBER() OVER (ORDER BY (SELECT NULL)) RN
    FROM master..spt_values t1
    CROSS JOIN master..spt_values t2
) q
OPTION (MAXDOP 1);

I then tested the performance of the following query:

SELECT COUNT_BIG(DISTINCT ID1)
FROM BatchModeTest
OPTION (MAXDOP 1);

The premium-series VM took an average of 724 CPU ms compared to 1162 CPU ms for the standard VMs.

On a batch mode related note, I observed that Managed Instances don’t seem to have the fix for the “queries on CCIs can get trivial plans which result in no batch mode” issue that was addressed with SQL Server 2017. I sent this feedback to Microsoft and it was received positively, so perhaps there will be an update one day on Managed Instances that addresses that problem. I have to admit that I’m curious as to how such a situation is possible. Are there other fixes that haven’t been ported to the Managed Instance bits yet? Performance tuning in the cloud is difficult enough without the absence of performance fixes implemented years ago in the boxed product!

Application Query Tests

I also tested two of our application queries which are known pain points for our end users. I am not able to share any information about the queries, but you may consider them to be significantly more “real world” compared to the previous tests done so far. As with the other tests conducted so far, both queries used significantly less CPU time on the premium-series managed instance. Here are all of the performance testing results so far:

I will note once again that the VMs aren’t identical in specs: the standard-series has 4 vCore with 20.4 GB of memory and the premium-series has 8 vCore with 56 GB of memory. With that said, tempdb spills would have contributed to at most a 30 ms difference in CPU time for the application queries.

Maintenance Tests

By popular demand, I also tested a few maintenance activities. I ran DBCC CHECKTABLE against one of the largest tables in the database. It took 44 seconds to complete on the premium-series and 65 seconds to complete on the standard-series.

Rebuilding an index of a table was more interesting. The premium-series VM took significantly longer than the standard-series: 209 seconds vs 158 seconds. However, the premium-series tests used significantly less CPU: 55 seconds vs 109 seconds. I saw a lot of LOGBUFFER waits on the premium-series VM that weren’t observed on the standard-series. As far as I can tell, storage performance should have been identical between the two VMs. Perhaps I just got unlikely, or maybe the root cause of this difference will be addressed before premium-series VMs become generally available.

Final Thoughts

Based on limited public preview results, the new premium-series VMs are significantly more CPU efficient than the standard-series VMs for several different types of queries. I saw a 40% reduction in CPU time across the board in my testing. Workloads with queries that are CPU bound may be able to reduce their overall vCore count and still see improved query performance by switching to the premium-series VMs. For our workload, based on the information that I have, I would prefer a 24 vCore premium-series VM over a 32 vCore standard-series VM. It’s a cheaper option with slightly more memory and more CPU power. Other workloads that aren’t as CPU bound may not see the same benefits from switching to the Intel 8370C. Perhaps the 15% price premium isn’t worth it in all cases.

For VM sizes that don’t qualify for compute isolation (fewer than 64 vCores), I suspect that these test results are biased in favor of the premium-series. It’s just speculation on my part, but I didn’t see the kind of oversubscription at the host level with the premium-series that I’m used to seeing on the standard-series MI VMs. It is possible that the premium-series VMs will have less of a performance advantage compared to the standard-series once they become generally available.

I’ll add that databases platforms, and software in general, are supposed to serve us and make our lives easier. Too often it feels like we’re the ones serving the database platforms instead. That’s part of why I’m such a big advocate for using the right hardware for your important relational database workloads. It’s really hard to get excited when spinning up a new Managed Instance VM only to get something on an E5-2673 v4 physical host. That doesn’t sound like the right hardware to me.

Thanks for reading!

Simple test results for query I/O performance on Azure SQL Managed Instance

Lately I’ve been doing some exploratory performance testing on Azure SQL Managed Instances in preparation for a migration to that platform. This blog post documents some storage testing results and may even have practical advice near the end. All testing was done on a gen5 general purpose instance with 8 vCores.

The Test Query

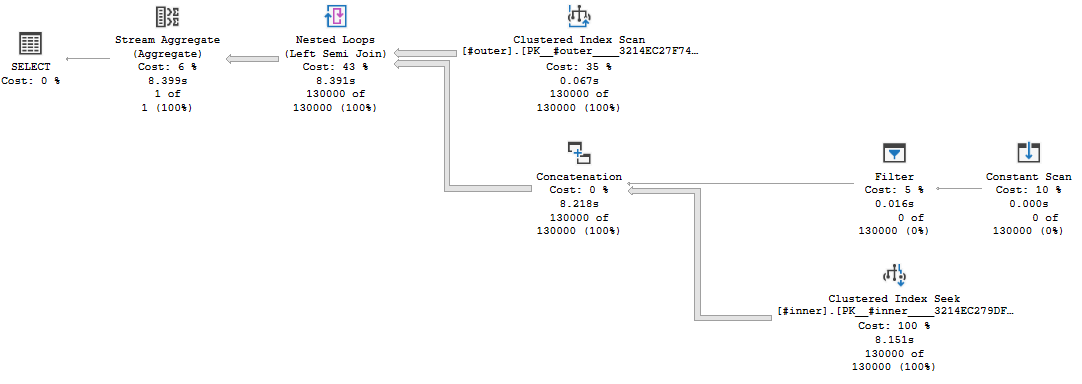
The test case is relatively simple. I want to do about 1 GB of physical reads without doing any read-ahead reads. To accomplish that, I loaded 130k rows into a table making sure that only one row could fit on each data page. I also wrote a simple nested loop join query that doesn’t allow for nested loop prefetching. Here’s a picture of the query plan:

The presence of the concat operator on the inner side of the nested loop prevents the prefetch optimization. This limitation is unusually annoying, but I’m using it to my advantage here to stress I/O as much as I can. Here’s the T-SQL used to generate the query plan in the picture:

use tempdb;
 
CREATE TABLE #outer (
    ID BIGINT IDENTITY(1, 1) NOT NULL,
    DUMMY BIGINT NOT NULL,
    PRIMARY KEY (ID)
);

INSERT INTO #outer (DUMMY)
SELECT TOP (130000) 0
FROM master..spt_values t1
CROSS JOIN master..spt_values t2;


CREATE TABLE #inner (
    ID BIGINT IDENTITY(1, 1) NOT NULL,
    BIG_DUMMY CHAR(5000) NOT NULL,
    PRIMARY KEY (ID)
);

INSERT INTO #inner (BIG_DUMMY)
SELECT TOP (130000) '0'
FROM master..spt_values t1
CROSS JOIN master..spt_values t2;

CHECKPOINT;
DBCC DROPCLEANBUFFERS;
 

SELECT COUNT_BIG(*)
FROM #outer o
WHERE o.DUMMY = 1
OR EXISTS (
    SELECT 1
    FROM #inner i
    WHERE i.ID = o.ID
)
OPTION (MAXDOP 1, QueryRuleOff BuildSpool);

For the different cases, I ran the SELECT query at MAXDOP 1 and MAXDOP 2 and cleared the buffer pool before each query execution.

Is Tempdb no longer the outhouse?

For user databases on managed instances, the documentation states that you should expect I/O latency of around 5-10 ms. However, tempdb is attached locally so we might get better latency there. Wanting to start off on a positive note, I elected to try testing in tempdb first. Here are the test results for the tempdb database:

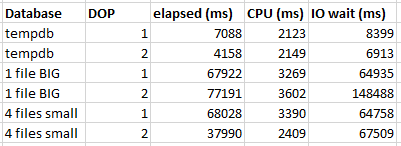
The managed instance spends more time waiting for I/O compared to testing on my local machine’s tempdb, but the MAXDOP 2 query has the nice property of nearly being twice as fast as the MAXDOP 1 query. Both queries on the managed instance have roughly the same amount of I/O wait time. The MAXDOP 2 query is primarily faster because the I/O waits are spread fairly evenly between both threads. I will note that I was a bit lazy with my test query and I didn’t ensure that an appropriate amount of work is sent to each thread, but things worked out well enough for this kind of test.

My next test was performed in a user database that was created solely for the purpose of this testing. The initial database size was about 1.5 GB. The code is the same as before, but I just created user tables instead of temp tables. The test results were not good. Both queries ran for over a minute and the MAXDOP 2 query was slower than the MAXDOP 1 query. The documentation says the following:

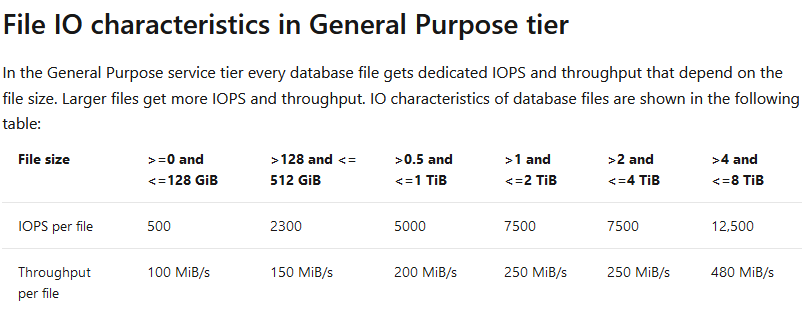
If you notice high IO latency on some database file or you see that IOPS/throughput is reaching the limit, you might improve performance by increasing the file size.

In this case, I might improve performance if I increase my data file size to greater than 128 GB. I didn’t want to do that for a few reasons:

  1. It costs money and I don’t like spending money.
  2. There’s an instance level storage limit of 2 or 8 TB for general purpose (depending on vCore count).
  3. Creating a database with 99% free space is silly and a well-meaning DBA could shrink it without realizing the performance implications.

For you, dear reader, I increased the database size to 132 GB. I did not observe any performance improvements after doing so, despite testing many times. Here are the test results so far:

Tempdb has 12 data files btw

The chart below makes me wonder if creating multiple files for a small database would be helpful:

If I can get 500 IOPS per database file and I have four database files, logically speaking I would expect to get 2000 IOPS for a single database with four files. I’m personally a big fan of databases with multiple files. I’ve seen a lot of performance problems fixed or mitigated by going beyond the default one data file per database rule.

There is at least one downside to creating multiple small files for one database on managed instances: there’s a documented limit of 280 total files for the general purpose tier. This limit is there because each file takes up a minimum of 128 GB on the storage backend and a general purpose instance can only use up to 35 TB of storage on the backend: 280 * 128 = 35 * 1024. It is amusing to consider how master, model, and msdb take up about 750 GB of storage behind the scenes.

On my instance, I’m nowhere near the 280 file limit/35 TB storage backend limit, so I created a small database (significantly below 128 GB) with about 4 files and tested the query again. Here are the full results:

MAXDOP 1 query performance is pretty much the same as before, but the MAXDOP 2 query runtime decreased from 77 seconds to 37 seconds. That’s a huge improvement. The MAXDOP 2 query is also roughly twice as fast as the MAXDOP 1 query which is nice to see. The only thing that I did to improve parallel query performance was to create a new database with 4 data files instead of 1.

Practical Applications

To get the obvious out of the way: if you’re writing temporary data to user tables instead of temp tables on Managed Instance, you probably shouldn’t be doing that.

I don’t have any production workloads in managed instances yet, but I’ll go ahead and attempt to give some guidance on file counts. You should consider exceeding 1 data file per database if all of the following are true:

  1. Your database is under 128 GB
  2. You care about I/O performance for that database or your I/O waits for that database are higher than you’d like
  3. Your instance isn’t close to the 35 TB backend limit

It will always be workload dependent, but you may see a performance improvement by splitting your database into multiple files. Do note that you’ll need to spread your data over all of the files (rebuild your tables and indexes after adding files) and you’ll want the files to be the same sizes with the same autogrowth settings. Also, there are other situations where you may want more than one data file for a database. Do not interpret the above to mean that databases already above 128 GB only need a single file.

If you’ve got a managed instance with only one database, perhaps you’re wondering if it would be a good idea to give it 96 data files. In theory, that will allow that database to hit the instance IOPS limit of 30k-40k. I can say that I’ve run with 96 file user databases in Enterprise and I didn’t observe any issues other than an annoying initial setup. The scenario for that was a large ETL system and I was trying to reduce PFS and GAM contention, so it’s quite a bit different than what you would run on a managed instance.

I would be somewhat cautious with creating significantly more data files for one database than your vCore count. In that configuration, I would also try to avoid excess autogrowth events as that is one place you might run into trouble. In general, when doing unusual things, you should test very carefully. That same advice is applicable here. It might work out well or it might not help at all. Stop asking me, I’ve used the cloud for like a week.

Final Thoughts

In some scenarios on Azure SQL Managed Instances, you may be above to improve I/O performance for small databases FOR FREE by spreading your data over multiple data files. Isn’t that wonderful?

Thanks for reading!

What’s in your SQL Server error log?

This is my 50th blog post! I’m going to do something a bit special.

The Error Log

I’ve found the SQL Server error log to be slightly underrated as a source of useful information for how your SQL Server instance is doing. It’s true that it’s easy to find yourself in a situation where the applications write tens of thousands of failed login messages per day, but if you can get past that, SQL Server might be telling you important stuff that you really need to know about. Examples that I’ve seen:

  • Memory dumps
  • non-yielding schedulers
  • long I/Os
  • latch timeouts

Maybe this an odd thing to do, but I’ve personally set up alerting to get an email whenever SQL Server writes something to the error log. Naturally I filter out a lot of benign and informational messages. This kind of alerting is useful because let’s face it, using SSMS to open the error log isn’t always the fastest operation in the world. And who even knows if Azure Data Studio can be used to view the error log?

What’s in your error log?

If you haven’t checked your error log in a while, I challenge you to do so on your next working day. You never know what you’ll find. I’m happy to share my own, but readers may be confused as I run a custom version of SQL Server:

Thanks for reading!

Quick SQL Server CPU Comparison Tests

Sometimes I have a need to run a quick CPU comparison test between two different SQL Server instances. For example, I might be switching from old hardware to new hardware and I want to immediately see a faster query to know that I got my money’s worth. Sometimes I get a spider sense while working with virtualized SQL Server instances and want to check for problems. Yesterday, I was doing a sort of basic health check on a few servers that I hadn’t worked with much and I wanted to verify that they got the same performance for a very simple query.

The Test Code

To get a single CPU core to 100% within SQL Server with minimal setup, the best method known to me uses a temporary procedure that does a simple operation within a WHILE loop:

CREATE OR ALTER PROCEDURE #p AS
BEGIN
    SET NOCOUNT ON;
    DECLARE @i BIGINT = 0, @time DATETIME2 = SYSUTCDATETIME();
    
    WHILE @i < 1000000
    BEGIN
        SET @i = @i + 1;
    END;
    
    SELECT cpu_time, DATEDIFF(MILLISECOND, @time, SYSUTCDATETIME()) elapsed_time
    FROM sys.dm_exec_requests
    WHERE session_id = @@SPID;
END;

GO

EXEC #p;

The code is extremely efficient (from a certain point of view) and CPU time will closely match elapsed time as as long as there’s no other processes on the lucky CPU that runs my beautiful code. It’s designed to spend as little time on waits and latches as possible. A temporary stored procedure is used to avoid ASYNC_NETWORK_IO waits. Paul White explains why the ASYNC_NETWORK_IO waits appear when the same code is run as part of a batch in this stack exchange answer.

CPU Problems

Going back to the intro, you can probably guess that I did not see identical CPU times when comparing the two servers. Otherwise, there would be no reason to write a blog post. The first server that I tested took about 2400 CPU ms to execute the code. The second server took about 300 CPU ms. There are of course a lot of factors in play here, but I would expect a healthy machine to take somewhere around 200-800 ms of CPU work. I definitely wouldn’t expect an 8X difference for two servers that were supposed to have identical performance!

To be clear, the only thing that you can safely conclude in this kind of situation is that there’s some kind of unknown configuration difference between the two servers. It does not necessarily mean that there’s some kind of severe issue with the server that takes more CPU time to perform the same work. With that said, it’s definitely suspicious and not something that you want to unexpectedly see. Running down the root cause of the issue can be difficult and time consuming because there are a lot of possible causes. Here is an incomplete list:

  • Hardware differences
  • Power plan and other OS configuration settings
  • OS patching, especially side channel vulnerability fixes
  • Enabling hyperthreading (CPU reporting within SQL server doesn’t have the same meaning)
  • Disabling Intel Turbo Boost
  • VM CPU oversubscription
  • VMware’s Enhanced vMotion Compatibility (EVC) – force a CPU to run on an older instruction set for compatibility reasons
  • Other VM issues
  • SQL Server version
  • Expensive monitoring configured within SQL Server including certain extended events, trace flags, profiling, or traces

In my case, the culprit ended up being a popular SQL Server third party monitoring solution (I will decline to name the vendor). Again, we can’t conclude that the vendor is doing something wrong. Different types of monitoring will have different overheads for different types of work within SQL Server. In some cases, simply asking for a SQL Server actual plan can more than double the execution time of a query. That doesn’t mean that we shouldn’t use actual plans as performance diagnosis tool!

Digging In

There was a fair amount of circumstantial evidence that the monitoring tool was responsible. It was running on the server with the slower code and it wasn’t running on the server with the faster code. Disabling the monitoring tool made both CPU times match. However, how can we really prove that the monitoring tool is the culprit? Where exactly is that extra CPU time going?

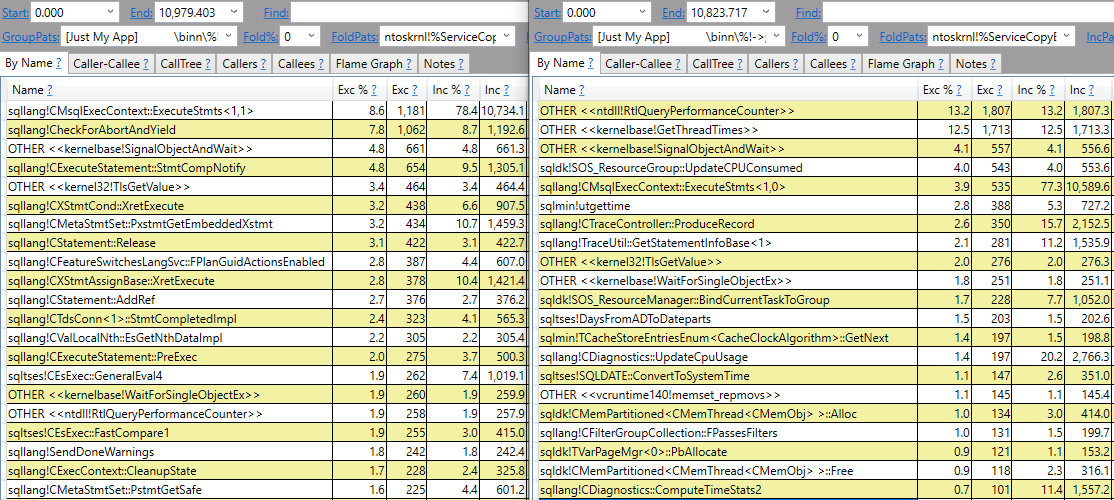
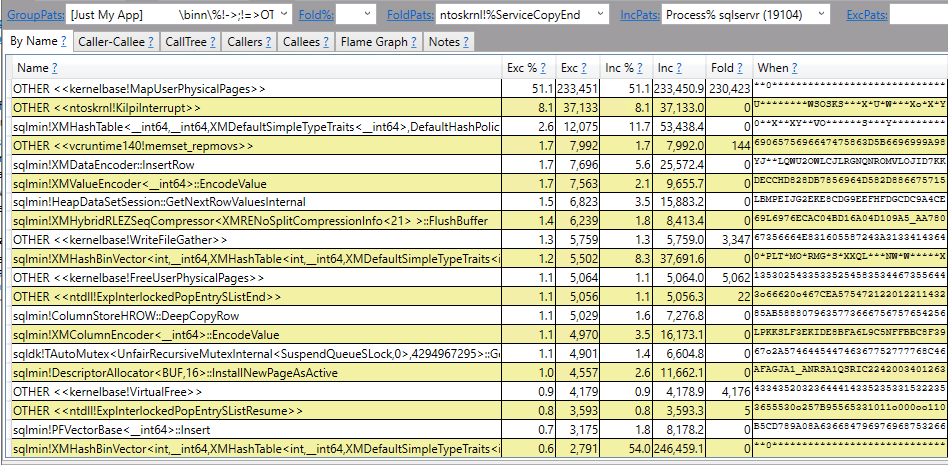
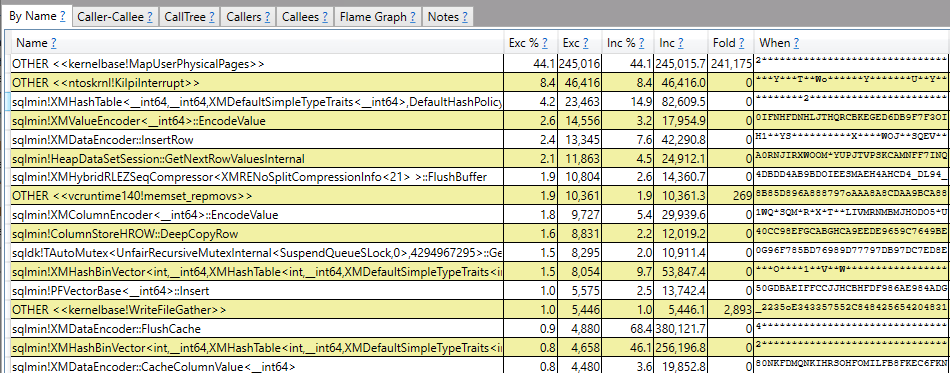
ETW tracing can provide a summary of call stacks during a sampled time period. Common choices are Windows Performance Recorder or PerfView. As usual, I will use PerfView. I was able to temporarily add third party monitoring to the server with the fast code. Fortunately, there wasn’t any other SQL Server work occurring during my testing so PerfView was quite effective at showing the difference between the two servers. In the image below, call stacks for slightly modified code without the monitoring tool are on the left. Call stacks for the same code with the monitoring tool present on the left are on the right:

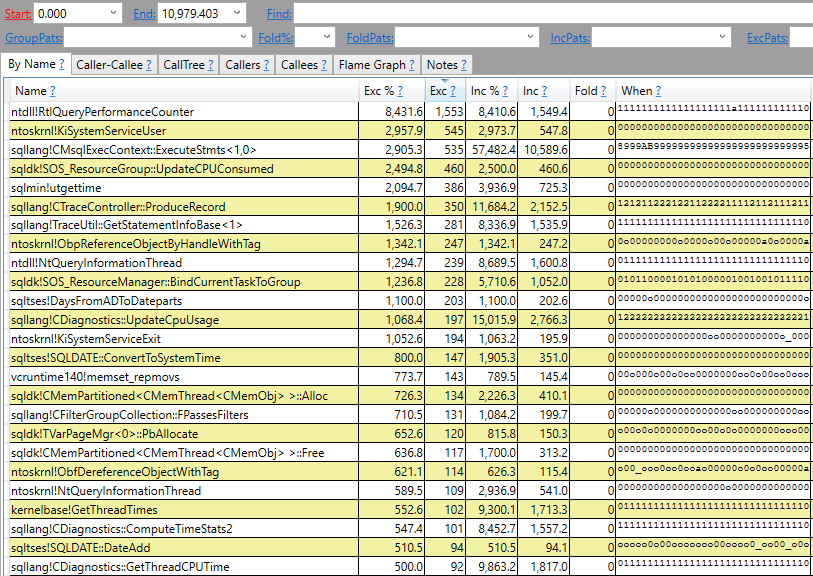
It doesn’t take a SQL Server expert to see that there are some notable differences here. I’m not an expert in SQL Server call stacks, but a lot of the stuff on the left is about what I would expect for extremely efficient code in a loop. It’s a similar feeling to those people who can identify photoshopped pictures by looking at the pixels. A lot of the stuff on the right is what I would expect if SQL Server is spending a relatively large percentage of CPU time doing monitoring, such as ntdll!RtlQueryPerformanceCounter and sqllang!TraceUtil::GetStatementInfoBase. Here’s a diff view if that makes it easier to see some of the differences:

The “exc” column is the difference of the number of CPU ms spent by the method itself (not including called methods). A positive number means that the slow code spent more CPU time on that method and a negative number (not shown in this picture) means that the fast code spend more CPU time on that method.

I would describe the PerfView results as fairly conclusive evidence: the third party SQL Server monitoring tool is responsible for the 8X difference in CPU time for the WHILE loop between the two servers.

Final Thoughts

The real production workload does something more important (and complicated) than simply incrementing a variable. Seeing an 8X performance difference in that simple code wasn’t a good or welcome sign, but I expect to see a dramatic reduction in monitoring overhead when benchmarking the real workload after disabling the monitoring tool. There may not be anything to fix here, but it’s always helpful to be reminded of everything that’s running on your servers. Thanks for reading!

Columnstore Loading on Eight Socket Servers

I had a brief opportunity to do SQL Server workload testing on an eight socket server. It didn’t go well.

Sockets

I’ll give an extremely brief introduction to NUMA and sockets because I have a bit more free time these days. You’re probably reading this blog post on a machine with a single socket. All that means is that there’s a single CPU chip plugged into the motherboard. All of the RAM for the machine is local to that CPU chip. The recent king of single socket performance for SQL Server is the Intel 8280. 28 cores at 2.7 GHz with the latest instruction sets is quite a lot of processing power. There’s a newer chip out there now but it’s not clear to me if anyone can buy it yet.

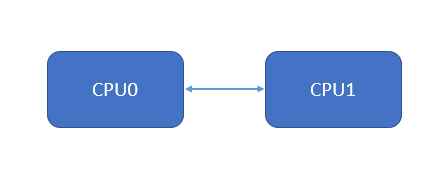
What can you do if a workload can’t be scaled out and it needs more than the CPU power available with a single socket solution? A two socket solution could be the answer. A two socket server has two CPU chips plugged into different slots on a motherboard and each CPU has a local bank of RAM. Any part of memory can be access by either CPU but there is a performance penalty for foreign memory access, which is just accessing memory from a different CPU. See the simple diagram below:

As mentioned earlier, it is more expensive for CPU0 to access memory local to CPU1 compared to its own local memory. The performance penalty of NUMA will depend on the workload as well as the hardware. It can range from not noticeable at all to a serious issue that needs to be addressed in some way. In some situations this can be as easy as convincing your VM admin to change how the VM is set up. In others, your best bet may be to figure out a way to keep the workload on a single socket. Some folks advocate for single socket solutions compared to two socket solutions for OLTP workloads due to the NUMA penalty.

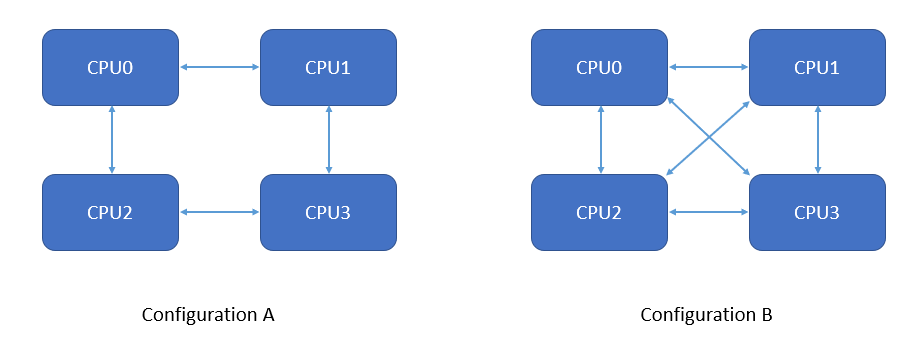
Perhaps you are wondering what happens if a workload needs more power available from a two socket server? Enter the four socket server. Four socket servers have four slots for CPU chips. An Intel 8280 processor in a four socket configuration gives you a total of 112 physical cores. That’s a lot. Four socket servers are more expensive than two socket servers and are significantly less common to find in data centers. Often, they are a custom order which makes months for the hardware vendor to build and deliver. In addition, the connections between CPUs are more complicated. Below are two common configurations:

Under configuration A, it takes two hops for CPU0 to access memory local to CPU3. That will increase latency more than going to CPU1 or CPU2. However, memory latency between CPUs won’t be the same for all pairs even in configuration B. In addition, it’s more complicated for SQL Server to try to manage memory on a four socket box. Even in the best case scenario for memory management, by design everything stored in SQL Server owned memory isn’t NUMA aware, such as the columnstore object pool. Nonetheless, if you need more CPU than a two socket server or VM can provide then you’re stuck living with the complexities of a four socket solution.

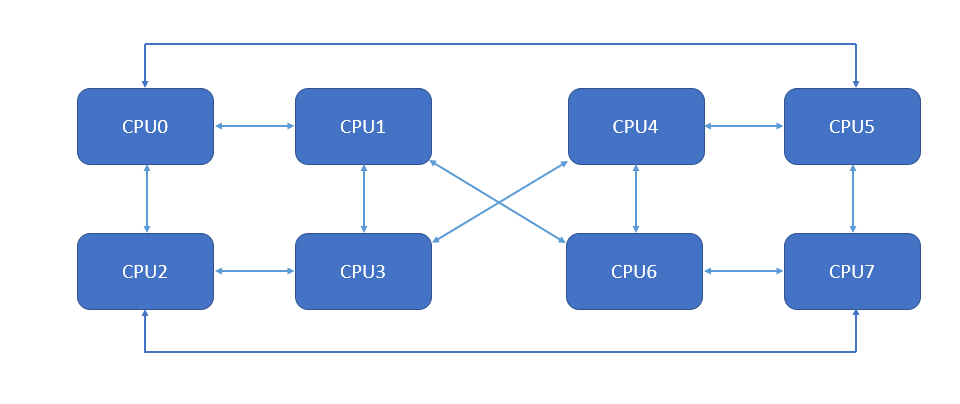
What if you need even more power? Hardware manufacturers once again have you covered with eight socket servers. These are even more expensive and uncommon than four socket solutions. Different vendors handle NUMA differently. There are simply more possible permutations with eight CPUs compared to four. I’m told that the following is an example layout for an eight socket machine:

I’m not a NUMA expert by any means. However, I think it’s fair to say that it looks a lot more complicated. There are many more instances where accessing foreign memory will take two hops instead of one. I also don’t see a way to carve out a four socket VM with all CPUs just one hop away. All in all, that diagram makes me nervous. As a final note, eight socket machines are not the limit of what’s possible, but I’ll stop here because I’ve never run code on anything larger than eight sockets.

Test Setup

I elected to use a high concurrency CCI insert workload to compare performance between a four socket VM and an eight socket VM. Quite conveniently, I already had a test columnstore workload that I knew pushed the SQL Server scalability limits in terms of memory management. To perform the threading I used the SQL Server Multi Thread open source framework. I wanted all sessions to go to their own schedulers. That could have been tough to manage with tests up to 200 threads but the threading framework handles that automatically.

For those following along at home, testing was done with SQL Server 2019 with LPIM and TF 876 enabled. Guest VMs were built with VMware with Windows Server 2019 installed. The four and eight socket VMs were created on the same physical host with about 5.5 TB of RAM available to the guest OS in both configurations.

Test Results

In case you didn’t click the earlier link, each job inserts about 10.4 million rows into a table with a clustered columnstore index. The smallest test ran just a single thread. The largest test on the four socket VM ran 100 concurrent jobs for a total insert volume of a billion rows. The largest test on the eight socket VM ran 200 concurrent jobs for a total insert volume of two billion rows. In all test scenarios, the four socket VM performed more work per second than the eight socket VM:

Quite a disappointing result. Double your SQL Server license fees for a slower overall system! There are the expected memory related wait stats for the 200 thread result:

I grabbed a sample of callstacks with PerfView:

Drilling into the top stack shows that decommitting memory is a scalability issue:

The stacks for the 100 thread test on the four socket VM results are a bit surprising by comparison:

Overall CPU reported by PerfView is the same. Perhaps this is a limitation of the tool. However, it really does seem like all of those extra cores simply aren’t helping under the eight socket configuration. Throughput goes down instead of up. I had very limited time with this machine and don’t want to repeat much of a previous blog post, so I’ll stop the technical analysis here. It’s likely that nothing can really be done to improve the workload except large configuration or hardware changes.

If I had to make this workload perform better, I would directly engage with the vendors. If that didn’t work, I would try a bare metal configuration, SQL Server on Linux, or running on an eight socket machine from a different vendor. I think that it’s fair to say that the test results would be different, but I can’t speculate as to whether they would be better or worse or what the difference would be.

Final Thoughts

We live in a wonderful era of hardware prosperity. With a big enough checkbook, you can run your SQL Server workloads on servers with hundreds of CPU cores. However, proceed with extreme caution if you’re considering moving a SQL Server workload to a server or VM with more than four sockets. It might not scale as well as you’re hoping. Thanks for reading!

The Trillion Row Operator In SQL Server

SQL Server friend and excellent webmaster Mr. Erik C. Darling showed me a query plan gone wrong:

SQL Server Query Plan48 billion rows for a single operator is certainly a large number for most workloads. I ended up completely missing the point and started wondering how quickly a query could process a trillion rows through a single operator. Eventually that led to a SQL performance challenge: what is the fastest that you can get an actual plan with at least one operator processing a trillion rows? The following rules are in play:

  1. Start with no user databases
  2. Any query can run up to MAXDOP 8
  3. Temp tables may be created and populated but all such work needs to finish in 30 seconds or less
  4. A RECOMPILE query hint must be present in the final query
  5. Undocumented features and behavior are fair game

Unless stated otherwise here, all testing was done on SQL Server 2017 CU20. The processor of my local machine is an Intel i7-9700K. If you’re following along at home you may see different results depending on your hardware. The queries are extremely CPU intensive. If you’d like to skip ahead to the winning query then scroll down the bottom.

Loop Join

A natural way to generate a lot of rows quickly is to cross join together two equally sized tables. Throwing a million rows into a temporary table takes very little time. Finding the count of the result set should meet the challenge requirements as long as the right optimizer transforms are not available. An initial attempt for data prep:

DROP TABLE IF EXISTS #loop_test;

CREATE TABLE #loop_test (
ID TINYINT NOT NULL
);

INSERT INTO #loop_test WITH (TABLOCK)
SELECT TOP (1000000) CAST(0 AS TINYINT) ID
FROM master..spt_values t1
CROSS JOIN master..spt_values t2
OPTION (MAXDOP 1);

CREATE STATISTICS S1 ON #loop_test (ID) WITH FULLSCAN, NORECOMPUTE;

Along with the query to run:

SELECT COUNT_BIG(*)
FROM #loop_test t1 WITH (TABLOCK)
CROSS JOIN #loop_test t2 WITH (TABLOCK)
OPTION (RECOMPILE, MAXDOP 8);

The query returns the expected result of 1 trillion, but there is no operator that processes one trillion rows:

SQL Server Query Plan

The query optimizer uses the LocalAggBelowJoin rule to perform an aggregate before the join. This brings down the total query estimated cost from 1295100 units to 6.23274 units for quite a savings. Trying again after disabling the transform:

SELECT COUNT_BIG(*)
FROM #loop_test t1 WITH (TABLOCK)
CROSS JOIN #loop_test t2 WITH (TABLOCK)
OPTION (RECOMPILE, MAXDOP 8, QueryRuleOff LocalAggBelowJoin);

Results in a new query plan:

SQL Server Query Plan

This query meets the requirements of the challenge. The stream aggregate, nested loops, and row count spool operators will process 1 trillion rows each. However, it is unsatisfactory from a performance point of view. The row mode stream aggregate has a significant profiling penalty compared to a batch mode hash aggregate alternative. It is simple enough to create a dummy table to add batch mode eligibility for the query plan:

DROP TABLE IF EXISTS #cci;
CREATE TABLE #cci (ID INT, INDEX CCI CLUSTERED COLUMNSTORE)

SELECT COUNT_BIG(*)
FROM #loop_test t1 WITH (TABLOCK)
CROSS JOIN #loop_test t2 WITH (TABLOCK)
LEFT OUTER JOIN #cci ON 1 = 0
OPTION (RECOMPILE, MAXDOP 8, QueryRuleOff LocalAggBelowJoin);

The new plan has a nice batch mode operator to do the counting:

SQL Server Query Plan

With an actual plan request, the new query processes rows at roughly twice the rate as the row mode query. Perhaps query profiling does its work once per batch for batch mode operators and once per row for row mode operators. Each batch has around 900 rows so profiling might be much cheaper per row for the hash aggregate compared to the stream aggregate. Strictly speaking, the goal of this challenge is to optimize the amount of time it takes to get an actual plan. This might lead to different tuning results than optimizing for query completion time without an actual plan request.

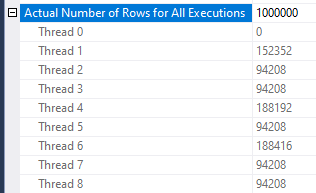
The final time for the batch mode query is 2 hours and 12 minutes. I uploaded an actual plan to pastetheplan.com. The query has a CPU to elapsed time ratio of only 5.37. That means on that average during query execution, more than 2.5 CPU cores were not doing useful work. Getting all eight CPU cores to perform work as much as possible during query execution should allow the query to finish faster. The CPU imbalance in this case is caused by how rows are distributed to threads on the outer side of the nested loop operator:

SQL Server Threads

The query engine has different algorithm choices to perform a parallel scan of a table. In this case, it doesn’t pick an algorithm that leads to optimal performance. The nested loop operator in total drives 42717 seconds of CPU work. It’s important to have that work as balanced between threads as possible. In this situation it is helpful to reduce the number of rows per page. To understand why I recommend watching this Pass Summit presentation by Adam Machanic. This results in better row distribution between threads and theoretically better performance. The following code only allows for a single row per data page:

DROP TABLE IF EXISTS #wide_1_million_rows;

CREATE TABLE #wide_1_million_rows (
ID TINYINT NOT NULL,
FILLER VARCHAR(4200) NOT NULL
);

INSERT INTO #wide_1_million_rows WITH (TABLOCK)
SELECT TOP (1000000) CAST(0 AS TINYINT) ID, REPLICATE('Z', 4200) FILLER
FROM master..spt_values t1
CROSS JOIN master..spt_values t2
OPTION (MAXDOP 1);

CREATE STATISTICS S1 ON #wide_1_million_rows (ID) WITH FULLSCAN, NORECOMPUTE;

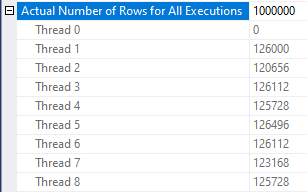
The new query plan generates in 1:29:40 with a CPU ratio of the query is 7.977 which is near perfect. Rows are quite balanced between threads:

SQL Server Threads

I don’t know of a method to further optimize the nested loop join query. Most of the query’s execution time is spent on profiling. Sampled stacks from 15 seconds of query execution:

ETW tracing tools such as PerfView along with internals knowledge can be used to more finely break down how CPU is used by this query. Almost 75% of the query’s execution time is spent on sqlmin!CQScanProfileNew:GetRowImp and on methods called by it. The query only takes 23 minutes to complete without an actual plan which is quite close to 25% of the runtime with an actual plan. If you’re interested in more examples of using PerfView to draw conclusiosn about SQL Server consider checking out the list of links in this stack exchange answer.

Merge Join

A cross join can only be implemented as a nested loop join but the same end result can be emulated with a merge join. Let’s start with testing a MAXDOP 1 query. Setup:

DROP TABLE IF EXISTS #cci;
CREATE TABLE #cci (ID INT, INDEX CCI CLUSTERED COLUMNSTORE)

DROP TABLE IF EXISTS #merge_serial;

CREATE TABLE #merge_serial (
ID TINYINT NOT NULL
);

INSERT INTO #merge_serial WITH (TABLOCK)
SELECT TOP (1000000) 0 ID
FROM master..spt_values t1
CROSS JOIN master..spt_values t2
OPTION (MAXDOP 1);

CREATE CLUSTERED INDEX CI ON #merge_serial (ID);

The query to run:

SELECT COUNT_BIG(*)
FROM #merge_serial t1 WITH (TABLOCK)
INNER JOIN #merge_serial t2 WITH (TABLOCK) ON t1.ID = t2.ID
LEFT OUTER JOIN #cci ON 1 = 0
OPTION (RECOMPILE, MERGE JOIN, MAXDOP 1, QueryRuleOff LocalAggBelowJoin);

I did not allow the query to run to completion because it would have taken around 25 hours to complete. On an 8 core machine with merge join, there’s no reason to expect that a parallel query could do any better than 25/8 = 3.125 hours. This makes merge join an inferior option compared to loop join so there isn’t a good reason to pursue further approaches that use a merge join.

For completeness, the best merge plan time I was able to get was 5 hours and 20 minutes. The plan avoids the scalability issues found with parallel merge and order preserving repartition streams. The end result is still poor. The merge join simply consumes a lot of CPU to do its work. The additional overhead added by the loop join is not helpful.

Row Mode Hash Join

Perhaps we’ll have more luck with a hash join compared to a merge join. After all, the query optimizer assigns a lower estimated cost for a row mode hash join compared to a merge join for the trillion row scenario. What could go wrong? The first thing that goes wrong is that the addition of the empty CCI will lead to a batch mode hash join for this query. Avoiding that requires changing the join to a type that doesn’t allow for batch mode execution. Among other methods, this can be accomplished by putting the hash join on the inner side of a nested loop or changing the join to also match on NULL. The second technique will be used at first because it leads to significantly less overhead compared to the loop join approach.

Starting again with a MAXDOP 1 test:

DROP TABLE IF EXISTS #cci;
CREATE TABLE #cci (ID INT, INDEX CCI CLUSTERED COLUMNSTORE)

DROP TABLE IF EXISTS #hash_maxdop_1;
CREATE TABLE #hash_maxdop_1 (
	ID TINYINT NULL
);

INSERT INTO #hash_maxdop_1 WITH (TABLOCK)
SELECT TOP (1000000) 0 
FROM master..spt_values t1
CROSS JOIN master..spt_values t2
OPTION (MAXDOP 1);

CREATE STATISTICS S1 ON #hash_maxdop_1 (ID) WITH FULLSCAN, NORECOMPUTE;

The test query has a more complex join condition:

SELECT COUNT_BIG(*)
FROM #hash_maxdop_1 t1 WITH (TABLOCK)
INNER HASH JOIN #hash_maxdop_1 t2 WITH (TABLOCK) ON t1.ID = t2.ID OR (t1.ID IS NULL AND t2.ID IS NULL)
LEFT OUTER JOIN #cci ON 1 = 0
OPTION (MAXDOP 1, RECOMPILE)

Note how the join now includes rows where both sides are NULL. There are no such rows in the table but the query optimizer does not know that so a row mode join is used. The query completed in 5.5 hours. This means that a parallel hash join approach could be competitive with the nested loop join. An optimistic time estimate for a parallel query is 41 minutes.

Getting a parallel query isn’t as simple as changing MAXDOP from 1 to 8 will not have the desired effect. Take a look at the following query plan born from such an attempt:

SQL Server Query Plan

The repartition stream operators have a partitioning type of hash. That means that a hashing algorithm is used to assign rows to different threads. All of the rows from the table have the same column value, so they will all hash to the same value and will end up on the same thread. Seven CPUs will have no work to do even though the query technically executes at DOP 8. This will not lead to performance that’s better than executing at DOP 1.

Through testing I found that the following values for a nullable TINYINT all go to different threads: 0, 1, 4, 5, 7, 9, 14, and 17. Note that I’m relying on undocumented details here that might change between releases. Inserting 250k rows of each value into one table and 500k rows of each value into another table should result in 8 * 250000 * 500000 = 1 trillion rows total. Code to do this is below:

DROP TABLE IF EXISTS #cci;
CREATE TABLE #cci (ID INT, INDEX CCI CLUSTERED COLUMNSTORE)

DROP TABLE IF EXISTS #row_hash_join_repartition_8_build;
CREATE TABLE #row_hash_join_repartition_8_build (
	ID TINYINT NULL
);

INSERT INTO #row_hash_join_repartition_8_build
SELECT TOP (2000000) CASE ROW_NUMBER() OVER (ORDER BY (SELECT NULL)) % 8 
WHEN 0 THEN 0
WHEN 1 THEN 1
WHEN 2 THEN 4
WHEN 3 THEN 5
WHEN 4 THEN 7
WHEN 5 THEN 9
WHEN 6 THEN 14
ELSE 17
END
FROM master..spt_values t1
CROSS JOIN master..spt_values t2
OPTION (MAXDOP 1);

CREATE STATISTICS S1 ON #row_hash_join_repartition_8_build (ID) WITH FULLSCAN, NORECOMPUTE;


DROP TABLE IF EXISTS #row_hash_join_repartition_8_probe;
CREATE TABLE #row_hash_join_repartition_8_probe (
	ID TINYINT NULL
);

INSERT INTO #row_hash_join_repartition_8_probe
SELECT TOP (4000000) CASE ROW_NUMBER() OVER (ORDER BY (SELECT NULL)) % 8 
WHEN 0 THEN 0
WHEN 1 THEN 1
WHEN 2 THEN 4
WHEN 3 THEN 5
WHEN 4 THEN 7
WHEN 5 THEN 9
WHEN 6 THEN 14
ELSE 17
END
FROM master..spt_values t1
CROSS JOIN master..spt_values t2
CROSS JOIN master..spt_values t3
OPTION (MAXDOP 1);

CREATE STATISTICS S1 ON #row_hash_join_repartition_8_probe (ID) WITH FULLSCAN, NORECOMPUTE;

Along with the query to run:

SELECT COUNT_BIG(*)
FROM #row_hash_join_repartition_8_build t1 WITH (TABLOCK)
INNER JOIN #row_hash_join_repartition_8_probe t2 WITH (TABLOCK) ON t1.ID = t2.ID OR (t1.ID IS NULL AND t2.ID IS NULL)
LEFT OUTER JOIN #cci ON 1 = 0
OPTION (RECOMPILE, HASH JOIN, MAXDOP 8, QueryRuleOff LocalAggBelowJoin);

The query plan appeared after 42 minutes with a CPU ratio of 7.7. This was a better result than I was expecting. The repartition stream operators don’t seem to have much of a negative effect on overall runtime.

For completeness, I also tested a parallel hash join plan without the repartition stream operators. All of the hash join work is on the inner side of a nested loop join. The loop join adds significant overhead so this ends up being a losing method. If you’d like to see for yourself, here is one way to set up the needed tables:

DROP TABLE IF EXISTS #cci;
CREATE TABLE #cci (ID INT, INDEX CCI CLUSTERED COLUMNSTORE)

DROP TABLE IF EXISTS #hash_join_demand_62500_rows;
CREATE TABLE #hash_join_demand_62500_rows (
	ID TINYINT NOT NULL
);

INSERT INTO #hash_join_demand_62500_rows WITH (TABLOCK)
SELECT TOP (62500) ISNULL(CAST(0 AS TINYINT), 0) ID
FROM master..spt_values t1
CROSS JOIN master..spt_values t2
OPTION (MAXDOP 1);

CREATE STATISTICS S1 ON #hash_join_demand_62500_rows (ID);

As well as one way to generate such a query:

SELECT COUNT_BIG(*)
FROM
(VALUES
	  (0),(0),(0),(0),(0),(0),(0),(0)
	, (0),(0),(0),(0),(0),(0),(0),(0)
	, (0),(0),(0),(0),(0),(0),(0),(0)
	, (0),(0),(0),(0),(0),(0),(0),(0)
	, (0),(0),(0),(0),(0),(0),(0),(0)
	, (0),(0),(0),(0),(0),(0),(0),(0)
	, (0),(0),(0),(0),(0),(0),(0),(0)
	, (0),(0),(0),(0),(0),(0),(0),(0)
	, (0),(0),(0),(0),(0),(0),(0),(0)
	, (0),(0),(0),(0),(0),(0),(0),(0)
	, (0),(0),(0),(0),(0),(0),(0),(0)
	, (0),(0),(0),(0),(0),(0),(0),(0)
	, (0),(0),(0),(0),(0),(0),(0),(0)
	, (0),(0),(0),(0),(0),(0),(0),(0)
	, (0),(0),(0),(0),(0),(0),(0),(0)
	, (0),(0),(0),(0),(0),(0),(0),(0)
	, (0),(0),(0),(0),(0),(0),(0),(0)
	, (0),(0),(0),(0),(0),(0),(0),(0)
	, (0),(0),(0),(0),(0),(0),(0),(0)
	, (0),(0),(0),(0),(0),(0),(0),(0)
	, (0),(0),(0),(0),(0),(0),(0),(0)
	, (0),(0),(0),(0),(0),(0),(0),(0)
	, (0),(0),(0),(0),(0),(0),(0),(0)
	, (0),(0),(0),(0),(0),(0),(0),(0)
	, (0),(0),(0),(0),(0),(0),(0),(0)
	, (0),(0),(0),(0),(0),(0),(0),(0)
	, (0),(0),(0),(0),(0),(0),(0),(0)
	, (0),(0),(0),(0),(0),(0),(0),(0)
	, (0),(0),(0),(0),(0),(0),(0),(0)
	, (0),(0),(0),(0),(0),(0),(0),(0)
	, (0),(0),(0),(0),(0),(0),(0),(0)
	, (0),(0),(0),(0),(0),(0),(0),(0)
) v(v)
CROSS JOIN (
	SELECT 1 c
	FROM #hash_join_demand_62500_rows t1 WITH (TABLOCK)
	INNER HASH JOIN #hash_join_demand_62500_rows t2 WITH (TABLOCK) ON t1.ID = t2.ID
) ca
LEFT OUTER JOIN #cci ON 1 = 0
OPTION (RECOMPILE, FORCE ORDER, MAXDOP 8, MIN_GRANT_PERCENT = 99, NO_PERFORMANCE_SPOOL);

It might be difficult to understand what’s going on here, so here’s a picture of the query plan:

SQL Server Query Plan

Work is split up into 256 buckets. Each row fed into the outer side of the nested loop join results in 62500 rows hash joined with 62500 rows.

The disappointing final result takes about 2 hours of runtime. This query might perform better on a busy system compared to the simple parallel hash join because work is assigned to threads somewhat on demand. In this case, the repartition streams query query requires equal work to be completed on all threads. However, the testing environment only has a single query running at a time.

The query pattern here is similar to a parallel apply. Perhaps you’ve heard good things about that pattern and are wondering why it didn’t work out here. In my experience, that query pattern does best when an order preserving repartition streams operator can be avoided, there’s a supporting index on the inner side, and the row count coming out of the inner side is relatively low. The above query is 0 for 3.

Batch Mode Hash Join

I’ll be honest. I expected batch mode hash join to be the winner. I was wrong. Batch mode parallelism works in a fundamentally different way than row mode parallelism. There is no repartition streams operator which assigns rows to different threads based on a hash or other algorithm. Rather, each operator takes care of parallelism by itself. In my experience this is generally quite advantageous for both performance and scalability, but there can be drawbacks.

We intend to get a batch mode hash join, so it seems logical enough to join together a CCI with one million rows. Sample code to do that:

DROP TABLE IF EXISTS #batch_mode_hash_equal_sized;

CREATE TABLE #batch_mode_hash_equal_sized (
ID TINYINT NOT NULL,
INDEX CCI CLUSTERED COLUMNSTORE
);

INSERT INTO #batch_mode_hash_equal_sized WITH (TABLOCK)
SELECT TOP (1000000) CAST(0 AS TINYINT) ID
FROM master..spt_values t1
CROSS JOIN master..spt_values t2
OPTION (MAXDOP 1);

CREATE STATISTICS S1 ON #batch_mode_hash_equal_sized (ID) WITH FULLSCAN, NORECOMPUTE;

The query to be run no longer needs the join to the empty CCI table:

SELECT COUNT_BIG(*) 
FROM #batch_mode_hash_equal_sized c1
INNER JOIN #batch_mode_hash_equal_sized c2 ON c1.ID = c2.ID
OPTION (RECOMPILE, MAXDOP 8, QueryRuleOff LocalAggBelowJoin);

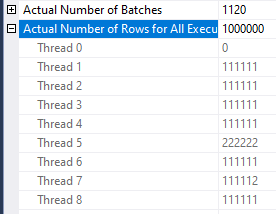
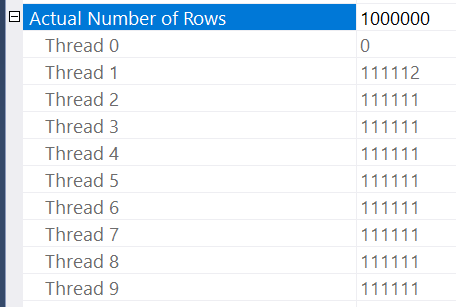
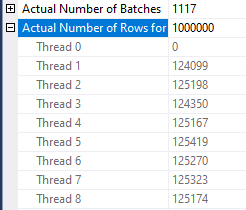
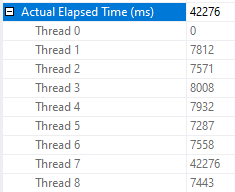
An actual plan is generated on my machine in about 27.5 minutes. While clearly better than all other attempts so far, the CPU to elapsed ratio suggests that significant improvement is possible: it is only 4.6 out of a possible 8.0. Batch mode processing is generous enough to provide a helpful wait stat. There is about 5607 seconds of the HTDELETE wait. Put simply, some of the threads of the hash join ran out of work to do and waited for the other threads to finish their work. As I understand it with batch mode joins, the probe side is what matters in terms of work imbalance. Row count per thread of the probe side:

SQL Server Threads

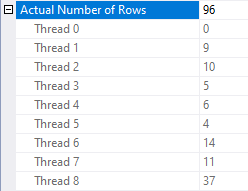
The million row CCI table is split up into 9 chunks of rows which are divided between 8 threads which leads to many threads having no work to do for a while. Quite unfortunate. Oddly enough, switching to MAXDOP 9 could lead to much better performance for this query. That isn’t an available option on my local machine so I switched to testing on a VM with Intel 8280 sockets. The theory works out: the MAXDOP 8 query takes 50 minutes to complete and the MAXDOP 9 query takes 25 minutes to complete. At MAXDOP 9 the row distribution is quite nice on the probe side:

SQL Server Threads

The rules for the different algorithms available to do parallel scans on CCIs are not documented. I previously investigated it here. Interestingly enough, this is an example where an exchange operator could make a positive difference. However, the batch mode hash join doesn’t have that as an option. While there are various tricks to achieve even row distribution from a CCI, it seems simplest to just replace the tables with row store. Converting 2 million rows from row mode to batch mode won’t add any measurable overhead. Using the same table that was used for the best loop join time:

SELECT COUNT_BIG(*) 
FROM #wide_1_million_rows c1
INNER JOIN #wide_1_million_rows c2 ON c1.ID = c2.ID
LEFT OUTER JOIN #cci ON 1 = 0
OPTION (RECOMPILE, MAXDOP 8, QueryRuleOff LocalAggBelowJoin)

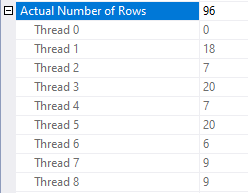
The new query plan finishes in just under 16 minutes. Row distribution per thread on the probe side is much more even:

SQL Server Threads

You might be thinking that 16 minutes is a pretty good result. I too initially thought that.

The Winner

All of the previous approaches spent the vast majority of their time performing a join to generate rows from smaller tables. The scans of the underlying tables themselves were quite fast. Perhaps a better approach would be to avoid the join entirely. For example, consider inserting a billion rows into a table and scanning that table 1000 times with UNION ALL. That would send one trillion rows to a single operator without the expense of a join. Of course, the downside is that SQL Server would need to read one trillion rows total from a table. It would be important to make the reading of rows as efficient as possible. The most efficient method I know is to create a columnstore table with extreme compression.

The title of this section gives it away, but let’s start with a small scale test to see if the approach has merit. Code to load 100 million rows into a CCI:

DROP TABLE IF EXISTS #count_test;

CREATE TABLE #count_test (
ID TINYINT NOT NULL,
INDEX CCI CLUSTERED COLUMNSTORE
);

INSERT INTO #count_test WITH (TABLOCK)
SELECT TOP (100000000) 0 ID
FROM master..spt_values t1
CROSS JOIN master..spt_values t2
CROSS JOIN master..spt_values t3
OPTION (MAXDOP 1);

CREATE STATISTICS S1 ON #count_test (ID);

SQL Server is able to compress this data quite well because there’s just a single unique value. The table is only 1280 KB in size. The data prep code does exceeds the 30 second time limit on my machine due to the statistics creation, but I’ll ignore that for now because it’s just a trial run. I can avoid all types of early aggregation with the following syntax:

SELECT COUNT_BIG(*)
FROM
(
	SELECT ID
	FROM #count_test
	UNION ALL
	SELECT ID
	FROM #count_test
) q
OPTION (RECOMPILE, MAXDOP 8, FORCE ORDER)

Picture of the query plan:

SQL Server Query Plans

On my machine, that query takes about 41 ms to process 200 million rows. Based on that, it seems reasonable to expect that a query that processes a trillion rows could finish in under four minutes. There is a balancing act to perform here. Putting more rows into the table makes it harder to complete data prep within 30 seconds, but cuts down on the number of UNION ALLs performed which reduces query compilation time.

The approach that I settled on was to load 312.5 million rows into a table. Reading that table 3200 times results in a trillion total rows. 3200 is a convenient number to achieve with nested CTEs and I’m able to load 312.5 million rows quite reliably under 30 seconds even with MAXDOP 4. I can’t say that this is the best possible approach but it seems to work fairly well.

The last detail in terms of data prep is to deal with statistics creation. SQL Server forces a sample rate of 100% for very small tables. Unfortunately, extremely compressed columnstore indexes can fall into the 100% range even if they have a high row count. Creating a statistic object with a sample of 312.5 million rows will take longer than 30 seconds. I don’t need good statistics for query performance so I work around the issue by creating a statistic with NORECOMPUTE after an initial load of 500k rows. Code to create and populate a CCI with 312.5 million rows:

DROP TABLE IF EXISTS #CCI_1M_ONE_COLUMN;

CREATE TABLE #CCI_1M_ONE_COLUMN (ID TINYINT NOT NULL, INDEX I CLUSTERED COLUMNSTORE);

DECLARE @insert_count TINYINT = 0;
WHILE @insert_count < 8
BEGIN
	INSERT INTO #CCI_1M_ONE_COLUMN
	SELECT TOP (125000) 0
	FROM master..spt_values t1
	CROSS JOIN master..spt_values t2
	OPTION (MAXDOP 1);

	SET @insert_count = @insert_count + 1;
END;

DROP TABLE IF EXISTS #C;

CREATE TABLE #C (I TINYINT NOT NULL, INDEX I CLUSTERED COLUMNSTORE);

INSERT INTO #C WITH (TABLOCK)
SELECT TOP (500000) 0
FROM #CCI_1M_ONE_COLUMN
OPTION (MAXDOP 1);

CREATE STATISTICS S ON #C (I) WITH NORECOMPUTE, FULLSCAN;

WITH C13 AS (
	SELECT ID FROM #CCI_1M_ONE_COLUMN
	UNION ALL
	SELECT ID FROM #CCI_1M_ONE_COLUMN
	UNION ALL
	SELECT ID FROM #CCI_1M_ONE_COLUMN
	UNION ALL
	SELECT ID FROM #CCI_1M_ONE_COLUMN
	UNION ALL
	SELECT ID FROM #CCI_1M_ONE_COLUMN
	UNION ALL
	SELECT ID FROM #CCI_1M_ONE_COLUMN
	UNION ALL
	SELECT ID FROM #CCI_1M_ONE_COLUMN
	UNION ALL
	SELECT ID FROM #CCI_1M_ONE_COLUMN
	UNION ALL
	SELECT ID FROM #CCI_1M_ONE_COLUMN
	UNION ALL
	SELECT ID FROM #CCI_1M_ONE_COLUMN
	UNION ALL
	SELECT ID FROM #CCI_1M_ONE_COLUMN
	UNION ALL
	SELECT ID FROM #CCI_1M_ONE_COLUMN
	UNION ALL
	SELECT ID FROM #CCI_1M_ONE_COLUMN
)
, C312 AS
 (
	SELECT ID FROM C13
	UNION ALL
	SELECT ID FROM C13
	UNION ALL
	SELECT ID FROM C13
	UNION ALL
	SELECT ID FROM C13
	UNION ALL
	SELECT ID FROM C13
	UNION ALL
	SELECT ID FROM C13
	UNION ALL
	SELECT ID FROM C13
	UNION ALL
	SELECT ID FROM C13
	UNION ALL
	SELECT ID FROM C13
	UNION ALL
	SELECT ID FROM C13
	UNION ALL
	SELECT ID FROM C13
	UNION ALL
	SELECT ID FROM C13
	UNION ALL
	SELECT ID FROM C13
	UNION ALL
	SELECT ID FROM C13
	UNION ALL
	SELECT ID FROM C13
	UNION ALL
	SELECT ID FROM C13
	UNION ALL
	SELECT ID FROM C13
	UNION ALL
	SELECT ID FROM C13
	UNION ALL
	SELECT ID FROM C13
	UNION ALL
	SELECT ID FROM C13
	UNION ALL
	SELECT ID FROM C13
	UNION ALL
	SELECT ID FROM C13
	UNION ALL
	SELECT ID FROM C13
	UNION ALL
	SELECT ID FROM C13
)
INSERT INTO #C WITH (TABLOCK)
SELECT 0
FROM C312
OPTION (MAXDOP 4, FORCE ORDER, QueryRuleOff GenLGAgg, QueryRuleOff EnforceBatch, QueryRuleOff GbAggToStrm);


DBCC TRACEON(10204);

ALTER INDEX I ON #C REORGANIZE WITH (COMPRESS_ALL_ROW_GROUPS = ON);

DBCC TRACEOFF(10204);

The above code isn’t as efficient as possible but it gets the job done. It also provides a preview of the syntax that is used to query the table 3200 times. A nested CTE approach is used instead of writing out UNION ALL 3199 times. Trace flag 10204 is used because there’s no need to act on rows outside of the delta rowgroups.

Query compile time can be quite significant for this query. On an older PC while running these queries, I could determine when the query compile ended by a change in fan noise. The new additions to the query hints are there to minimize query compile time as much as possible. This is important when a table is referenced 3200 times in a query. I’m told that there are undocumented trace flags which can reduce query compile time even more but I’ll leave that as an exercise to the reader. Here’s the query text of the UNION ALL approach:

WITH C8 AS (
	SELECT I FROM #C WITH (TABLOCK)
	UNION ALL
	SELECT I  FROM #C WITH (TABLOCK)
	UNION ALL
	SELECT I FROM #C WITH (TABLOCK)
	UNION ALL
	SELECT I FROM #C WITH (TABLOCK)
	UNION ALL
	SELECT I FROM #C WITH (TABLOCK)
	UNION ALL
	SELECT I FROM #C WITH (TABLOCK)
	UNION ALL
	SELECT I FROM #C WITH (TABLOCK)
	UNION ALL
	SELECT I FROM #C WITH (TABLOCK)
)
, C160 AS
 (
	SELECT I FROM C8
	UNION ALL
	SELECT I FROM C8
	UNION ALL
	SELECT I FROM C8
	UNION ALL
	SELECT I FROM C8
	UNION ALL
	SELECT I FROM C8
	UNION ALL
	SELECT I FROM C8
	UNION ALL
	SELECT I FROM C8
	UNION ALL
	SELECT I FROM C8
	UNION ALL
	SELECT I FROM C8
	UNION ALL
	SELECT I FROM C8
	UNION ALL
	SELECT I FROM C8
	UNION ALL
	SELECT I FROM C8
	UNION ALL
	SELECT I FROM C8
	UNION ALL
	SELECT I FROM C8
	UNION ALL
	SELECT I FROM C8
	UNION ALL
	SELECT I FROM C8
	UNION ALL
	SELECT I FROM C8
	UNION ALL
	SELECT I FROM C8
	UNION ALL
	SELECT I FROM C8
	UNION ALL
	SELECT I FROM C8
)
, C3200 AS
(
	SELECT I FROM C160
	UNION ALL
	SELECT I FROM C160
	UNION ALL
	SELECT I FROM C160
	UNION ALL
	SELECT I FROM C160
	UNION ALL
	SELECT I FROM C160
	UNION ALL
	SELECT I FROM C160
	UNION ALL
	SELECT I FROM C160
	UNION ALL
	SELECT I FROM C160
	UNION ALL
	SELECT I FROM C160
	UNION ALL
	SELECT I FROM C160
	UNION ALL
	SELECT I FROM C160
	UNION ALL
	SELECT I FROM C160
	UNION ALL
	SELECT I FROM C160
	UNION ALL
	SELECT I FROM C160
	UNION ALL
	SELECT I FROM C160
	UNION ALL
	SELECT I FROM C160
	UNION ALL
	SELECT I FROM C160
	UNION ALL
	SELECT I FROM C160
	UNION ALL
	SELECT I FROM C160
	UNION ALL
	SELECT I FROM C160
)
SELECT COUNT_BIG(*)
FROM C3200
OPTION (RECOMPILE, MAXDOP 8, FORCE ORDER, QueryRuleOff GenLGAgg, QueryRuleOff EnforceBatch, QueryRuleOff GbAggToStrm);

The good news is that generating an actual plan takes about 3 minutes on my machine. The bad news is that uploading a 27 MB query plan is a lot more difficult than I thought. I ended up loading it to my personal website. You can view all of the XML in its glory here.

For a method more friendly to my personal bandwidth, you can look at the screenshot below:

SQL Server Query Plan

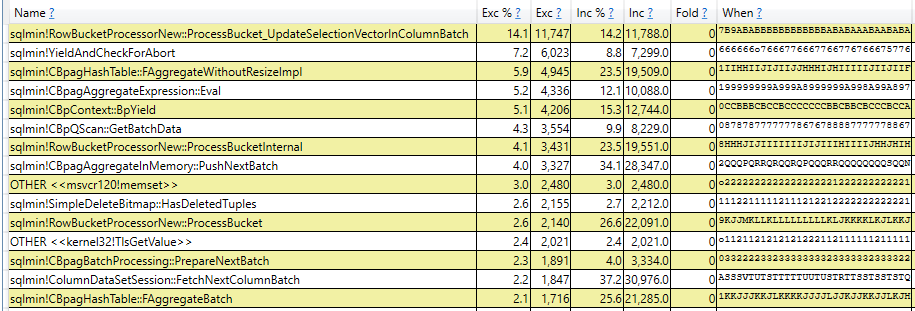
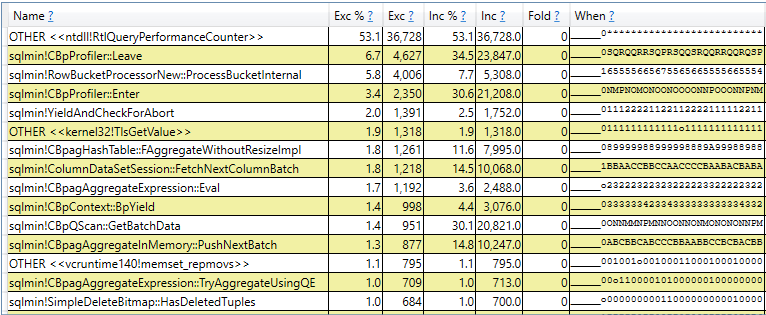
I don’t know of a more faster way to complete the challenge. Without an actual plan, the query takes about 63 seconds to complete. However, the query takes about 3 minutes to complete on SQL Server 2019, even without requesting an actual plan. The difference is caused by lightweight query profiling in SQL Server 2019, which is turned on by default. I find query profiling to be very useful in general for evaluating performance issues in real time and for estimating how long a query will take to complete. However, it can still add significant overhead for certain types of queries. The difference is quite apparent in the call stacks:

This is why I did all of my testing for this blog post on SQL Server 2017, in case you’ve been wondering that.

Final Thoughts

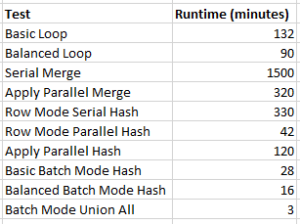
Summary of all attempts:

The results are quite specific to the test scenario: they should not be used to draw conclusions about general join performance. As mentioned earlier, in a few cases the bottleneck is the query profiling infrastructure instead of typical aspects of query performance. If anyone out there knows of a faster technique than those tested here, I would be delighted to learn about it.

Thanks for reading!

Going Further


If this is the kind of SQL Server stuff you love learning about, you’ll love my training. I’m offering a 75% discount to my blog readers if you click from here. I’m also available for consulting if you just don’t have time for that and need to solve performance problems quickly.
Using Exchange Demand Partitioning to Improve Parallel Query Scalability In SQL Server

One of our SQL Server workloads runs many concurrent parallel queries on a possibly already busy server. Other work occurring on the server can have dramatic effects on parallel query runtimes. One way to improve scalability of parallel query runtimes is to achieve query plans with operators that allow a dynamic amount of work to be completed by each parallel worker thread. For example, exchange operators with a partitioning type of hash or round robin force a typically even amount of work to be completed by each worker thread. If a worker thread happens to be on a busy scheduler then query runtime may increase due to the longer runtime of the worker thread that is competing for CPU resources. Serial zones in parallel query plans can of course have the same problem. Batch mode operators, exchange operators with a partitioning type of broadcast or demand, and the parallel page supplier are all examples of operators which can do a dynamic amount of work per thread. Those are the operators that I prefer to see in query plans for this workload.

Very little has been written about exchange operators with a partitioning type of demand, so I forgive you for not hearing of it before today. There is a brief explanation available here, an example of using demand partitioning to improve some query plans involving partitioned tables, and a Stack Exchange answer for someone comparing round robin and demand partitioning. You have the honor of reading perhaps the fourth blog post about the subject.

Start


The demos are somewhat dependent on hardware so you may not see identical results if you are following along. I’m testing on a machine with 8 CPU and with max server memory was set to 6000 MB. Start with a table with a multi-column primary key and insert about 34 million rows into it:

DROP TABLE IF EXISTS #;
CREATE TABLE # (
ID BIGINT NOT NULL,
ID2 BIGINT NOT NULL,
STRING_TO_AGG VARCHAR(MAX),
PRIMARY KEY (ID, ID2)
);

INSERT INTO # WITH (TABLOCK)
SELECT RN, v.v, REPLICATE('REPLICATE', 77)
FROM (
SELECT TOP (4800000) ROW_NUMBER() OVER (ORDER BY (SELECT NULL)) RN
FROM master..spt_values
CROSS JOIN master..spt_values t2
) q
CROSS JOIN (VALUES (1), (2), (3), (4), (5), (6), (7)) v(v);

The query tuning exercise is to insert the ID column and a checksum of the concatenation of all the STRING_TO_AGG values for each ID value ordered by ID2. This may seem like an odd thing to do but it is based upon a production example with an adjustment to not write as much data as the real query. Not all of us have SANs in our basements, or even have a basement. Use the following for the target table:

DROP TABLE IF EXISTS ##;

CREATE TABLE ## (
ID BIGINT NOT NULL,
ALL_STRINGS_CHECKSUM INT
);

Naturally we use SQL Server 2019 CU4 so the STRING_AGG function is available to us. Here is one obvious way to write the query:

INSERT INTO ## WITH (TABLOCK)
SELECT ID, CHECKSUM(STRING_AGG(STRING_TO_AGG , ',') WITHIN GROUP (ORDER BY ID2))
FROM #
GROUP BY ID
OPTION (MAXDOP 8);

The above query takes about 63 seconds on my machine with a cost of 2320.57 optimizer units. The query optimizer decided that a serial plan was the best choice:

SQL Server Query Plan

This is a rather lame result for a query tuning exercise so I will assume that I know better and force a parallel query plan with undocumented trace flag 8649. SQL Server warns us that the estimated cost is 4816.68 optimizer units but surely doesn’t expect a detail like that to stop me. The adjusted query executes in 75 seconds:

SQL Server Query Plan

My arrogance is checked. The parallel query is slower than the serial version that the query optimizer wanted us to have. The problem is the hash exchange operator. It is an order preserving exchange with a high MAXDOP and wide rows. This is the worst possible situation for exchange performance. How else can we write the query? Batch mode is not available for STRING_AGG so that’s out. Does anyone remember anything about tuning row mode queries?

The Dark Side


Query hints along with carefully constructed T-SQL are the pathway to many abilities, some considered to be unnatural. We can give the classic Parallel Apply query pattern made famous by Adam Machanic a shot to solve this problem. Perhaps you are thinking that there is no driving table for the outer side of a nested loop join, but we can create one by sampling the clustered index of the base table. I’ll skip that part here and just use what I know about the data to divide it into 96 equal ranges:

DROP TABLE IF EXISTS ###;
CREATE TABLE ### (s BIGINT NOT NULL, e BIGINT NOT NULL);

INSERT INTO ###
VALUES
(1, 50000),
(50001, 100000),
(100001, 150000),
(150001, 200000),
(200001, 250000),
(250001, 300000),
(300001, 350000),
(350001, 400000),
(400001, 450000),
(450001, 500000),
(500001, 550000),
(550001, 600000),
(600001, 650000),
(650001, 700000),
(700001, 750000),
(750001, 800000),
(800001, 850000),
(850001, 900000),
(900001, 950000),
(950001, 1000000),
(1000001, 1050000),
(1050001, 1100000),
(1100001, 1150000),
(1150001, 1200000),
(1200001, 1250000),
(1250001, 1300000),
(1300001, 1350000),
(1350001, 1400000),
(1400001, 1450000),
(1450001, 1500000),
(1500001, 1550000),
(1550001, 1600000),
(1600001, 1650000),
(1650001, 1700000),
(1700001, 1750000),
(1750001, 1800000),
(1800001, 1850000),
(1850001, 1900000),
(1900001, 1950000),
(1950001, 2000000),
(2000001, 2050000),
(2050001, 2100000),
(2100001, 2150000),
(2150001, 2200000),
(2200001, 2250000),
(2250001, 2300000),
(2300001, 2350000),
(2350001, 2400000),
(2400001, 2450000),
(2450001, 2500000),
(2500001, 2550000),
(2550001, 2600000),
(2600001, 2650000),
(2650001, 2700000),
(2700001, 2750000),
(2750001, 2800000),
(2800001, 2850000),
(2850001, 2900000),
(2900001, 2950000),
(2950001, 3000000),
(3000001, 3050000),
(3050001, 3100000),
(3100001, 3150000),
(3150001, 3200000),
(3200001, 3250000),
(3250001, 3300000),
(3300001, 3350000),
(3350001, 3400000),
(3400001, 3450000),
(3450001, 3500000),
(3500001, 3550000),
(3550001, 3600000),
(3600001, 3650000),
(3650001, 3700000),
(3700001, 3750000),
(3750001, 3800000),
(3800001, 3850000),
(3850001, 3900000),
(3900001, 3950000),
(3950001, 4000000),
(4000001, 4050000),
(4050001, 4100000),
(4100001, 4150000),
(4150001, 4200000),
(4200001, 4250000),
(4250001, 4300000),
(4300001, 4350000),
(4350001, 4400000),
(4400001, 4450000),
(4450001, 4500000),
(4500001, 4550000),
(4550001, 4600000),
(4600001, 4650000),
(4650001, 4700000),
(4700001, 4750000),
(4750001, 4800000);

I can now construct a query that gets a parallel apply type of plan:

INSERT INTO ## WITH (TABLOCK)
SELECT ca.*
FROM ### driver
CROSS APPLY (
	SELECT TOP (987654321987654321) ID, CHECKSUM(STRING_AGG(STRING_TO_AGG , ',') WITHIN GROUP (ORDER BY ID2)) ALL_STRINGS_CHECKSUM
	FROM # WITH (FORCESEEK)
	WHERE ID BETWEEN driver.s AND driver.e
	GROUP BY ID
) ca
OPTION (MAXDOP 8, NO_PERFORMANCE_SPOOL, FORCE ORDER);

This is an unnatural query plan. The query optimizer assigned it a cost of 36248.7 units. I had to add the TOP to get a valid query plan with an index seek. Removing the TOP operator results in error 8622. Naturally such things won’t stop us and running the query results in an execution time between 15 – 19 seconds on my machine which is the best result yet.

SQL Server Query Plan

This query plan has an exchange partitioning type of round robin. Recall such exchange types can lead to trouble if there’s other work executing on one of the schedulers used by a parallel worker thread. So far I’ve been testing these MAXDOP 8 queries with nothing else running on my 8 core machine. I can make a scheduler busy by running a MAXDOP 1 query that has no real reason to yield before exhausting its 4 ms quantum. Here is one way to accomplish that:

SELECT TOP (1) t1.high + t2.high + t3.high + t4.high
FROM master..spt_values t1
CROSS JOIN master..spt_values t2
CROSS JOIN master..spt_values t3
CROSS JOIN master..spt_values t4
ORDER BY t1.high + t2.high + t3.high + t4.high
OPTION (MAXDOP 1, NO_PERFORMANCE_SPOOL);

Wait stats for this query if you don’t believe me:

SQL Server Wait Stats

Running this query at the same time as the parallel query can apply a large performance penalty to the parallel query. The parallel query can take up to 48 seconds to execute if even a single worker thread has to share time on a scheduler with another. That is, the query ran 3 times slower when I added a single MAXDOP 1 query to the workload. Looking at thread details for the parallel query:

SQL Server Threads

As you can see, one of the worker threads took a significantly longer amount of time to complete its work compared to the other threads. There is no logged wait statistic for this kind of performance problem in which the other parallel worker threads complete their work much earlier than when the query finishes. If there’s no worker thread then there is no wait associated with the query. The only way to catch this is to look at actual row distribution or the CPU time to elapsed time ratio.

You may be wondering why the query is worse than twice as slow as before. After all, if all workers do an equal amount of work but one now gets access to half as much CPU as before it seems reasonable to expect the runtime to double instead of triple. The workers of the parallel query have many reasons they might yield before exhausting their full 4 ms quantum – an I/O wait for example. The MAXDOP 1 SELECT query is designed to not yield early. What is very likely happening is that the MAXDOP 1 query gets a larger share of the scheduler’s resources than 50%. SQL Server 2016 made adjustments to try to limit this type of situation but by its very nature I don’t see how it could ever lead to a perfect sharing of a scheduler’s resources.

Demanding Demand Partitioning


We can get an exchange operator with demand based partitioning by replacing the driving temp table with a derived table. Full query text below:

INSERT INTO ## WITH (TABLOCK)
SELECT ca.*
FROM (
VALUES
(1, 50000),
(50001, 100000),
(100001, 150000),
(150001, 200000),
(200001, 250000),
(250001, 300000),
(300001, 350000),
(350001, 400000),
(400001, 450000),
(450001, 500000),
(500001, 550000),
(550001, 600000),
(600001, 650000),
(650001, 700000),
(700001, 750000),
(750001, 800000),
(800001, 850000),
(850001, 900000),
(900001, 950000),
(950001, 1000000),
(1000001, 1050000),
(1050001, 1100000),
(1100001, 1150000),
(1150001, 1200000),
(1200001, 1250000),
(1250001, 1300000),
(1300001, 1350000),
(1350001, 1400000),
(1400001, 1450000),
(1450001, 1500000),
(1500001, 1550000),
(1550001, 1600000),
(1600001, 1650000),
(1650001, 1700000),
(1700001, 1750000),
(1750001, 1800000),
(1800001, 1850000),
(1850001, 1900000),
(1900001, 1950000),
(1950001, 2000000),
(2000001, 2050000),
(2050001, 2100000),
(2100001, 2150000),
(2150001, 2200000),
(2200001, 2250000),
(2250001, 2300000),
(2300001, 2350000),
(2350001, 2400000),
(2400001, 2450000),
(2450001, 2500000),
(2500001, 2550000),
(2550001, 2600000),
(2600001, 2650000),
(2650001, 2700000),
(2700001, 2750000),
(2750001, 2800000),
(2800001, 2850000),
(2850001, 2900000),
(2900001, 2950000),
(2950001, 3000000),
(3000001, 3050000),
(3050001, 3100000),
(3100001, 3150000),
(3150001, 3200000),
(3200001, 3250000),
(3250001, 3300000),
(3300001, 3350000),
(3350001, 3400000),
(3400001, 3450000),
(3450001, 3500000),
(3500001, 3550000),
(3550001, 3600000),
(3600001, 3650000),
(3650001, 3700000),
(3700001, 3750000),
(3750001, 3800000),
(3800001, 3850000),
(3850001, 3900000),
(3900001, 3950000),
(3950001, 4000000),
(4000001, 4050000),
(4050001, 4100000),
(4100001, 4150000),
(4150001, 4200000),
(4200001, 4250000),
(4250001, 4300000),
(4300001, 4350000),
(4350001, 4400000),
(4400001, 4450000),
(4450001, 4500000),
(4500001, 4550000),
(4550001, 4600000),
(4600001, 4650000),
(4650001, 4700000),
(4700001, 4750000),
(4750001, 4800000)
) driver( s, e)
CROSS APPLY (
	SELECT TOP (987654321987654321) ID, CHECKSUM(STRING_AGG(STRING_TO_AGG , ',') WITHIN GROUP (ORDER BY ID2)) ALL_STRINGS_CHECKSUM
	FROM # WITH (FORCESEEK)
	WHERE ID BETWEEN CAST(driver.s AS BIGINT) AND CAST(driver.e AS BIGINT)
	GROUP BY ID
) ca
OPTION (MAXDOP 8, NO_PERFORMANCE_SPOOL, FORCE ORDER);

Query performance is effectively random. The query was observed to execute as quickly as 15 seconds and as slowly as 45 seconds. In some situations there was an incredible amount of skew in row distributions between threads:

SQL Server Threads

SQL Server Threads

SQL Server Threads

This is an unexpected situation if there are no other queries running on the server. Query performance is most disappointing.

Is there a trace flag?


Yes! The problem here is that the nested loop join uses the prefetch optimization. Paul White writes:

One of the available SQL Server optimizations is nested loops prefetching. The general idea is to issue asynchronous I/O for index pages that will be needed by the inner side — and not just for the current correlated join parameter value, but for future values too.

That sounds like it might be wildly incompatible with a demand exchange operator. Querying sys.dm_exec_query_profiles during query execution proves that the demand exchange isn’t working as expected: worker threads no longer fully process the results associated with their current row before requesting the next one. That is what can lead to wild skew between the worker threads and as a result query performance is effectively random.

Documented trace flag 8744 disables this optimization. Adding it to the query using QUERYTRACEON results in much more stable performance. The query typically finishes in about 15 seconds. Here is an example thread distribution:

SQL Server Threads

If you fight the ISV fight like I do, you may not be able to enable trace flags for individual queries. If you’re desperate you could try artificially lowering the cardinality estimate from the derived table. An OPTIMIZE FOR query hint with a direct filter is my preferred way to accomplish this. I like to set the cardinality estimate equal to MAXDOP but I have no real basis for doing this. Here is the full query text:

DECLARE @filter BIGINT = 987654321987654321;
INSERT INTO ## WITH (TABLOCK)
SELECT ca.*
FROM (
VALUES
(1, 50000),
(50001, 100000),
(100001, 150000),
(150001, 200000),
(200001, 250000),
(250001, 300000),
(300001, 350000),
(350001, 400000),
(400001, 450000),
(450001, 500000),
(500001, 550000),
(550001, 600000),
(600001, 650000),
(650001, 700000),
(700001, 750000),
(750001, 800000),
(800001, 850000),
(850001, 900000),
(900001, 950000),
(950001, 1000000),
(1000001, 1050000),
(1050001, 1100000),
(1100001, 1150000),
(1150001, 1200000),
(1200001, 1250000),
(1250001, 1300000),
(1300001, 1350000),
(1350001, 1400000),
(1400001, 1450000),
(1450001, 1500000),
(1500001, 1550000),
(1550001, 1600000),
(1600001, 1650000),
(1650001, 1700000),
(1700001, 1750000),
(1750001, 1800000),
(1800001, 1850000),
(1850001, 1900000),
(1900001, 1950000),
(1950001, 2000000),
(2000001, 2050000),
(2050001, 2100000),
(2100001, 2150000),
(2150001, 2200000),
(2200001, 2250000),
(2250001, 2300000),
(2300001, 2350000),
(2350001, 2400000),
(2400001, 2450000),
(2450001, 2500000),
(2500001, 2550000),
(2550001, 2600000),
(2600001, 2650000),
(2650001, 2700000),
(2700001, 2750000),
(2750001, 2800000),
(2800001, 2850000),
(2850001, 2900000),
(2900001, 2950000),
(2950001, 3000000),
(3000001, 3050000),
(3050001, 3100000),
(3100001, 3150000),
(3150001, 3200000),
(3200001, 3250000),
(3250001, 3300000),
(3300001, 3350000),
(3350001, 3400000),
(3400001, 3450000),
(3450001, 3500000),
(3500001, 3550000),
(3550001, 3600000),
(3600001, 3650000),
(3650001, 3700000),
(3700001, 3750000),
(3750001, 3800000),
(3800001, 3850000),
(3850001, 3900000),
(3900001, 3950000),
(3950001, 4000000),
(4000001, 4050000),
(4050001, 4100000),
(4100001, 4150000),
(4150001, 4200000),
(4200001, 4250000),
(4250001, 4300000),
(4300001, 4350000),
(4350001, 4400000),
(4400001, 4450000),
(4450001, 4500000),
(4500001, 4550000),
(4550001, 4600000),
(4600001, 4650000),
(4650001, 4700000),
(4700001, 4750000),
(4750001, 4800000)
) driver( s, e)
CROSS APPLY (
	SELECT TOP (987654321987654321) ID, CHECKSUM(STRING_AGG(STRING_TO_AGG , ',') WITHIN GROUP (ORDER BY ID2)) ALL_STRINGS_CHECKSUM
	FROM # WITH (FORCESEEK)
	WHERE ID BETWEEN CAST(driver.s AS BIGINT) AND CAST(driver.e AS BIGINT)
	GROUP BY ID
) ca
WHERE driver.s <= @filter
OPTION (OPTIMIZE FOR (@filter = 350001), MAXDOP 8, NO_PERFORMANCE_SPOOL, FORCE ORDER);

Query performance is the same as with TF 8744:

SQL Server Query Plan


Does this query do better than round robin partitioning when there is a busy MAXDOP 1 query running at the same time? I ran it a few times and it completed in about 15-16 seconds every time. One of the worker threads does less work and the others cover for it:

SQL Server Threads

In this example the nested loop join only gets the prefetch optimization if the cardinality estimate is more than 25 rows. I do not know if that number is a fixed part of the algorithm for prefetch eligibility but it certainly feels unwise to rely on this behavior never changing in a future version of SQL Server. Note that prefetching is a trade-off. For some workloads you may be better off with round robin partitioning and prefetching compared to demand without prefetching. It’s hard to imagine a workload that would benefit from demand with prefetching but perhaps I’m not being creative enough in my thinking.

Final Thoughts


In summary, the example parallel apply query that uses demand partitioning performs 2-3 times better the query that uses round robin partitioning when another serial query is running on the server. The nested loop prefetch optimization does not work well witth exchange operator demand partitioning and should be avoided via a trace flag or other tricks if demand partitioning is in use.

There are a few things that Microsoft could do to improve the situation. A USE HINT that disables nested loop prefetching would be most welcome. I think that there’s also a fairly strong argument to make that a query pattern of a nested loop join with prefetching with a first child of a demand exchange operator is a bad pattern that the query optimizer should avoid if possible. Finally, it would be nice if there was a type of wait statistic triggered when some of a parallel query’s workers finish their work earlier than others. The problematic queries here have very little CXPACKET waits and no EXECSYNC waits. Imagine that I put a link to UserVoice requests here and imagine yourself voting for them.

Thanks for reading!

Going Further


If this is the kind of SQL Server stuff you love learning about, you’ll love my training. I’m offering a 75% discount to my blog readers if you click from here. I’m also available for consulting if you just don’t have time for that and need to solve performance problems quickly.

Stuff I Learned In Joe Obbish’s Precon On Column Store

Joy Of Joys


Speaking daily with Joe is one of the best choices I’ve ever made. Not only do I regularly learn things about SQL Server that I would probably not run into, but he’s quite a character. That’s why when I started to help organize SQL Saturday NYC, I was more than happy to offer him a precon.

While it may be impractical to have more Joes in the world, it’s very practical to have people learn from him.

So what did I learn from his precon?

Column store is Different


How you load data into tables matters a lot. Not only is the number of rows you insert at a time crucial, but all sorts of things from the column data types to the inserted values can work for or against you. This can affect compression, query performance, and how well data loading scales.

The other place where column store differs from row store indexes is that maintenance is important. Yes, the very maintenance that’s an absurd crutch to row store indexes can be make or break to column store performance. Right now, the only two solutions that have special rules for column store indexes are Niko Neugebauer’s CISL scripts, and the Tiger Team’s Adaptive Defrag. Other maintenance solutions aren’t taking the right things into account.

Modifications Are Harsh! Deleting and Updating rows in column store indexes can have some nasty side effects — the kind that make maintenance necessary.

Performance Tuning Is Wild


If you’re dealing with column store indexes, chances are you’re dealing with some really big tables. While that by itself doesn’t change how you tune queries, you do have to remind yourself that “missing indexes” aren’t going to be the answer. You also need to keep in mind that some operators and query constructs don’t allow for good segment/row group elimination. You can think of those like partition elimination in a partitioned table. You can skip large amounts of data irrelevant to your query.

Strings Are The Devil


That’s all. Avoid them.

Details Are In The Devil


I’m not giving away too much here, because I hope Joe will deliver this again. If you see it pop up in your area, buy tickets ASAP.

Thanks for reading!

Going Further


If this is the kind of SQL Server stuff you love learning about, you’ll love my training. I’m offering a 75% discount to my blog readers if you click from here. I’m also available for consulting if you just don’t have time for that and need to solve performance problems quickly.

Trace flag 3656 is not sufficient for symbol resolution on SQL Server 2019

You may have noticed that TF 3656 appears to no longer work in SQL Server 2019 RC1. Symbols are not resolved in Extended Events event data even with that trace flag enabled. Trace flag 2592 must also be enabled to resolve symbols. This was recently added by Microsoft to the documentation. This concludes the shortest blog post I will ever write.