Blog

Query Store Improvements I’d Like To See For SQL Server: Memory Grant Columns

Spirited Away


This week’s posts are a series of short, and, admittedly lazy ones about improvements I’d like to see in Query Store.

I’m away from home for the Holiday Week, and I don’t have a lot of time to write at the moment. Normally I’d put these all into one post. I do hope you, dear reader, will forgive me. In the spirit of the holidays, or something.

Problem Two


When you run a query, you might get a memory grant, for example to hash or sort data. In the query plan, there are a whole bunch of columns that give you information about the memory grant:

  • SerialRequiredMemory         
  • SerialDesiredMemory          
  • RequiredMemory               
  • DesiredMemory                
  • RequestedMemory              
  • GrantWaitTime                
  • GrantedMemory                
  • MaxUsedMemory                
  • MaxQueryMemory               
  • LastRequestedMemory          
  • IsMemoryGrantFeedbackAdjusted

And if you read the query plan documentation, you’ll get some explanation of them, too.

Provide memory grant estimate as well as actual runtime memory grant information. Serial required/desired memory attributes are estimated during query compile time for serial execution. The rest of attributes provide estimates and counters for query execution time considering actual degree of parallelism. SerialRequiredMemory: Required memory in KB if the query runs in serial mode. The query will not start without this memory. SerialDesiredMemory: Memory estimated to fit intermediate results in KB if the query runs in serial mode. RequiredMemory: Required memory in KB for the chosen degree of parallelism. If the query runs in serial mode, this is the same as SerialRequiredMemory. DesiredMemory: Memory estimated to fit intermediate results in KB for the chosen degree of parallelism. If the query runs in serial mode, this is the same as SerialDesiredMemory. RequestedMemory: Memory in KB which the query requests the memory manager to grant. This can be smaller than sum of RequiredMemory and DesiredMemory if it exceeds the maximum allowed for single query. GrantWaitTime: Time in seconds if the query has to wait for successful memory grant. MaxUsedMemory: Maximum memory in KB used by the query. MaxQueryMemory: Maximum memory in KB allowed for single query. LastRequestedMemory: Memory in KB which was requested by the query from the memory manager during the last execution. IsMemoryGrantFeedbackAdjusted: Information regarding if the memory grant in this plan is adjusted based on memory grant feedback.

In Query Store, you get limited memory grant information in query_store_runtime_stats. But if you look in dm_exec_query_stats, there’s a whole lot more.

SQL Server Query Store
grim

It’s a much more complete view of the memory grant, and it’s a damn shame that you have to rely on the plan cache for this, because it’s so unreliable. Clearing out, dropping plans, recompiles, etc. etc. etc.

It would be marvelous if Query Store retained information like the size of the grant, so you can figure out if the amount of memory that it used was anywhere near reality. The ideal columns are not very useful to me, but the total and used are wonderful to compare.

Thanks for reading!

Going Further


If this is the kind of SQL Server stuff you love learning about, you’ll love my training. I’m offering a 75% discount to my blog readers if you click from here. I’m also available for consulting if you just don’t have time for that and need to solve performance problems quickly.

Query Store Improvements I’d Like To See For SQL Server: Recent Actual Plans

Spirited Away


This week’s posts are a series of short, and, admittedly lazy ones about improvements I’d like to see in Query Store.

I’m away from home for the Holiday Week, and I don’t have a lot of time to write at the moment. Normally I’d put these all into one post. I do hope you, dear reader, will forgive me. In the spirit of the holidays, or something.

Problem One


Query Store plans are equivalent to cached plans, which are equivalent to estimated plans. You get what SQL Server thought was gonna happen.

Sometimes, that can have very little in common with reality.

Other times, it can be misleading because of parameter sniffing.

Right now, SQL Server has a plan cache view in SQL Server 2019+ that holds the last actual plan. It would be really cool if Query Store tracked a configurable number of recent actual plans.

That’d really help folks out where the performance problem isn’t easy to deduce or reproduce from what they’ve got available.

Actual plans are incredibly valuable these days, with operator times included, and a whole bunch of other stuff that isn’t surfaced in estimated plans, like spills.

In real life, I see all sorts of weird things popping up as the bottleneck in query plans:

  • TOP above a SCAN
  • Repartition Streams
  • Compute Scalar

You only see the pain when operator times are involved, and Query Store needs to start collecting those to make query tuning easier.

Thanks for reading!

Going Further


If this is the kind of SQL Server stuff you love learning about, you’ll love my training. I’m offering a 75% discount to my blog readers if you click from here. I’m also available for consulting if you just don’t have time for that and need to solve performance problems quickly.

Why does FAST_FORWARD make some cursors so much faster in SQL Server?

If you’re like me, you started your database journey by defining cursors with the default options. This went on until a senior developer or DBA kindly pointed out that you can get better performance by using the FAST_FORWARD option. Or maybe you were a real go-getter and found Aaron Bertrand’s performance benchmarking blog post on different cursor options. I admit that for many years I didn’t care to know why FAST_FORWARD sometimes made my queries faster. It had “FAST” in the name and that was good enough for me.

Recently I saw a production issue where using the right cursor options led to a 1000X performance improvement. I decided that ten years of ignorance was enough and finally did some research on different cursor options. This post contains a reproduction and discussion of the production issue.

A Dramatic Example

The code below creates a 16 GB table. It has a primary key and clustered index on the ID column and a nonclustered index on the ID2 column. You can adjust the TOP value to insert fewer rows if you wish to create a smaller table, but don’t drop it below 200000.

DROP TABLE IF EXISTS tbl_1;

CREATE TABLE tbl_1 (
ID BIGINT NOT NULL,
ID2 BIGINT NOT NULL,
PAGE_FILLER VARCHAR(5000) NOT NULL,
PRIMARY KEY (ID)
);

INSERT INTO tbl_1 WITH (TABLOCK)
SELECT RN, RN % 100000, REPLICATE('Z', 5000)
FROM
(
	SELECT TOP (2000000) ROW_NUMBER() OVER (ORDER BY (SELECT NULL)) RN
	FROM master..spt_values t1
	CROSS JOIN master..spt_values t2
) q
OPTION (MAXDOP 1);

CREATE INDEX IX2 ON tbl_1 (ID2);

Consider the following select query, which is a simplified example of the production query:

Select ID
from tbl_1
WHERE ID2 < 1
ORDER BY ID;

There’s an index on ID2 and the filter is highly selective: only 20 rows out of 2 million will match. I would expect the query optimizer to use that index and for the query to finish instantly. The following stored procedure defines a FAST_FORWARD cursor for that SELECT query, fetches the 20 matching rows, and does nothing with them:

CREATE OR ALTER PROCEDURE CURSOR_WITH_FF
AS
BEGIN
SET NOCOUNT ON;

Declare @ID BIGINT;

Declare FF Cursor FAST_FORWARD for
Select ID
from tbl_1
WHERE ID2 < 1
ORDER BY ID;

Open FF;
Fetch Next from FF into @ID;
WHILE @@FETCH_STATUS = 0
BEGIN
	Fetch Next from FF into @ID;
END;
Close FF;
Deallocate FF;
END;

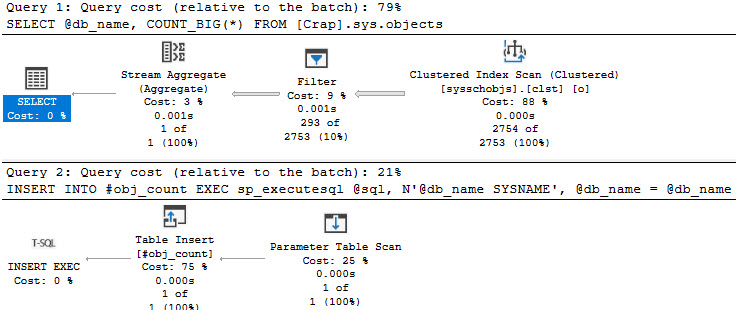
Executing the stored procedure takes about 2 ms on my machine. In this case, I get a query plan that’s very similar to what I’d get by running a simple SELECT query. There’s some additional cursor garbage, but that doesn’t impact performance in this case:

SQL Server Query Plan

Regrettably, the code takes 50 seconds to execute on my machine if I remove the FAST_FORWARD option. What is responsible for the dramatic difference in runtime?

The “What”

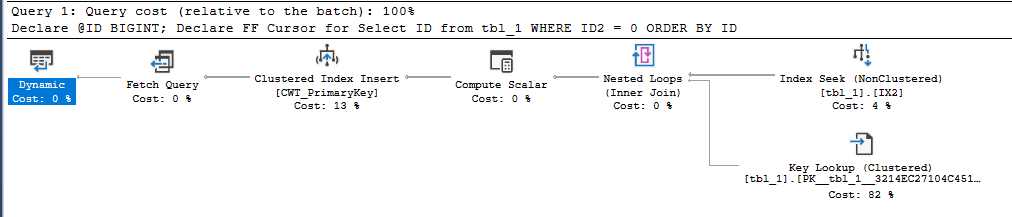
We can start by looking at the query plan for the default cursor:

SQL Server Query Plan

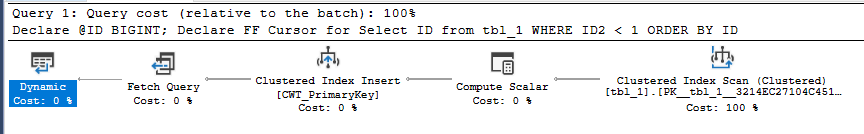
The query optimizer decided to do an ordered clustered index scan instead of using the IX2 index. We’re getting all rows from the cursor so we have to read through the whole table. That’s 20 scans with each scan covering about 5% of the table. We should definitely expect this to be less efficient than the FAST_FORWARD plan, but a 50 second execution time felt too slow based on what I know about my hardware. Looking at the wait stats:

SQL Server Query Plan

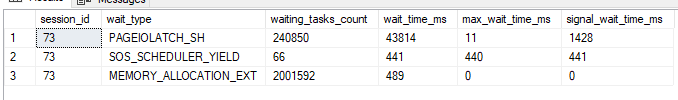
It’s certainly not surprising that I/O is the biggest contributor to wait time (what else would it be?), but why do I have so much I/O wait time when I have fast, locally attached storage with an average latency less than 1 ms? For a comparison test, I decided to force the query plan that the cursor picks but to run it outside of the cursor. The following code finished in about 8 seconds on my machine:

CHECKPOINT;
DBCC DROPCLEANBUFFERS;

Select ID
from tbl_1 WITH (INDEX(1))
WHERE ID2 < 1
ORDER BY ID
OPTION (MAXDOP 1);

Using sys.dm_io_virtual_file_stats, I found that the cursor was doing about 240000 I/Os with an average I/O size of 66 KB. The single SELECT query did about 10000 I/Os with an average I/O size of 1.7 MB. The key difference is that only the first query execution of the cursor is able to get read-ahead reads:

SQL Server Query Plan

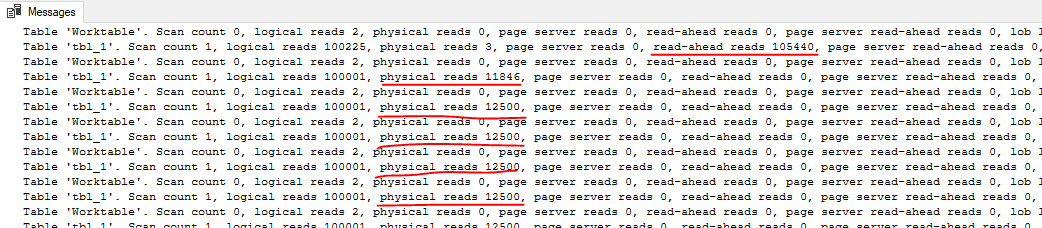
For the cursor execution, we don’t get read ahead reads for 95% of the I/O needed for the query. Even a sub-ms I/O latency can be painful when you have to do 240000 I/Os with a DOP 1 query. In summary, the FAST_FORWARD cursor is able to use an index to efficiently seek to the 20 matching rows. The cursor with default options does about 15 GB of I/O that’s not eligible for read-ahead reads.

Of course, the situation should be expected to be much worse in the cloud. Using the quoted latency of 5-10 ms for general purpose Managed Instances, one might expect the cursor with default options to take between 20 and 40 minutes. Just for fun, I decided to test it against a 4 vCore Managed Instance. The cursor with the FAST_FORWARD option took about 120 ms. The cursor with default options took about 70 minutes. Here are the wait stats for the execution:

SQL Server Query Plan

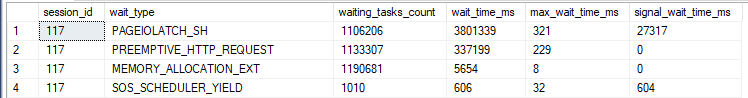
To put a positive spin on it: using the correct cursor options improved performance by 35000X on the Managed Instance.

The “Why”

I’ll start by saying that I don’t want to be a cursor expert. I’d much rather be an expert in not using cursors. I was having a lot of trouble explaining why the default cursor was getting such a bad query plan, but fortunately I was scooped 12 years ago. I’m going to reproduce the entire section on dynamic plans because you never know when a Microsoft hosted blog post will disappear:

A dynamic plan can be processed incrementally. In SQL Server we do this by serializing the state of the query execution into what we call a marker. Later, we can build a new query execution tree, use the marker to reposition each operator. Moreover, a dynamic plan can move forwards and backwards relative to its current position. Dynamic plans are used by both dynamic and some fast_forward cursors.

A dynamic plan consists only of dynamic operators — operators that support markers and moving forwards and backwards. This corresponds closely, but not exactly, to the query processing notion of streaming operators (vs. stop-and-go). But not every streaming operator is dynamic. In SQL Server, dynamic means:

1. The operator can be repositioned to its current position using a marker, or to a relative position (either next or previous) from its current one.

2. The operator’s state has to be small, so the marker can be small. No row data can be stored in the operator. In particular, no sort table, hash table, or work table. Not even one row can be stored, since a single row can be very large.

Without a dynamic plan, the cursor would need temporary storage to keep the query result set (or keyset thereof). A dynamic plan does no such thing! However, certain operators are disqualified — hash join, hash agg, compute sequence, and sort, for example. This leads to sub-optimal plans.

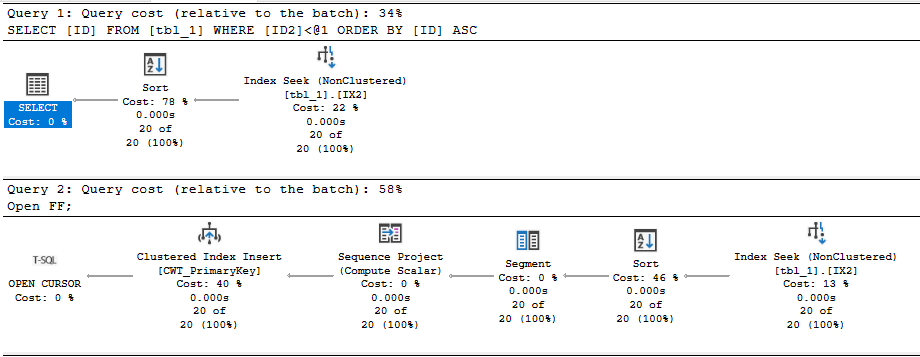
In short, you can consider a dynamic plan to be similar in concept to a plan with no blocking operators, but there are some additional restrictions. Reliable sources tell me that a cursor with default options will always pick a dynamic plan if one is available. For our SELECT query, a dynamic plan is indeed available. The ordering of the clustered index can be used to return sorted rows without doing an explicit sort. The IX2 index cannot be used for ordering because I’m filtering on ID2 with an inequality. Changing the query to do an equality filter instead allows for a dynamic plan that uses the IX2 index:

SQL Server Query Plan

What about cursors without default options? Going back to the original query, specifying the STATIC or KEYSET option avoids the bad query plan and uses the IX2 index to do an index seek. Both of those options write the cursor result set to a table in tempdb, so it makes intuitive sense that there wouldn’t be some kind of restriction that forces a clustered index scan.

Specifying the FAST_FORWARD option allows the query optimizer to pick between a static and dynamic plan. In this case, the static plan is obviously much more efficient, and the query optimizer is aware of that. It picks the static plan that doesn’t do the clustered index scan.

For completeness, specifying the READ_ONLY option also results in the index seek, as long as the DYNAMIC option isn’t also specified.

In general, I would say that FAST_FORWARD is still a good starting point for your cursors as long as your application code allows for the restrictions that come with it. FAST_FORWARD alone isn’t always sufficient to get query performance that is similar to what you’d get with a standard SELECT. As Erik points out, you’ll end up with a MAXDOP 1 query with that option. The query optimizer may also choose a worse dynamic plan instead of a static plan if the estimated query plan costs don’t reflect reality. Using STATIC instead of FAST_FORWARD can be quite helpful in some cases, but you’ll have to test your cursor specifically to know for sure. Of course, you may be able to write your code without using a cursor instead.

Insufficient Permissions

As someone always on the lookout for cool demos, this bit of the documentation caught my eye:

If a DECLARE CURSOR using Transact-SQL syntax does not specify READ_ONLY, OPTIMISTIC, or SCROLL_LOCKS, the default is as follows:

If the SELECT statement does not support updates (insufficient permissions, accessing remote tables that do not support updates, and so on), the cursor is READ_ONLY.

Could I get better performance by running the code as a login with less privileges? Sadly, I couldn’t get this to work. I verified that the lowly ‘erik’ login couldn’t modify data in the table but I got the same query plan as before. There was also no change in the properties column from the sys.dm_exec_cursors DMF.

I don’t know if the documentation was wrong or if I was doing something wrong on my end. I’d be interested in seeing a working repro of this if anyone has one.

Final Thoughts

Some query patterns can experience extremely poor performance with the default cursor options. You may be able to identify these queries by sorting by total logical reads in the standard SSMS query store reports. In our production environment we had a few cursors that were doing far more logical reads than anything else on the database, so they were easy to pick out. We were able to significantly speed up some of those queries just by adding the FAST_FORWARD option.

Thanks for reading!

Going Further


If this is the kind of SQL Server stuff you love learning about, you’ll love my training. I’m offering a 75% discount to my blog readers if you click from here. I’m also available for consulting if you just don’t have time for that and need to solve performance problems quickly.

Things SQL Server vNext Should Address: Add Lock Pages In Memory To Setup Options

Consideration


This setting doesn’t get enough credit for all the good it does. Part of me thinks it should be the default for new SQL Server installs, if the amount of memory in the server is over a certain number, and max server memory is set to match.

You may not want it turned on only based on physical memory, because there are lunatics out there who stack SQL Server installs, and who install all sorts of other dimwitted things on there, too.

But since max server memory is a suggestion during setup, and perform volume maintenance tasks is included, this should be as well.

Again, it’s one less post-install step for automation-minded folks out there.

Burden


SQL Servers with large amounts of memory can especially benefit from this setting, because it allows them to access memory via a different API. The easy way to think of it is that SQL Server will get direct access to physical memory, instead of virtual memory.

Allocates physical memory pages to be mapped and unmapped within any Address Windowing Extensions (AWE) region of a specified process.

The AllocateUserPhysicalPages function is used to allocate physical memory that can later be mapped within the virtual address space of the process. The SeLockMemoryPrivilege privilege must be enabled in the caller’s token or the function will fail with ERROR_PRIVILEGE_NOT_HELD.

I generally advise people with good chunks of memory to enable this setting. There are very few good reasons not to on big boxes, and that’s why it should be called out in the installation process. Enabling it later means rebooting, and that sucks.

Thanks for reading!

Going Further


If this is the kind of SQL Server stuff you love learning about, you’ll love my training. I’m offering a 75% discount to my blog readers if you click from here. I’m also available for consulting if you just don’t have time for that and need to solve performance problems quickly.

Happy Thanksgiving From Darling Data

Why Are You Here?


In the fine tradition of a turkey being pardoned from becoming the centerpiece of a meal, I’m pardoning you from having to read a blog post about SQL Server.

Wherever you are, whoever you are, have a grand day!

Thanks for reading!

Things SQL Server vNext Should Address: Add Cost Threshold For Parallelism To Setup Options

Cracky


Unless you’re running a data warehouse, I can’t think of a good reason to leave this at the default (5) for most any workload.

Look at any SQL Server setup checklist not written by SharePoint admins, and you’ll see people tell you to change this setting to something higher than 5.

What you change it to is not what I’m here to talk about. I’m Team Start With 50, but you can be whatever team you want and we can still be friends.

I mean, unless you’re going to tell me I should look at the plan cache to figure that out, then we are mortal enemies because you are full of shabby ideas. The plan cache is full of lies and bad estimates, and totally unreliable in the long term.

You could probably make better guesses based on Query Store, but Cost Threshold For Parallelism is, unfortunately, not a database-level setting, and they’d still just be guesses. About estimates. So, you know… Cool your jets, hotshot.

But since MAXDOP is not only available, but also offers guidance for a correct setting to the installer, why not this one? It is, after all, an important counterpart.

If anything, it’d be nice to give folks who care about automation one less post-setup step to handle. To me, that’s a glaring omission.

Costy Things


Of course, maybe it’s time to get Cost Threshold For Parallelism some help. Cost is, after all, just a reference metric.

It can be good, it can be bad. High cost plans can run fast, low cost plans can run slow.

With all the intelligent stuff being built into the product, perhaps it’s time for it to consider things in addition to plan cost for whether a query is eligible for parallelism or not.

Imagine this scenario: You set Cost Threshold For Parallelism to 50, and a really important query that costs 20 query bucks comes along and runs slowly and single threaded every single time it executes. It never stands a chance at going parallel, unless you drop Cost Threshold For Parallelism way low for the whole server.

Your only option other than lowering Cost Threshold For Parallelism is using an unsupported trace flag (8649), or an unsupported USE hint (ENABLE_PARALLEL_PLAN_PREFERENCE).

It sure would be nice if there were a supported override that you could set, say a maximum CPU threshold for a serial plan. I don’t think you could change this in flight, but you could potentially have it act like memory grant feedback, and adjust between executions.

Thanks for reading!

Going Further


If this is the kind of SQL Server stuff you love learning about, you’ll love my training. I’m offering a 75% discount to my blog readers if you click from here. I’m also available for consulting if you just don’t have time for that and need to solve performance problems quickly.

Creating SQL Server Indexes: Stored Options vs. Creation Options

No Lies


When you create an index, there are a lot of options. Recently while working with nice people who pay me, I’ve gotten the same question a few times.

I like to hand off index change scripts to people to help them drop unused indexes, merge duplicative indexes, and add in helpful missing indexes. When I do, I always specify some options along with them to help the create process along, like MAXDOP, ONLINE, and SORT_IN_TEMPDB.

The thing is, those settings aren’t ones that kick in automatically next time you rebuild the index or something; you have to specify them each time.

Here are index creation options:

  • SORT_IN_TEMPDB
  • DROP_EXISTING
  • ONLINE
  • RESUMABLE
  • MAX_DURATION
  • MAXDOP

Here are stored index options:

  • PAD_INDEX
  • FILLFACTOR
  • IGNORE_DUP_KEY
  • STATISTICS_NORECOMPUTE
  • STATISTICS_INCREMENTAL
  • ALLOW_ROW_LOCKS
  • ALLOW_PAGE_LOCKS
  • OPTIMIZE_FOR_SEQUENTIAL_KEY
  • DATA_COMPRESSION

Roll Out


Where you use these options is situational.

For example, only Enterprise Edition can create indexes online, or using a parallel plan. You can sort in tempdb for any of them, though. I might use different DOPs depending on the size of the server, and of course if I’m creating a column store index (for those, DOP 1 is sometimes a good idea).

For the stored options, I leave most of them alone. I always start Fill Factor off at 100, and with page compression turned on. Those are both things you can adjust or remove later if they turn out to not be ideal, but I love testing them out.

Data compression is especially useful on Standard Edition servers with a limited buffer pool (128GB) and large data sets, but can be just as useful on Enterprise Edition when that antichrist VM admin refuses to part with a single more GB of memory.

And hey, maybe in the future as more workloads move to 2019+, I’ll get to spend more time optimizing for sequential keys.

Maybe.

Thanks for reading!

Going Further


If this is the kind of SQL Server stuff you love learning about, you’ll love my training. I’m offering a 75% discount to my blog readers if you click from here. I’m also available for consulting if you just don’t have time for that and need to solve performance problems quickly.

How #Temporary Tables Can Cause Plan Cache Pollution In SQL Server

I Love #Temp Tables


I solve a lot of problems with #temp tables, indeed I do. And I hate people who are reflexively anti-#temp table.

If you’re into jokes (I’m definitely not into jokes; SQL is serious business), you could even call them #foolish.

Get it?

Ahem 🎤👈

However (!) I learned a lesson recently about how using them in certain ways can cause weird plan cache pollution. When you’re hitting the issue, the optional_spid column in dm_exec_plan_attributes  will be populated with a non-zero value. You can use this query to quickly check for that happening on your system:

SELECT 
    pa.attribute, 
    pa.value, 
    decp.refcounts,
    decp.usecounts,
    decp.size_in_bytes,
    decp.memory_object_address,
    decp.cacheobjtype,
    decp.objtype,
    decp.plan_handle
FROM sys.dm_exec_cached_plans AS decp
CROSS APPLY sys.dm_exec_plan_attributes (decp.plan_handle)  AS pa
WHERE pa.attribute = N'optional_spid'
AND   pa.value > 0;

Let’s talk about those!

Creating Across Stored Procedure Executions


Check out this piece of code:

CREATE OR ALTER PROCEDURE
    dbo.no_spid
AS
BEGIN
    SET NOCOUNT ON;

    CREATE TABLE #t (id int);
    INSERT #t (id) VALUES (1);

    EXEC dbo.a_spid; --Hi

END;
GO 


CREATE OR ALTER PROCEDURE
    dbo.a_spid
AS
BEGIN
    SET NOCOUNT ON;

    CREATE TABLE #t (id int);
    INSERT #t (id) VALUES (2);

END;
GO

In the first procedure, we create a #temp table, and insert a row, then execute another procedure, where we create a #temp table with the same name and definition and insert a row.

Using the above query, we’ll see this:

polluted

And if we run sp_BlitzCache, we’ll indeed see multiple plans for a_spid, though no_spid seems to get plans associated with it because the plans are hashed to the same value. Heh. That plan cache… 🙄

diamonds are forever

Referencing Across Stored Procedure Executions


Check out this code:

CREATE OR ALTER PROCEDURE
    dbo.internal
(
    @c bigint
)
AS
BEGIN
SET NOCOUNT ON;

    CREATE TABLE #t(id int);
    INSERT #t (id) VALUES (1);

    SELECT 
        @c = COUNT_BIG(*)
    FROM #t AS t
    WHERE 1 = (SELECT 1);

    EXEC dbo.not_internal 0; --Hi

END;
GO 

CREATE OR ALTER PROCEDURE
    dbo.not_internal
(
    @c bigint
)
AS
BEGIN

    INSERT #t (id) VALUES (2);

    SELECT 
        @c = COUNT_BIG(*)
    FROM #t AS t
    WHERE 1 = (SELECT 1);

END;
GO

We’re creating a #temp table in one stored procedure, and then executing another stored procedure that references the same #temp table this time.

Just like above, if we execute the procedures across a couple different SSMS tabs, we’ll see this:

scope

And from the plan cache:

heearghh

Same thing as last time. Multiple plans for not_internal. In both cases, the outer stored procedure has an optional_spid of 0, but the inner procedure has the spid that executed it attached.

Dynamic SQL


My fellow blogger Joe Obbish came up with this one, which is really interesting. It’s necessary to point out that this is Joe’s code, so no one asks me why the formatting is so ugly 😃

CREATE OR ALTER PROCEDURE no_optional_spid AS
BEGIN
    CREATE TABLE #obj_count (
    [DB_NAME] SYSNAME NOT NULL,
    OBJECT_COUNT BIGINT NOT NULL
    );

    DECLARE @db_name SYSNAME = 'Crap';

    DECLARE @sql NVARCHAR(4000) = N'SELECT @db_name, COUNT_BIG(*)
    FROM ' + QUOTENAME(@db_name) + '.sys.objects';

    INSERT INTO #obj_count
    EXEC sp_executesql @sql, N'@db_name SYSNAME', @db_name = @db_name;
END;
GO 

CREATE OR ALTER PROCEDURE has_optional_spid AS
BEGIN
    CREATE TABLE #obj_count (
    [DB_NAME] SYSNAME NOT NULL,
    OBJECT_COUNT BIGINT NOT NULL
    );

    DECLARE @db_name SYSNAME = 'Crap';

    DECLARE @sql NVARCHAR(4000) = N'INSERT INTO #obj_count
    SELECT @db_name, COUNT_BIG(*)
    FROM ' + QUOTENAME(@db_name) + '.sys.objects';

    EXEC sp_executesql @sql, N'@db_name SYSNAME', @db_name = @db_name;

END;
GO 

In this case, we have two procedures that create a #temp table with the same definition, and insert into them with dynamic SQL. I have a feeling that this would also occur under other circumstances where you use the INSERT…EXEC paradigm, e.g. a stored procedure.

Same deal here, if we look at the same things, except that it’s more helpful to look at the execution_count column in sp_BlitzCache.

BOBBY

And…

SUZIE

Everything has 200 executions, except the internal parameter table scan that does the #temp table insert:

fodder

5k Finisher


This post explores a few scenarios where the *optional_spid* cache pollution does happen. There are likely more, and I’m happy to add scenarios if any readers out there have them.

There are plenty of scenarios where this scenario doesn’t happen, too. I don’t want you to think it’s universal. Using #temp tables with the same name but different definitions, or without the cross-referencing, etc. won’t cause this issue to happen.

I tried a bunch of stuff that I thought would cause the problem, but didn’t.

So yeah. Love your #temp tables, too.

Thanks for reading!

Going Further


If this is the kind of SQL Server stuff you love learning about, you’ll love my training. I’m offering a 75% discount to my blog readers if you click from here. I’m also available for consulting if you just don’t have time for that and need to solve performance problems quickly.

EAV Can Be Great In SQL Server, But It Depends On How You Query It

Valued


EAV styled tables can be excellent for certain data design patterns, particularly ones with a variable number of entries.

Some examples of when I recommend it are when users are allowed to specify multiple things, like:

  • Phone numbers
  • Physical or email addresses
  • Contact names

This is a lot better than adding N number of columns to a table, especially when either most people won’t use them, or it adds artificial restrictions.

For example, if you have a large table that was designed 10 years ago, you’re not gonna rush to add a 3rd phone number field to it for a single customer. Changing tables like that can be painful, depending on version and edition of SQL Server.

Careful


Where you need to be careful is how you design them. One particularly rough spot to end up in is with a table like this:

CREATE TABLE 
    dbo.eav
(
    entity int,
    attribute int,
    int_value int,
    date_value date,
    short_string_value nvarchar(100),
    long_string_value nvarchar(max)
);

While it does make data type consistency easier, I have to wonder about the wisdom of making the values “good” for searching. Certainly, indexing this table would be aggravating if you were going to go that route.

A design that I generally like better looks like this:

CREATE TABLE 
    dbo.eav
(
    entity int,
    attribute int,
    value sql_variant
);

While the sql_variant type is certainly not good for much, this is a proper time for it, particularly because this data should only be written to once, and only read from after. That means no searching the sql_variant column, and only allowing lookups via the entity and attribute.

Thanks for reading!

Going Further


If this is the kind of SQL Server stuff you love learning about, you’ll love my training. I’m offering a 75% discount to my blog readers if you click from here. I’m also available for consulting if you just don’t have time for that and need to solve performance problems quickly.

Signs You Need More Memory In Your SQL Server

Guessotron


Most of these signs have to do with wait stats. One could venture out and say that if you have way less memory than data, you need more memory, but… If the server is sitting around bored, who cares?

If we’re going to spend money on memory, let’s make sure it’ll get used. When I’m talking to people with performance problems that memory would solve, here are some of the top reasons.

You’re In The Cloud Where Storage Sucks

Okay, okay, storage can totally suck other places, too. I’ve seen some JBOD setups that would make you cry, and some of them weren’t in the cloud. Where you need to differentiate a little bit here is that memory isn’t going to help slow writes directly. If you add a bunch more memory and free up some network bandwidth for writes by focusing the reads more from the buffer pool, it might.

Look, just avoid disk as much as possible and you’ll be happy.

You’re Using Column Store And/Or Batch Mode

Good column store compression can often rely on adequate memory, but you also need to account for the much larger memory grants that batch mode queries ask for. As more and more workloads move towards SQL Server 2019 and beyond, query memory needs are going to go up because Batch Mode On Row Store will become more common.

You’re Waiting On RESOURCE_SEMAPHORE A Lot

This wait shows up when a bunch of queries are contending for memory grants, but SQL Server has given out all it can. If you run into these a lot, it’s a pretty good sign you need more memory. Especially if you’ve already tuned queries and indexes a bunch, or you’re dealing with a vendor app where they refuse to fix anything.

Other things that might help? The MAX_GRANT_PERCENT hint or Resource Governor

You’re Waiting On RESOURCE_SEMAPHORE_QUERY_COMPILE A Lot

This is another “queue” wait, but it’s for query compilation rather than query execution. Having more memory can certainly help this quite a bit, but so can simplifying queries so that the amount of memory SQL Server has to throw at compiling them chills out a little. You can start by reconsidering those views nested 10 levels deep and the schema design that leads you to needing a 23 table join to construct one row.

You’re Waiting On PAGEIOLATCH_SH Or PAGEIOLATCH_EX A Lot

These waits show up when data pages your query needs aren’t already there. The more you see these, the more latency you’re adding to your workload by constantly shuffling out to disk to get them. Of course, there’s other stuff you can do, like clean up unused and overlapping indexes, compress your indexes, etc. But not everyone is comfortable with or able to do that.

Thanks for reading!

Going Further


If this is the kind of SQL Server stuff you love learning about, you’ll love my training. I’m offering a 75% discount to my blog readers if you click from here. I’m also available for consulting if you just don’t have time for that and need to solve performance problems quickly.