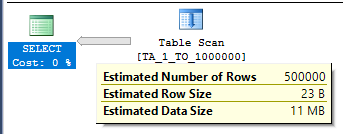
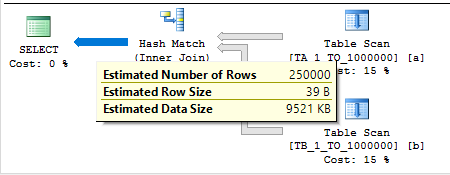
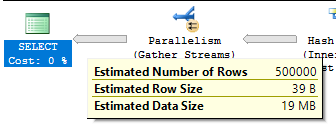
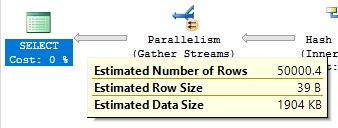
Columnstore Bitmap Filters

Microsoft has introduced a few improvements to bitmap filters with batch mode. I don’t really define any terms in this post, so if you don’t have a solid grasp of the fundamentals you should consider this blog post by Paul White required reading.

Test Data


Let’s start with a few simple examples that don’t involve columnstore. All of the test queries are simple joins between a dimension and a fact table on a DATETIME column. I’ll use the same dimension table for all of them:

DROP TABLE IF EXISTS dbo.DimDim;

CREATE TABLE dbo.DimDim (
	dimDate DATETIME,
	PRIMARY KEY (dimDate)
);

INSERT INTO dbo.DimDim VALUES
('20170101'),
('20170102'),
('20170103'),
('20170104'),
('20170105'),
('20170106'),
('20170107'),
('20170108'),
('20170109'),
('20170110'),
('20171201'),
('20171202'),
('20171203'),
('20171204'),
('20171205'),
('20171206'),
('20171207'),
('20171208'),
('20171209'),
('20171210');

Twenty rows in total with 10 dates in January and 10 dates in December. Obviously this isn’t a proper dimension table, but it makes the demos a little simpler. The fact tables have about a million rows in all twelve months of 2017 for a total of about 12 million rows.

Rowstore Heaps


Let’s start with a rowstore heap for the fact table. Code to create and populate the table is below:

DROP TABLE IF EXISTS dbo.FactHeapNoPart;

CREATE TABLE dbo.FactHeapNoPart (
	factDate DATETIME,
	justTheFacts VARCHAR(100)
);

DECLARE @month INT = 1;
SET NOCOUNT ON;

WHILE @month <= 12
BEGIN
	INSERT INTO dbo.FactHeapNoPart
		WITH (TABLOCK)
	SELECT DATEADD(DAY, t.RN / 38500
	, DATEADD(MONTH, @month, '20161201'))
	, REPLICATE('FACTS', 20)
	FROM
	(
		SELECT TOP (1048576) ROW_NUMBER()
			OVER (ORDER BY (SELECT NULL)) RN
		FROM master..spt_values t1
		CROSS JOIN master..spt_values t2
	) t
	OPTION (MAXDOP 1);

	SET @month = @month + 1;
END;

The first demo query is forced to run in serial:

SELECT *
FROM dbo.DimDim dd
INNER JOIN dbo.FactHeapNoPart f
	ON dd.dimDate = f.factDate
OPTION (MAXDOP 1);

With a serial query there is no visible bitmap operator as expected:

a23_rowstore_heap_serial

On my machine, the query requires 190656 logical reads and 2234 ms of CPU time to execute.

Bumping the query up to MAXDOP 2 results in a bitmap operator:

a23_rowstore_heap_parallel

The bitmap operator isn’t pushed in row due to the data type, but only 769998 rows are sent to the hash match as a result. CPU time required to execute the query falls to 1844 and logical reads stays the same. We did the same amount of IO, which seems perfectly reasonable here.

Rowstore Clustered Indexes


It’s not a very common plan type, but what happens with a hash join on the clustered key of a rowstore table? The code below creates a fact table with the same data as before but now we have a clustered index:

DROP TABLE IF EXISTS dbo.FactClustNoPart;

CREATE TABLE dbo.FactClustNoPart (
	factDate DATETIME,
	justTheFacts VARCHAR(100)
);

CREATE CLUSTERED INDEX CI ON FactClustNoPart (factDate);

DECLARE @month INT = 1;
SET NOCOUNT ON;

WHILE @month <= 12
BEGIN
	INSERT INTO dbo.FactClustNoPart
		WITH (TABLOCK)
	SELECT DATEADD(DAY, t.RN / 38500
	, DATEADD(MONTH, @month, '20161201'))
	, REPLICATE('FACTS', 20)
	FROM
	(
		SELECT TOP (1048576) ROW_NUMBER()
			OVER (ORDER BY (SELECT NULL)) RN
		FROM master..spt_values t1
		CROSS JOIN master..spt_values t2
	) t
	OPTION (MAXDOP 1);

	SET @month = @month + 1;
END;

All rows are again read from the fact table. The bitmap operator isn’t quite as effective as before. 798498 rows are sent to the join but only 769998 remain after the join.

Could SQL Server do better? Building the hash table is a blocking operator and it should be trivial to keep track of the minimum and maximum join key while building it. In theory, one could imagine a plan with a clustered index seek on the fact table instead of a clustered index scan that takes advantage of the minimum and maximum values found during the hash build phase. This optimization would result in less overall IO. Perhaps this wasn’t implemented because this isn’t a very common plan shape.

Rowstore Partitioned Heaps


Now let’s move onto to a partitioned rowstore heap for the fact table. There is one partition per month and 12 partitions end up with data. Code to create and populate the table is below:

CREATE PARTITION FUNCTION hate_this_syntax_fun
(DATETIME)
AS RANGE RIGHT
FOR VALUES (
  '20161231'
, '20170101'
, '20170201'
, '20170301'
, '20170401'
, '20170501'
, '20170601'
, '20170701'
, '20170801'
, '20170901'
, '20171001'
, '20171101'
, '20171201'
, '20180101'
);

CREATE PARTITION SCHEME hate_this_syntax_scheme
AS PARTITION hate_this_syntax_fun
ALL TO ( [PRIMARY] );

DROP TABLE IF EXISTS dbo.FactHeapPart;

CREATE TABLE dbo.FactHeapPart (
	factDate DATETIME,
	justTheFacts VARCHAR(100)
) ON hate_this_syntax_scheme (factDate);
set statistics io, time on;

DECLARE @month INT = 1;
SET NOCOUNT ON;

WHILE @month <= 12
BEGIN
	INSERT INTO dbo.FactHeapPart
		WITH (TABLOCK)
	SELECT t2.factDate, t2.justTheFacts
	FROM
	(
		SELECT CAST(
			DATEADD(DAY, CAST(t.RN / 38500 AS INT)
			, DATEADD(MONTH, @month, '20161201')
			) AS DATETIME) factDate
		, REPLICATE('FACTS', 20) justTheFacts
		FROM
		(
			SELECT TOP (1048576) ROW_NUMBER()
				OVER (ORDER BY (SELECT NULL)) RN
			FROM master..spt_values t1
			CROSS JOIN master..spt_values t2
		) t
	) t2
	--WHERE $PARTITION.hate_this_syntax_fun(t2.factDate) = @month + 2
	OPTION (MAXDOP 1);

	SET @month = @month + 1;
END;

The code above takes a bit longer to execute than I would have liked. There’s a sort before inserting data even with a filter on the partitioning function. I’m not sure why I couldn’t make the sort go away. I expect that it has something to do with data types.

Running the same query as before:

SELECT *
FROM dbo.DimDim dd
INNER JOIN dbo.FactHeapPart f
	ON dd.dimDate = f.factDate
OPTION (MAXDOP 2);

The plan looks the same as before. The bitmap sends 790371 rows to the hash join. One thing to note is that all partitions are read from the table:
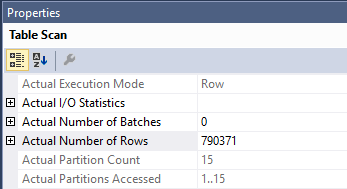
a23_all_partitions

We know that based on the data in the dimension table that SQL Server only needs to read two partitions from the fact table. Could the query optimizer in theory do better than it did? Consider the fact that a partitioned table has at most 15000 partitions. All of the partition values cannot overlap and they don’t change without a DDL operation. When building the hash table the query optimizer could keep track of which partitions have at least one row in them. By the end of the hash build we’ll know exactly which partitions could contain data, so the rest of the partitions could be skipped during the probe phase.

Perhaps this isn’t implemented because it’s important for the hash build to be independent of the probe. Maybe there’s no guarantee available at the right time that the bitmap operator will be pushed all the way down to the scan as opposed to a repartition streams operator. Perhaps this isn’t a common case and the optimization isn’t worth the effort. After all, how often do you join on the partitioning column instead of filtering by it?

It’s worth noting that the theoretical optimization described above still isn’t as good as the collocated join optimization blogged about by Paul White.

Columnstore


Now let’s build a columnstore index with 1048576 rows per rowgroup:

DROP TABLE IF EXISTS dbo.FactCCINoPart;

CREATE TABLE dbo.FactCCINoPart (
	factDate DATETIME,
	justTheFacts VARCHAR(100),
	INDEX CCI CLUSTERED COLUMNSTORE
);

DECLARE @month INT = 1;
SET NOCOUNT ON;

WHILE @month <= 12
BEGIN
	INSERT INTO dbo.FactCCINoPart
		WITH (TABLOCK)
	SELECT t2.factDate, t2.justTheFacts
	FROM
	(
		SELECT CAST(
			DATEADD(DAY, CAST(t.RN / 38500 AS INT)
			, DATEADD(MONTH, @month, '20161201')
			) AS DATETIME) factDate
		, REPLICATE('FACTS', 20) justTheFacts
		FROM
		(
			SELECT TOP (1048576) ROW_NUMBER()
				OVER (ORDER BY (SELECT NULL)) RN
			FROM master..spt_values t1
			CROSS JOIN master..spt_values t2
		) t
	) t2
	OPTION (MAXDOP 1);

	SET @month = @month + 1;
END;

Let’s return to our serial join query:

SELECT *
FROM dbo.DimDim dd
INNER JOIN dbo.FactCCINoPart f
	ON dd.dimDate = f.factDate
OPTION (MAXDOP 1);

A few interesting things happen. The first is that we get rowgroup elimination even though the dates in the dimension table are spread very far apart:

Table ‘FactCCINoPart’. Segment reads 2, segment skipped 10.

The following simple query doesn’t get rowgroup elimination:

SELECT *
FROM dbo.FactCCINoPart f
WHERE f.factDate IN ('20170101', '20171231')

You can read more about that limitation here. It’s fair to say that the bitmap filter does a better job than expected with rowgroup elimination. According to extended events this is known as an expression filter bitmap. The extended event has a few undocumented properties about the bitmap:
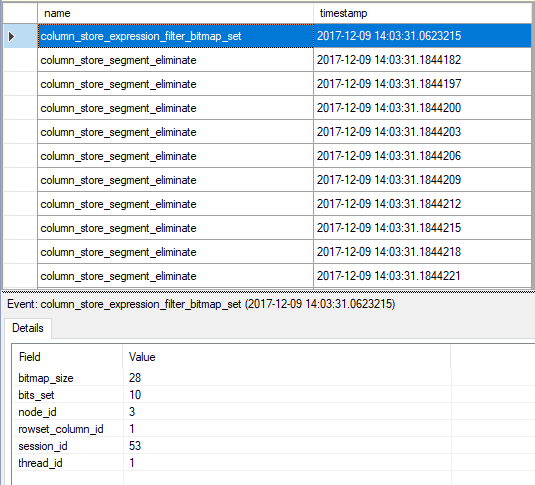
a23_cs bitmap_xe

I watched the extended events fly by a few times but it wasn’t clear to me what was going on internally. One possible implementation would be for the hash build to compare each build row to the rowgroup low and high values to figure out which rowgroups could never possibly return matched rows. I strongly suspect that is not the implementation that Microsoft chose. Perhaps they take advantage of the small expected size of the bitmap filter to send information about all of the build rows to do elimination. I don’t know a lot about computer science, but the usual structure of bitmap would not be sufficient because you can’t use such a bitmap to make any determination about inequality comparisons. It can only tell you if an individual row can’t match.

The second interesting thing is that we get an optimized bitmap even for a serial plan:
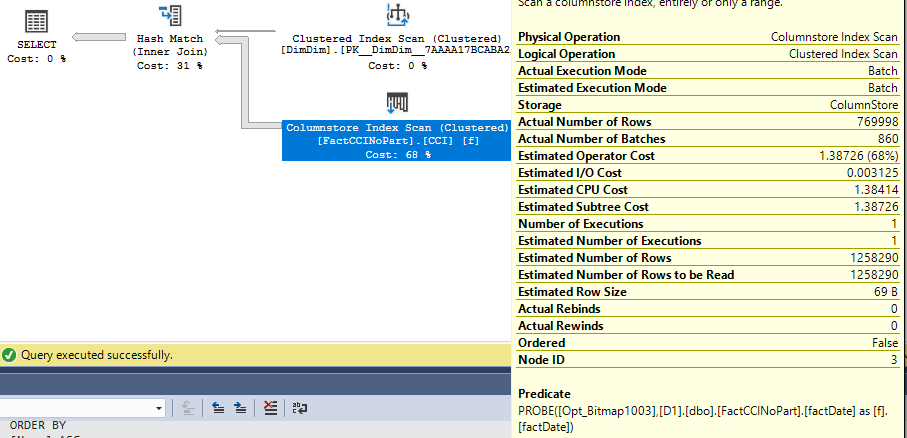
a23_CCI_opt_bitmap

Optimized Bitmaps


At some point optimized bitmaps were limited to parallel plans. I suspect that restriction was relaxed with the availability of batch mode in a plan but I don’t know for sure. The demos below show optimized bitmaps both improving and degrading performance. The script below creates three tables and takes about three minutes to run on my machine:

DROP TABLE IF EXISTS #t;

SELECT TOP (3000000) ROW_NUMBER()
	OVER (ORDER BY (SELECT NULL)) RN into #t
FROM master..spt_values t1
CROSS JOIN master..spt_values t2;

-- rowstore dim with an index
-- that includes DimForeignKey
DROP TABLE IF EXISTS dbo.RSJoinIndex;
CREATE TABLE dbo.RSJoinIndex (
	IrrelevantKey BIGINT,
	SelectKey BIGINT,
	DimForeignKey BIGINT,
	FilterIndexed INT,
	PageFiller VARCHAR(3000),
	PRIMARY KEY (IrrelevantKey)
);

INSERT INTO dbo.RSJoinIndex WITH (TABLOCK)
SELECT t.RN, 1, t.RN, 1, REPLICATE('Z', 3000)
FROM #t t
OPTION (MAXDOP 1);

CREATE INDEX IX_RSJoinIndex ON dbo.RSJoinIndex
	(FilterIndexed) INCLUDE (DimForeignKey);
CREATE STATISTICS S1 ON dbo.RSJoinIndex (DimForeignKey)
	WITH FULLSCAN;

-- rowstore dim with an index
-- that does not include DimForeignKey
DROP TABLE IF EXISTS dbo.RSNoJoinIndex;
CREATE TABLE dbo.RSNoJoinIndex (
	IrrelevantKey BIGINT,
	SelectKey BIGINT,
	DimForeignKey BIGINT,
	FilterIndexed INT,
	PageFiller VARCHAR(3000),
	PRIMARY KEY (IrrelevantKey)
);

INSERT INTO dbo.RSNoJoinIndex WITH (TABLOCK)
SELECT t.RN, 1, t.RN, 1, REPLICATE('Z', 3000)
FROM #t t
OPTION (MAXDOP 1);

CREATE INDEX IX_RSNoJoinIndex ON dbo.RSNoJoinIndex
	(FilterIndexed);
CREATE STATISTICS S1 ON dbo.RSNoJoinIndex (DimForeignKey)
	WITH FULLSCAN;

-- CCI fact table
DROP TABLE IF EXISTS dbo.CCIFact;
CREATE TABLE dbo.CCIFact (
	DimForeignKey BIGINT,
	FilterCol BIGINT,
	INDEX CCI CLUSTERED COLUMNSTORE
);

INSERT INTO dbo.CCIFact WITH (TABLOCK)
SELECT t.RN , 1 + t.RN % 1000
FROM #t t
OPTION (MAXDOP 1);

CREATE STATISTICS S1 ON dbo.CCIFact (DimForeignKey)
	WITH FULLSCAN;
CREATE STATISTICS S2 ON dbo.CCIFact (FilterCol)
	WITH FULLSCAN;

All tables have three million rows and the join between them results in 3000 rows. RSJoinIndex is a rowstore table with 3 million rows that contains the join column in a nonclustered index. RSNoJoinIndex is a rowstore table without the join column in a nonclustered index. CCIFact is a columnstore table with three million rows.

Optimized Bitmaps Gone Right


Consider the following query:

SELECT table0.SelectKey
FROM dbo.RSNoJoinIndex AS table0
INNER JOIN dbo.CCIFact AS table1
ON table0.DimForeignKey = table1.DimForeignKey
WHERE table0.FilterIndexed = 1
  AND table1.FilterCol = 1 -- 0.1% of the data
OPTION (MAXDOP 1);

The RSNoJoinIndex table has an index with a key column of FilterIndexed and an included column of DimForeignKey. Here’s the plan that I get:

a23_final_good_bitmap

The CCI is used as the build for the hash join. The highlighted filter is an optimized bitmap that’s applied after the index seek but before the key lookup to get the SelectKey column. The bitmap reduces the number of required key lookups from 3000000 to just 3000. The query executes and requires 21874 logical reads from the rowstore table and 437 ms of CPU time on my machine.

Overall this is a reasonable plan and an effective application of a bitmap filter.

Optimized Bitmaps Gone Wrong


Let’s query the table without the join column in the index:

SELECT table0.SelectKey
FROM dbo.RSNoJoinIndex AS table0
INNER JOIN dbo.CCIFact AS table1
ON table0.DimForeignKey = table1.DimForeignKey
WHERE table0.FilterIndexed = 1
  AND table1.FilterCol = 1 -- 0.1% of the data
OPTION (MAXDOP 1);

Here’s the plan:

a23_final_bad_bitmap

The position of the bitmap has changed so that it’s evaluated after the key lookup. That makes sense because the key lookup returns the column to be filtered against. However, the bitmap filter still reduces the estimated number of key lookups from 3000000 to 3000. This is impossible. The filter can only be applied after the key lookup, so it does not make sense for the bitmap to reduce the number of estimated executions of the key lookup.

Performance is significantly worse with the query now requiring 12199107 logical reads from the rowstore table and 13406 CPU time overall. We can see that the query did three million key lookups:
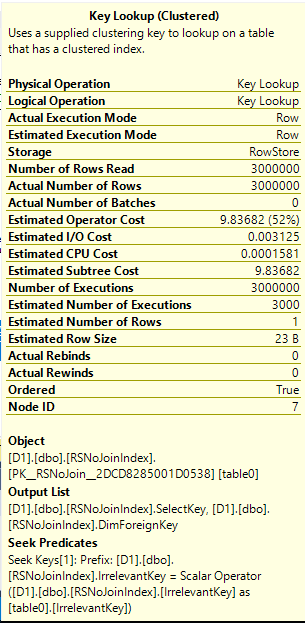
a23_3M_Keylookups

I could only get this type of plan to appear with a columnstore index somewhere present in the query. It can be triggered even with two rowstore tables as long as the query is batch mode eligible. I’ve filed a connect item for this issue. Please vote if you have a moment.

Final Thoughts


Batch mode and columnstore have brought some interesting (and as far as I can tell, undocumented) improvements to bitmap filters. Thanks for reading!
The Referential Integrity Operator

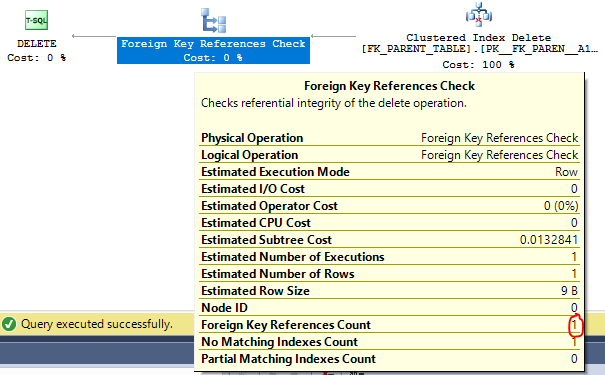
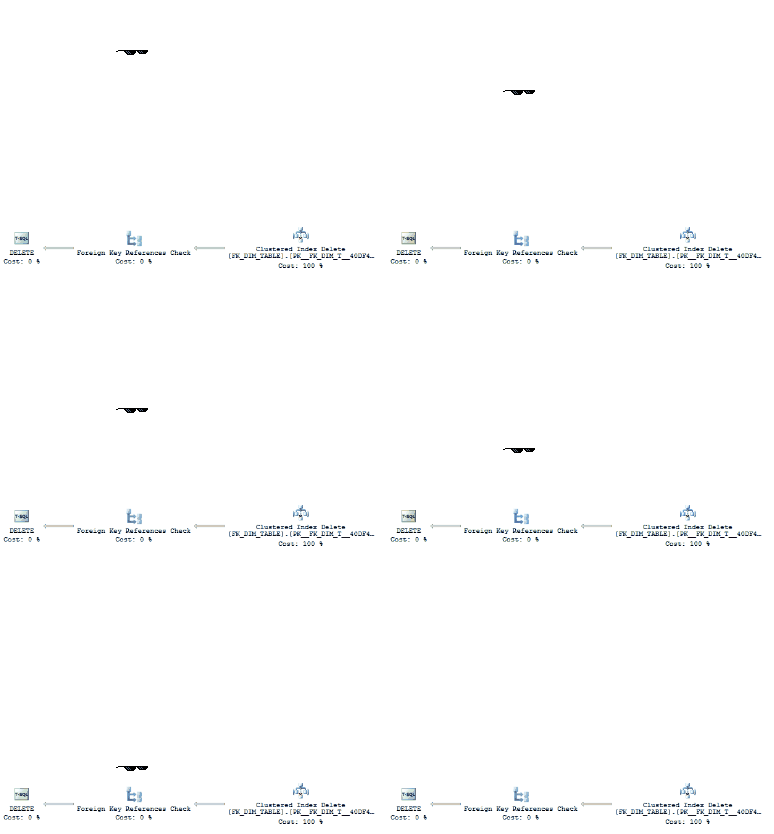
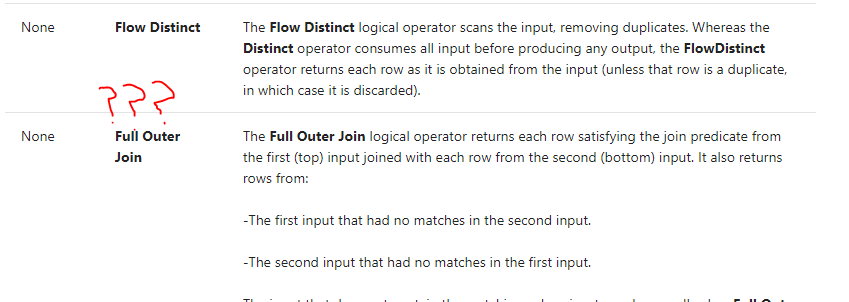
SQL Server 2016 introduced a new query plan operator that mostly flew under the radar: foreign key references check. It doesn’t even show up in the list of operators:

a22_missing_operator

I’m not a foreign key guy, but a new operator is interesting enough for me to poke around. It’s described as the referential integrity operator in most of the docs so I’ll also describe it that way here for the rest of the post.

What Problem Does This Operator Solve?


Let’s start with a simple parent table and a simple child table that has two columns which both reference the parent table:

DROP TABLE IF EXISTS dbo.FK_PARENT_TABLE;
CREATE TABLE dbo.FK_PARENT_TABLE (
    FKey BIGINT NOT NULL,
    PRIMARY KEY (FKey)
); 

INSERT INTO FK_PARENT_TABLE VALUES (1);

DROP TABLE IF EXISTS dbo.CHILD_TABLE_BIG;
CREATE TABLE dbo.CHILD_TABLE_BIG (
	SurrogateKey BIGINT NOT NULL,
	FKey1 BIGINT NOT NULL,
	CONSTRAINT FK_CHILD_TABLE_BIG_1 FOREIGN KEY (FKey1)
		REFERENCES FK_PARENT_TABLE (FKey),
	FKey2 BIGINT NOT NULL,
	CONSTRAINT FK_CHILD_TABLE_BIG_2 FOREIGN KEY (FKey2)
		REFERENCES FK_PARENT_TABLE (FKey),
);

What happens if we need to delete a row from the parent table? SQL Server has to check that none of the children table values match the value we want to delete. The check can be seen in the execution plan for the delete query:

a22_simple_delete_2_references

In this example, we have two unindexed columns in the child table. The query optimizer does a table scan for each referencing row. CHILD_TABLE_BIG is currently empty so this isn’t a problem.

What would happen if a parent table was referenced by hundreds of child tables, such as for a date dimension table? Deleting or updating a row in the parent table would create a query plan with at least one join per incoming foreign key reference. Creating a query plan for that statement is equivalent to creating a query plan for a query containing hundreds or even thousands of joins. That query plan could take a long time to compile or could even time out. For example, I created a simple query with 2500 joins and it still hadn’t finished compiling after 15 minutes. That’s why I assume a table is limited to 253 incoming foreign key references in SQL Server 2014.

That restriction won’t be hit often but could be pretty inconvenient to work around. The referential integrity operator introduced with compatibility level 130 raises the limit from 253 to 10000. All of the joins are collapsed into a single operator which can reduce compile time and avoid errors. From a blog post by Gjorgji Gjeorgjievski:

SQL Server 2016 introduces a new Referential Integrity Operator (under compatibility level 130) that increases the limit on the number of other tables with foreign key references to a primary or unique key of a given table (incoming references), from 253 to 10,000. The new query execution operator does the referential integrity checks in place, by comparing the modified row to the rows in the referencing tables, to verify that the modification will not break the referential integrity. This results in much lower compilation times for such plans and comparable execution times.

Many of SQL Server’s query plan operators are designed to be small in scope and reusable for lots of different purposes. For example, when STRING_AGG() was released in SQL Server 2017 it wasn’t necessary for Microsoft to create a new query plan operator. That function was implemented with a combination of existing operators. It’s unfortunate that the referential integrity operator is an “all-in-one” operator. Perhaps this was the only practical way to increase the number of incoming references.

Running Out Of Stack Space


First I’ll create tables similar to before, but CHILD_TABLE_BIG will have 253 references to FK_PARENT_TABLE. The code to create those tables is too tedious and long for this blog post, and that’s saying something. After creating the tables, the next step is to set the compatibility level to 120:

ALTER DATABASE tempdb SET COMPATIBILITY_LEVEL = 120;

Now I try to create one more incoming reference:

CREATE TABLE dbo.JUST_ONE_MORE_FK (
	SurrogateKey BIGINT NOT NULL,
	FKey254 BIGINT NOT NULL,
		CONSTRAINT FK_254 FOREIGN KEY (FKey1)
		REFERENCES FK_PARENT_TABLE (FKey)
);

It worked. So did generating a plan to delete a row from the parent table, which is a bit surprising. On SQL Server 2016 or later with compatibility level 120, it’s possible to create a query plan for a delete or update against a table with more than 253 incoming references. It’s certainly possible to get into trouble with too many incoming references. For example, I get the following error when attempting to delete from a parent table with about 2000 incoming references:

Msg 8621, Level 17, State 1, Line 2015
The query processor ran out of stack space during query optimization. Please simplify the query.

Referential Integrity Operator to the Rescue


Now I’ll reset the compatibility level to 140 and reset all of the tables. Now there are only 253 incoming references to the parent table.

ALTER DATABASE tempdb SET COMPATIBILITY_LEVEL = 140;

DELETE FROM dbo.FK_PARENT_TABLE
WHERE FKey = 1;

The query plan is a long one:

a22_simple_delete_253_references

Looks like we don’t get the new operator by default with just 253 incoming references. Let’s add one more reference:

DROP TABLE IF EXISTS dbo.JUST_ONE_MORE_FK;

CREATE TABLE dbo.JUST_ONE_MORE_FK (
	SurrogateKey BIGINT NOT NULL,
	FKey254 BIGINT NOT NULL,
		CONSTRAINT FK_254 FOREIGN KEY (FKey254)
		REFERENCES FK_PARENT_TABLE (FKey)
);

Here it is:

a22_first_time_seeing_operator

This operator is made available through the RefIntegrityMaintainer optimizer rule. If I disable that optimizer rule with 254 incoming references I get the usual error:

Msg 8622, Level 16, State 1, Line 278
Query processor could not produce a query plan because of the hints defined in this query. Resubmit the query without specifying any hints and without using SET FORCEPLAN.

It is possible to force a plan without the new operator (more on that later). It just isn’t as easy as disabling the new optimizer rule.

Is it possible to get this operator with 253 or fewer incoming references? Yes:

a22_ref_operator_1_fk

The foreign key references check operator is used here with just one incoming reference. This was done via a USE HINT query hint:

DELETE FROM dbo.FK_PARENT_TABLE
WHERE FKey = 1
OPTION (USE PLAN N'Snipped because it broke the code formatter');

Snipped plan hint:

'<?xml version="1.0" encoding="utf-16"?>
<ShowPlanXML xmlns:xsi="http://www.w3.org/2001/XMLSchema-instance" xmlns:xsd="http://www.w3.org/2001/XMLSchema" Version="1.6" Build="14.0.3008.27" xmlns="http://schemas.microsoft.com/sqlserver/2004/07/showplan">
  <BatchSequence>
    <Batch>
      <Statements>
        <StmtSimple>
          <StatementSetOptions />
          <QueryPlan >
            <MemoryGrantInfo SerialRequiredMemory="0" SerialDesiredMemory="0" />
            <OptimizerHardwareDependentProperties EstimatedAvailableMemoryGrant="0" EstimatedPagesCached="0" EstimatedAvailableDegreeOfParallelism="0" MaxCompileMemory="0" />
            <RelOp AvgRowSize="0" EstimateCPU="0" EstimateIO="0" EstimateRebinds="0" EstimateRewinds="0" EstimatedExecutionMode="Row" EstimateRows="0" LogicalOp="Foreign Key References Check" NodeId="0" Parallel="false" PhysicalOp="Foreign Key References Check" EstimatedTotalSubtreeCost="0">
              <OutputList />
              <ForeignKeyReferencesCheck>
                <RelOp AvgRowSize="0" EstimateCPU="0" EstimateIO="0" EstimateRebinds="0" EstimateRewinds="0" EstimatedExecutionMode="Row" EstimateRows="0" LogicalOp="Delete" NodeId="1" Parallel="false" PhysicalOp="Clustered Index Delete" EstimatedTotalSubtreeCost="0">
                  <OutputList>
                    <ColumnReference Database="" Schema="" Table="" Column="" />
                  </OutputList>
                  <SimpleUpdate DMLRequestSort="false">
                    <Object Database="[D1]" Schema="[dbo]" Table="[FK_PARENT_TABLE]" Index="[PK__FK_PAREN__A19DDDFB5081F0A5]" IndexKind="Clustered" Storage="RowStore" />
                    <SeekPredicateNew>
                      <SeekKeys>
                        <Prefix ScanType="EQ">
                          <RangeColumns>
                            <ColumnReference Database="" Schema="" Table="" Column="" />
                          </RangeColumns>
                          <RangeExpressions>
                            <ScalarOperator ScalarString="">
                              <Const ConstValue="" />
                            </ScalarOperator>
                          </RangeExpressions>
                        </Prefix>
                      </SeekKeys>
                    </SeekPredicateNew>
                  </SimpleUpdate>
                </RelOp>
                <ForeignKeyReferenceCheck>
                  <IndexScan Ordered="false">
                    <Object Database="" Schema="" Table="" IndexKind="Heap" Storage="RowStore" />
                  </IndexScan>
                </ForeignKeyReferenceCheck>
              </ForeignKeyReferencesCheck>
            </RelOp>
            <ParameterList>
              <ColumnReference Column="@1" ParameterDataType="tinyint" ParameterCompiledValue="(1)" />
            </ParameterList>
          </QueryPlan>
        </StmtSimple>
      </Statements>
    </Batch>
  </BatchSequence>
</ShowPlanXML>'

I suspect that this plan shape can also be achieved through the query store or a plan guide but did not test that.

Striking Gold With Extended Events


I got stuck on something during my investigation so I begrudgingly went into the extended events area of SSMS. The only relevant event that I found was reason_many_foreign_keys_operator_not_used, but oh what an event it was! a22_extended_events_gold Is trace flag 9448 a previously unknown (to the community) trace flag? Sure looks like it: a22_world_first_trace_flag Not a very useful one, but I can cross “discover a trace flag” off my bucket list. I searched around a bit in sys.dm_xe_map_values but couldn’t find any other freebies. Some of the other reasons are helpful as well (I had mistakenly thought that an alternate plan couldn’t be forced before seeing that). I have no idea what some of them mean (MERGE_OPERATION), but this blog post isn’t going to dig into all of the reasons why you might not get the operator. I’m mainly looking to understand the basics of when it can show up, what it does, and when it can go wrong.
Operator Mechanics


The estimated plan details for the operator and the XML give you some level of information, but it isn’t too clear what’s going on under the hood. Below is a theory that I formed through some testing:

For plan creation, loop through each incoming foreign key in object_id order. Look for a suitable index on that column. A suitable index is a non-filtered one with all of the foreign key columns existing as a left subset of the index key columns. If there are multiple suitable indexes, pick the one with the highest index_id.

The possible access paths I was able to get were nonclustered index seek, clustered index scan, and table scan. For query execution, process each row one at a time in the operator. Check all foreign keys in object_id order using the access method that was determined earlier. Something like the equivalent query is run for each row getting deleted or updated and for each incoming foreign key reference:

SELECT TOP 1 1
FROM CHILD_TABLE WITH (INDEX (?))
WHERE ID = ?
OPTION (MAXDOP 1);

If any query returns a row, immediately quit and throw an error. I’m not claiming that SQL Server actually runs a separate query for each check that it needs to do. In fact, I suspect that it takes some kind of shortcut using the storage engine. That could be why the referential integrity operator currently doesn’t support incoming foreign key references from columnstore indexes.

The important takeaways here are that this operator truly operates rows by row and isn’t very flexible when it comes to index selection. It’s easy to imagine a scenario in which thousands of even millions of table scans would be performed by this operator, so indexing key columns on the child tables are important for performance of this operator.

XML Structure


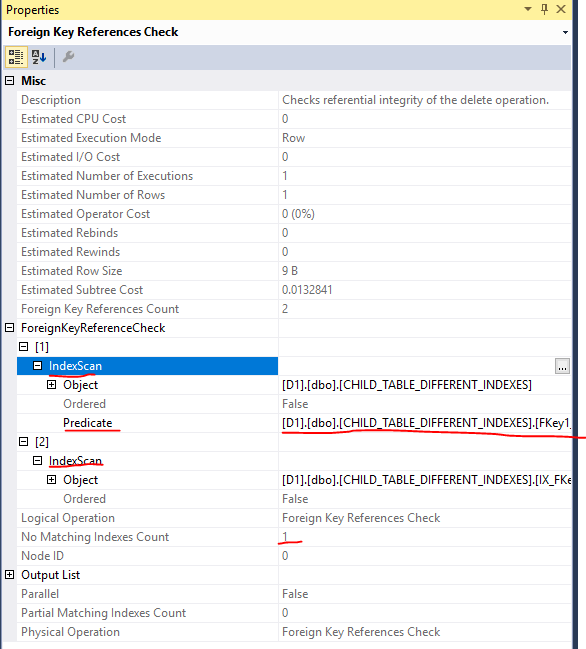
There’s some information in the show plan for this operator but I had trouble decoding it. There’s a partial matching indexes count field and I couldn’t figure out how to get that to be anything but zero. Filtering indexes, covering indexes, and indexes with the first column of a two column foreign key all didn’t work.

The other annoying thing is that all table accesses are described as IndexScan, even when the equivalent of an index seek will be used:

a22_annoying_show_plan

A seek won’t have a predicate specified. You can also tell apart scans and seeks by paying attention to the amount of detail in the XML.  Here’s what an index seek looks like:

Here's what a clustered index scan looks like:

The operator details do tell you how many unmatched foreign keys that you have which is nice. But it might not be easy to immediately identify the problem column.

Compile Time and Best Case Performance


For the next set of tests I created a single parent table along with child tables of 100 columns each. The child tables had 1000 rows along with a foreign key and an index on each column. I forced the new operator to appear with fewer than 254 incoming references via a USE HINT query plan and I prevented the new operator from appearing with TF 9448 with more than 253 incoming references. For each test I deleted half of the parent table, 500 rows.

Here's the code that never produces a plan with the referential integrity operator:

BEGIN TRANSACTION;
SET STATISTICS TIME ON;

DELETE FROM FK_PARENT_TABLE
WHERE Fkey BETWEEN 501 AND 1000
OPTION (RECOMPILE, QUERYTRACEON 9448);

SET STATISTICS TIME OFF;
ROLLBACK;

BEGIN TRANSACTION;
SET STATISTICS TIME ON;

DELETE FROM FK_PARENT_TABLE
WHERE Fkey BETWEEN 501 AND 1000
OPTION (RECOMPILE, QUERYTRACEON 9448, LOOP JOIN);

SET STATISTICS TIME OFF;
ROLLBACK;

Here's part of the code to get the new operator:

BEGIN TRANSACTION;

DELETE FROM FK_PARENT_TABLE
WHERE Fkey BETWEEN 501 AND 1000
OPTION (RECOMPILE,
USE PLAN N'
...
'
);

ROLLBACK;

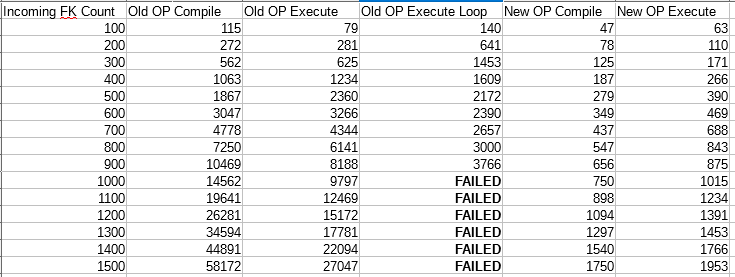
Here is a chart of my results:

a22_compile_chart

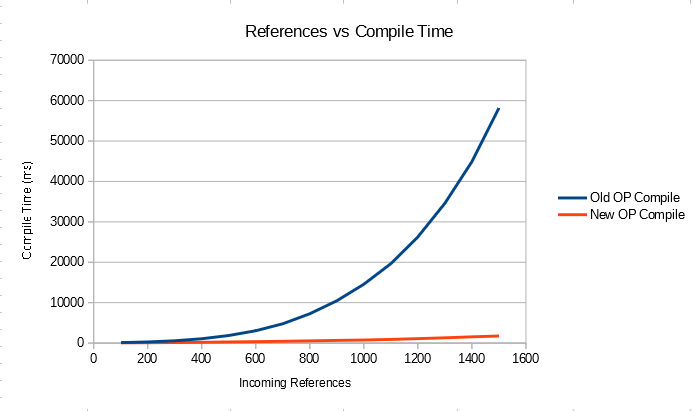
Here are some graphs, because good blog posts have graphs:

a22_super_cool_chart

The referential integrity operator wins pretty handily here, although I wonder what all of the fuss around the former 253 incoming limit was about. I'm also impressed that the new operator performs so much better even when comparing to forced nested loop joins. The number of logical reads reported through SET STATISTICS IO is very similar but not identical.

Worst Case Performance


The big disadvantage of the operator (other than us not knowing what's going on) is that table access and plan options are very limited. In addition, there seem to be no query rules or query hints which will affect the performance of the operator. I'm not saying that deleting rows from a parent table with unindexed children tables is a good practice, but you have more options in that situation without the new operator.

For this next test, I created a 100 column child table without 100 foreign keys but no indexes. The child table has 1045000 rows because I accidentally inserted too many rows into it.

Deleting 10 rows from the parent table with the new operator results in 50000 = 10 * 100 table scans, although the reporting isn't quite correct:

Table 'CHILD_TABLE_1'. Scan count 100, logical reads 117040000, physical reads 0, read-ahead reads 0, lob logical reads 0, lob physical reads 0, lob read-ahead reads 0.

SQL Server Execution Times:
CPU time = 161204 ms, elapsed time = 163982 ms.

The table has 117040 data pages so the scan count should have been reported as 1000.

Deleting 500 rows from the parent table without the new operator results in a table scan on the inner side of a nested loop:

a22_row_goal

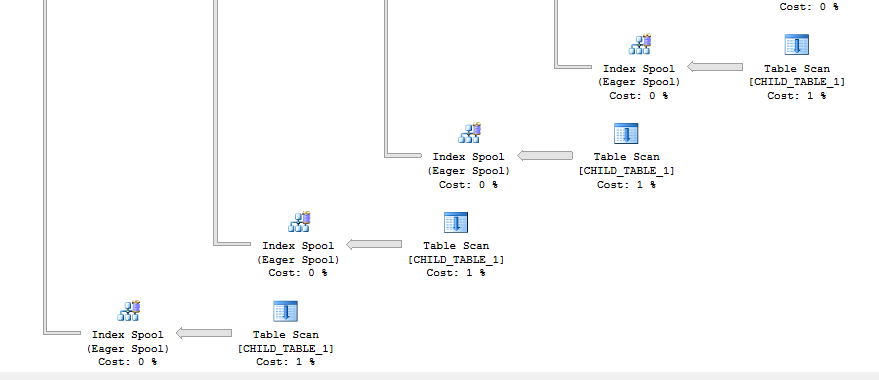
The cost of the scan is discounted due to the row goal. It is amusing to consider that the query optimizer assumes that a matching row will quickly be found when such a row would violate the assert for the foreign keys. Disabling the row goal gives me 100 index eager spools, which is good only for causing nightmares:

a22_nightmare

Forcing a MERGE JOIN results in parallel zones in the foreign key checking section which is interesting to see:

a22_merge_join

This query finishes faster than the query with the referential integrity operator:

Table 'CHILD_TABLE_1'. Scan count 500, logical reads 11704000, physical reads 0, read-ahead reads 0, lob logical reads 0, lob physical reads 0, lob read-ahead reads 0.
Table 'FK_PARENT_TABLE'. Scan count 1, logical reads 2, physical reads 0, read-ahead reads 0, lob logical reads 0, lob physical reads 0, lob read-ahead reads 0.

SQL Server Execution Times:
CPU time = 165521 ms, elapsed time = 89318 ms.

I expect the elapsed time to be better on a machine with better hardware than mine. If I delete negative foreign keys then I get even better performance:

SQL Server Execution Times:
CPU time = 56515 ms, elapsed time = 57350 ms.

The easiest way to get a large performance difference is by creating a wide table with just one foreign key column. The referential integrity can only do scans but traditional plans have more options. Code below:

DROP TABLE IF EXISTS CHILD_TABLE_THREE_COL;
DROP TABLE IF EXISTS dbo.FK_PARENT_TABLE

CREATE TABLE FK_PARENT_TABLE (
    FKey BIGINT NOT NULL
    PRIMARY KEY (FKey)
); 

INSERT INTO FK_PARENT_TABLE
SELECT TOP (2000) -1 + ROW_NUMBER()
	OVER (ORDER BY (SELECT NULL))
FROM master..spt_values;

CREATE TABLE dbo.CHILD_TABLE_THREE_COL (
	FKey1 BIGINT NOT NULL,
		FOREIGN KEY (FKey1)
		REFERENCES FK_PARENT_TABLE (FKey),
	OtherKey BIGINT NOT NULL,
	FILLER VARCHAR(3500)
);

INSERT INTO CHILD_TABLE_THREE_COL WITH (TABLOCK)
SELECT TOP (1000 * 1000) RN / 1000
, 1
, REPLICATE('Z', 3500)
FROM
(
	SELECT ROW_NUMBER()
		OVER (ORDER BY (SELECT NULL)) RN
	FROM master..spt_values t1
	CROSS JOIN master..spt_values t2
) t;

CREATE INDEX COVERING ON CHILD_TABLE_THREE_COL (OtherKey, FKey1);

For this delete:

DELETE FROM FK_PARENT_TABLE
WHERE Fkey BETWEEN 1010 AND 1110;

Here are the stats for the refential integrity operator:

Table 'CHILD_TABLE_THREE_COL'. Scan count 1, logical reads 50500101, physical reads 0, read-ahead reads 0, lob logical reads 0, lob physical reads 0, lob read-ahead reads 0.
Table 'FK_PARENT_TABLE'. Scan count 1, logical reads 2, physical reads 0, read-ahead reads 0, lob logical reads 0, lob physical reads 0, lob read-ahead reads 0.

SQL Server Execution Times:
CPU time = 31062 ms, elapsed time = 31100 ms.

Here are the stats for a standard plan with an index spool:

Table 'Worktable'. Scan count 101, logical reads 2955922, physical reads 0, read-ahead reads 0, lob logical reads 0, lob physical reads 0, lob read-ahead reads 0.
Table 'CHILD_TABLE_THREE_COL'. Scan count 1, logical reads 500001, physical reads 0, read-ahead reads 0, lob logical reads 0, lob physical reads 0, lob read-ahead reads 0.
Table 'FK_PARENT_TABLE'. Scan count 1, logical reads 2, physical reads 0, read-ahead reads 0, lob logical reads 0, lob physical reads 0, lob read-ahead reads 0.

SQL Server Execution Times:
CPU time = 2219 ms, elapsed time = 2223 ms.

The index spool is so effective here because the temporary object doesn't include the FILLER column. Oddly, I wasn't able to get the query optimizer to use a covering index, so this example will have to do.

MS Response


I contacted Microsoft to express my concerns about performance. They responded with the following:

a22_MSFT_response

Disabling the Operator


If the new operator is causing you some kind of problem you do have a few options. You can use undocumented trace flag 9448 to disable the feature, although I can't recommend that for production. Columnstore indexes still aren't supported with the operator in SQL Server 2017, so you could create an empty columnstore table with foreign keys to any relevant parent tables. You can also run your delete or update query from a database with a compatibility level of 120. It isn't necessary for the database to contain the parent table or even any user tables.

The only performance problem that I ran into involved missing indexes, so adding those or temporarily disabling foreign keys as needed is probably the most production-friendly way of doing it.

Final Thoughts


Microsoft is doing some pretty sneaky things with the referential integrity operator. I object to the concept from an operator design standpoint but it seems to significantly reduce compile times and to provide surprisingly good performance in most cases. Thanks for reading!

SQL Server Join Containment for the Common Man

Lots of smart people have written about join containment, but none of the explanations really made sense to me. I felt like a student memorizing definitions for a test. Sure, I could tell you the definitions of base and simple containment, but what practical difference does it make when it comes to cardinality estimation? The concept finally clicked when working on an Oracle query of all things, and as a result I wrote this blog post. All testing was done on SQL Server 2017 with a CE version of 140.

A Note on Join Cardinality


Join cardinality calculations are incredibly complex in SQL Server. You can get a small taste of that complexity here. I’ve chosen the example data in this blog post to avoid most of the complexity. The formulas and concepts described in this post can’t be used to model join cardinality generally, but I hope that they serve as a good illustration of containment.

Demo Tables


All of the demo tables have identical structures with similar data. The first column, UNIQUE_ID, stores unique integers in the range specified in the table name. For example, TA_1_TO_1000000 is a table that stores integers from 1 to 1000000. The second column, MOD_FILTER, stores integers from 1 to 100 cycling through all rows. The purpose of this column is to make filtering cardinality estimates simple to calculate and predict. For example, MOD_FILTER BETWEEN 1 AND 50 will return 50% of the rows from the table. Full statistics are gathered on all columns, and there are four tables in all.

DROP TABLE IF EXISTS dbo.TA_1_TO_1000000;

CREATE TABLE dbo.TA_1_TO_1000000 (
	UNIQUE_ID BIGINT NOT NULL,
	MOD_FILTER BIGINT NOT NULL
);

INSERT INTO dbo.TA_1_TO_1000000
	WITH (TABLOCK)
SELECT t.RN
, 1 + t.RN % 100
FROM
(
	SELECT TOP (1000000) ROW_NUMBER()
		OVER (ORDER BY (SELECT NULL)) RN
	FROM master..spt_values t1
	CROSS JOIN master..spt_values t2
) t
OPTION (MAXDOP 1);

CREATE STATISTICS S1 ON dbo.TA_1_TO_1000000 (UNIQUE_ID)
	WITH FULLSCAN;
CREATE STATISTICS S2 ON dbo.TA_1_TO_1000000 (MOD_FILTER)
	WITH FULLSCAN;

DROP TABLE IF EXISTS dbo.TB_1_TO_1000000;

CREATE TABLE dbo.TB_1_TO_1000000 (
	UNIQUE_ID BIGINT NOT NULL,
	MOD_FILTER BIGINT NOT NULL
);

INSERT INTO dbo.TB_1_TO_1000000
	WITH (TABLOCK)
SELECT t.RN
, 1 + t.RN % 100
FROM
(
	SELECT TOP (1000000) ROW_NUMBER()
		OVER (ORDER BY (SELECT NULL)) RN
	FROM master..spt_values t1
	CROSS JOIN master..spt_values t2
) t
OPTION (MAXDOP 1);

CREATE STATISTICS S1 ON dbo.TB_1_TO_1000000 (UNIQUE_ID)
	WITH FULLSCAN;
CREATE STATISTICS S2 ON dbo.TB_1_TO_1000000 (MOD_FILTER)
	WITH FULLSCAN;

DROP TABLE IF EXISTS dbo.TC_1_TO_100000;

CREATE TABLE dbo.TC_1_TO_100000 (
	UNIQUE_ID BIGINT NOT NULL,
	MOD_FILTER BIGINT NOT NULL
);

INSERT INTO dbo.TC_1_TO_100000
	WITH (TABLOCK)
SELECT t.RN
, 1 + t.RN % 100
FROM
(
	SELECT TOP (100000) ROW_NUMBER()
		OVER (ORDER BY (SELECT NULL)) RN
	FROM master..spt_values t1
	CROSS JOIN master..spt_values t2
) t
OPTION (MAXDOP 1);

CREATE STATISTICS S1 ON dbo.TC_1_TO_100000 (UNIQUE_ID)
	WITH FULLSCAN;
CREATE STATISTICS S2 ON dbo.TC_1_TO_100000 (MOD_FILTER)
	WITH FULLSCAN;

DROP TABLE IF EXISTS dbo.TD_500001_TO_1500000;

CREATE TABLE dbo.TD_500001_TO_1500000 (
	UNIQUE_ID BIGINT NOT NULL,
	MOD_FILTER BIGINT NOT NULL
);

INSERT INTO dbo.TD_500001_TO_1500000
	WITH (TABLOCK)
SELECT t.RN
, 1 + t.RN % 100
FROM
(
	SELECT TOP (1000000) 500000 + ROW_NUMBER()
		OVER (ORDER BY (SELECT NULL)) RN
	FROM master..spt_values t1
	CROSS JOIN master..spt_values t2
) t
OPTION (MAXDOP 1);

CREATE STATISTICS S1 ON dbo.TD_500001_TO_1500000 (UNIQUE_ID)
	WITH FULLSCAN;
CREATE STATISTICS S2 ON dbo.TD_500001_TO_1500000 (MOD_FILTER)
	WITH FULLSCAN;

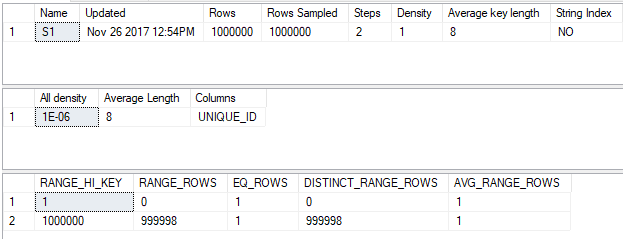
The statistics objects are perfect in that they fully describe the data. Here’s the statistics output for the UNIQUE_ID column:

a21_T2_perfect_stats_1

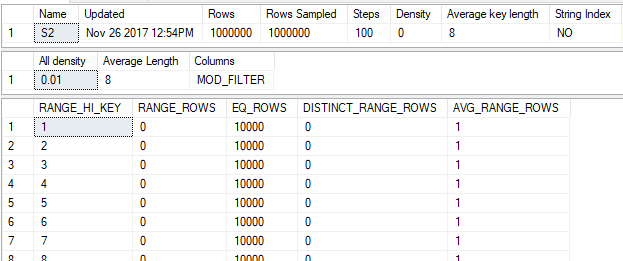
And here’s the output for the MOD_FILTER column:

a21_T2_perfect_stats_2

This only happened because the table was populated with very simple data that fits well within the framework for generating histograms in SQL Server. Gathering statistics, even with FULLSCAN, will often not perfectly represent the data in the column.
A Simple Model of Join Cardinality Estimation


Consider the following simple query:

SELECT *
FROM TB_1_TO_1000000 b
INNER JOIN dbo.TD_500001_TO_1500000 d
	ON b.UNIQUE_ID = d.UNIQUE_ID;

We know that exactly 500000 rows will be returned, but how might SQL Server estimate the number of rows to be returned? Let’s look at the histograms and try to align their steps:

a21_ex1_not_aligned

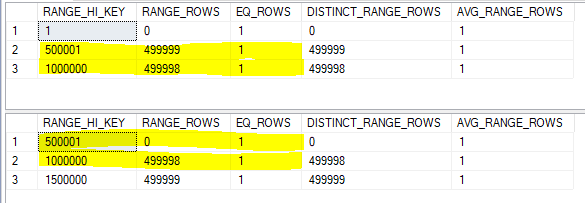
That doesn’t exactly work, but we can split up the histogram steps so they align. The assumption of uniformity within the step isn’t even needed here because we know that there aren’t missing any integer values. The histograms below are equivalent to the original ones:

a21_ex1_aligned

Now the RANGE_HI_KEY values align. For the step with a high value of 500001 we can expect only one row to match between tables. For the step with a high value of 1000000 we can expect 499998 + 1 rows to match. This brings the total row estimate to 500000, which happens to match what I get in SQL Server 2017 with the new CE. Remember, what we’re doing here isn’t how the query optimizer does the calculation. This is just a simple model that will be useful later.

Now consider the two queries below:

SELECT *
FROM TA_1_TO_1000000 a
INNER JOIN dbo.TB_1_TO_1000000 b
	ON a.UNIQUE_ID = b.UNIQUE_ID
WHERE a.MOD_FILTER BETWEEN 1 AND 50
AND b.MOD_FILTER BETWEEN 1 AND 50;

SELECT *
FROM TA_1_TO_1000000 a
INNER JOIN dbo.TB_1_TO_1000000 b
	ON a.UNIQUE_ID = b.UNIQUE_ID
WHERE a.MOD_FILTER BETWEEN 1 AND 50
AND b.MOD_FILTER BETWEEN 51 AND 100;

We know that the first query will return 500k rows and the second query will return 0 rows. However, can SQL Server know that? Each statistics object only contains information about its own column. There’s no correlation between the UNIQUE_ID and MOD_FILTER columns, so there isn’t a way for SQL Server to know that the queries will return different estimates. The query optimizer can create an estimate based on the filters on the WHERE clause and on the histograms of the join columns, but there’s no foolproof way to do that calculation. The presence of the filters introduces uncertainty into the estimate, even with statistics that perfectly describe the data for each column. The containment assumption is all about the modeling assumption that SQL Server has to make to resolve that uncertainty.

Base Containment


Base containment is the assumption that the filter predicates are independent from the join selectivity. The estimate for the join should be obtained by multiplying together the selectivity from both filters and the join. The query optimizer uses base containment starting with CE model version 120, also known as the new CE introduced in SQL Server 2014. It can be used with the legacy CE if trace flag 2301 is turned on. The best reference for trace flag 2301 is a blog post from 2006 which is no longer published.

Let’s go back to this example query:

SELECT *
FROM TA_1_TO_1000000 a
INNER JOIN dbo.TB_1_TO_1000000 b
	ON a.UNIQUE_ID = b.UNIQUE_ID
WHERE a.MOD_FILTER BETWEEN 1 AND 50
AND b.MOD_FILTER BETWEEN 1 AND 50;

The selectivity for the filter on MOD_FILTER is 0.5 for both tables. This is because there are 100 unique values for MOD_FILTER between 1 and 100 and each value matches 1% of the table. We can see this by getting an estimated query plan on just TA_1_TO_1000000:

a21_ex2_filter_selectivity

The table has 1 million rows, so the estimate is 500000 = 0.5 * 1000000.

That leaves the join selectivity. We put the same data into both tables:

a21_ex2_same_histograms

We don’t need highlighters to see that the join selectivity is 1.0.

Putting it all together, the cardinality estimate under base containment for this query should be 1000000 * 1.0 * 0.5 * 0.5 = 250000. This is indeed the estimate:

a21_ex2_base_estimate

Of course, this doesn’t match the actual number of rows which is 500000. But it’s easy to change the filter predicates so that the estimated number of rows and the actual number of rows match.

Simple Containment


Simple containment is the assumption that the filter predicates are not independent. The estimate for the join should be obtained by applying the filter selectivities to the join histograms and joining based on the adjusted histograms. The query optimizer uses simple containment within the legacy CE. Simple containment can be used in the new CE via trace flag or USE HINT.

Let’s go back to the same example query:

SELECT *
FROM TA_1_TO_1000000 a
INNER JOIN dbo.TB_1_TO_1000000 b
	ON a.UNIQUE_ID = b.UNIQUE_ID
WHERE a.MOD_FILTER BETWEEN 1 AND 50
AND b.MOD_FILTER BETWEEN 1 AND 50
OPTION (
USE HINT ('ASSUME_JOIN_PREDICATE_DEPENDS_ON_FILTERS')
);

We know that the filter selectivity for both tables is 0.5. How can that be used to adjust the histograms? The simplest method would be to just multiply RANGE_ROWS, EQ_ROWS, and DISTINCT_RANGE_ROWS by the filter selectivity. After doing so we’re left with two still identical histograms:

a21_ex2_simple_histograms

It might seem odd to work with fractions of a row, but as long as everything is rounded at the end why should it matter? With two identical, aligned histograms it seems reasonable to expect a cardinality estimate of 0.5 + 499999 + 0.5 = 500000. This is exactly what we get in SQL Server:

a21_ex2_simple_estimate

The actual row estimate matches the estimated row estimate because the filters are perfectly correlated. Every row left after filtering still has a matching row in the other table.

Just One Filter


What happens if we filter on just a single table? For example:

SELECT *
FROM dbo.TA_1_TO_1000000 a
INNER JOIN dbo.TB_1_TO_1000000 b
	ON a.UNIQUE_ID = b.UNIQUE_ID
WHERE a.MOD_FILTER BETWEEN 1 AND 30;

SELECT *
FROM dbo.TA_1_TO_1000000 a
INNER JOIN dbo.TB_1_TO_1000000 b
	ON a.UNIQUE_ID = b.UNIQUE_ID
WHERE a.MOD_FILTER BETWEEN 1 AND 30
OPTION (
USE HINT ('ASSUME_JOIN_PREDICATE_DEPENDS_ON_FILTERS')
);

For base containment, we know that the filter selectivity is 0.3 and the join selectivity is 1.0. We can expect a cardinality estimate of 1000000 * 1.0 * 0.3 = 300000 rows.

For simple containment we need to multiply the histogram for TA_1_TO_1000000 by 0.3. Here’s what the two histograms look like after factoring in filter selectivity:

a21_ex3_simple_histograms

What should the estimate be? One approach would be to assume that everything matches between the aligned steps. So we end up with 0.3 rows from the step with a RANGE_HI_KEY of 1 and 299999.4 + 0.3 rows from the step with a RANGE_HI_KEY of 1000000. The combined estimate is 300000 rows, which matches the base containment estimate. Why shouldn’t they match? Without filters on both tables there’s no concept of correlation. If it helps you can imagine a filter of 1 = 1 on TB_1_TO_1000000. For base containment multiplying by 1.0 won’t change the estimate and for simple containment multiplying by 1 won’t change the histogram. That just leaves a single filter selectivity of 0.3 for TA_1_TO_1000000 and both estimates should be the same.

For both queries the estimated number of rows in SQL Server is 300000. Our calculations match the SQL Server query optimizer exactly for this query.

Filtering on the Join Column


What happens if we filter on the join columns of both tables? For example:

SELECT *
FROM dbo.TA_1_TO_1000000 a
INNER JOIN dbo.TB_1_TO_1000000 b
	ON a.UNIQUE_ID = b.UNIQUE_ID
WHERE a.UNIQUE_ID BETWEEN 1 AND 200000
AND b.UNIQUE_ID BETWEEN 1 AND 200000;

SELECT *
FROM dbo.TA_1_TO_1000000 a
INNER JOIN dbo.TB_1_TO_1000000 b
	ON a.UNIQUE_ID = b.UNIQUE_ID
WHERE a.UNIQUE_ID BETWEEN 1 AND 200000
AND b.UNIQUE_ID BETWEEN 1 AND 200000
OPTION (
USE HINT ('ASSUME_JOIN_PREDICATE_DEPENDS_ON_FILTERS')
);

Think back to why we need containment in the first place. When there are filters on columns that aren’t the join columns then we need to make an assumption as to how the selectivities all interact with each other. With a filter on the join column we can just adjust the histogram of the join column directly. There isn’t any uncertainty. Here’s what the histograms could look like:

a21_ex4_histograms

In which case, it seems obvious that the final estimate should be 200000 rows. Simple containment does not result in a different estimate here.

Removing Rows


So far the examples have been very simple. We’ve joined tables that contain the exact same data. What if one table has fewer rows than the other table? Consider the following pair of queries:

SELECT *
FROM dbo.TC_1_TO_100000 c
INNER JOIN dbo.TB_1_TO_1000000 b
	ON c.UNIQUE_ID = b.UNIQUE_ID
WHERE c.MOD_FILTER BETWEEN 1 AND 50
AND b.MOD_FILTER BETWEEN 1 AND 50;

SELECT *
FROM dbo.TC_1_TO_100000 c
INNER JOIN dbo.TB_1_TO_1000000 b
	ON c.UNIQUE_ID = b.UNIQUE_ID
WHERE c.MOD_FILTER BETWEEN 1 AND 50
AND b.MOD_FILTER BETWEEN 1 AND 50
OPTION (
USE HINT ('ASSUME_JOIN_PREDICATE_DEPENDS_ON_FILTERS')
);

It’s important to call out here that TC_1_TO_100000 has just 100000 rows instead of one million. For base containment, we know that the selectivity will be 0.5 for both tables. What about join selectivity? The histogram steps of course aren’t aligned:

a21_ex5_initial_histograms

The data is densely packed, so we can use the same trick as before to split the histogram for the larger table:

a21_ex5_base_aligned_histograms

Every row in histogram for the smaller table has a match in the histogram of the larger table. From the point of view of the smaller table the join selectivity is 1.0. Multiplying together all three selectivities gives a final row estimate of 100000 * 1.0 * 0.5 * 0.5 = 25000. This matches the row estimate within SQL Server exactly.

For simple containment we need to apply the filter selectivities of 0.5 to both tables. We also need to align the histograms by splitting the larger histogram. Both will be done in one step:

a21_ex5_simple_histograms

Every row in the smaller histogram once again matches. Our final estimate is 0.5 + 49999 + 0.5 = 50000 which exactly matches the SQL Server query optimizer.

Unmatched Rows


What happens if the tables have the same number of rows but they clearly don’t contain the same data? Consider the following pair of queries:

SELECT *
FROM dbo.TD_500001_TO_1500000 d
INNER JOIN dbo.TB_1_TO_1000000 b
	ON d.UNIQUE_ID = b.UNIQUE_ID
WHERE d.MOD_FILTER BETWEEN 1 AND 50
AND b.MOD_FILTER BETWEEN 1 AND 10;

SELECT *
FROM dbo.TD_500001_TO_1500000 d
INNER JOIN dbo.TB_1_TO_1000000 b
	ON d.UNIQUE_ID = b.UNIQUE_ID
WHERE d.MOD_FILTER BETWEEN 1 AND 50
AND b.MOD_FILTER BETWEEN 1 AND 10
OPTION (
USE HINT ('ASSUME_JOIN_PREDICATE_DEPENDS_ON_FILTERS')
);

The filter predicate for TB_1_TO_1000000 is 0.1 and the filter predicate for TD_500001_TO_1500000 is 0.5. Here are our starting histograms:

a21_ex6_base_initial_histograms

The little man who lives inside the cardinality estimator needs to slice them up so they align. His work is complete:

a21_ex6_base_sliced_histograms

The top histogram has 500000 unmatched rows in the step with a RANGE_HI_KEY of 1500000, so the join selectivity is 500000 / 1000000 = 0.5. Putting all three selectivities together, the cardinality estimate with base containment should be 1000000 * 0.5 * 0.1 * 0.5 = 25000. This exactly matches SQL Server.

You know the drill for simple containment. We need to multiply each sliced histogram by its filter selectivity:

a21_ex6_simple_sliced_histograms

That’s pretty messy. I’m going to assume that every row has a match between the two shared steps, so the estimate should be 0.1 + 49999.8 + 0.1 = 50000. The number of estimated rows reported by SQL Server is 50000.4 :

a21_ex6_simple_estimate

What happened? Did the little man only measure once before cutting? This is one of those examples where there’s other complicated stuff going on under the hood, so the predicted row estimate doesn’t match up exactly. Interestingly, the estimate with the legacy cardinality estimator is exactly 50000.

An Approximate Formula


  • Define T1_CARDINALITY as the number of rows in the first joined table.
  • Define T1_FILTER_SELECTIVITY as the filter selectivity of the filter predicates of the first table. This number ranges from 0.0 to 1.0, with 1.0 for filters that remove no rows.
  • Define T2_CARDINALITY as the number of rows in the second joined table.
  • Define T2_FILTER_SELECTIVITY as the filter selectivity of the filter predicates of the second table. This number ranges from 0.0 to 1.0, with 1.0 for filters that remove no rows.
  • Define JOIN_SELECTIVITY as the selectivity of the two histograms of the joined columns from the point of view of the smaller table. This number ranges from 0.0 to 1.0, with 1.0 meaning that all rows in the smaller table have a match in the larger table.

Based on the tests above, we can model the cardinality estimates for base and simple containment as follows:

Base containment = JOIN_SELECTIVITY * LEAST(T1_CARDINALITY, T2_CARDINALITY) * T1_FILTER_SELECTIVITY * T2_FILTER_SELECTIVITY
Simple containment = JOIN_SELECTIVITY * LEAST(T1_FILTER_SELECTIVITY * T1_CARDINALITY, T2_FILTER_SELECTIVITY * T2_CARDINALITY)

Remember that this isn’t how SQL Server actually does it. However, I think that it shows the difference between base containment and simple containment quite well. For simple containment the filters are applied to the histograms and for base containment all of the selectivities are independent.

A Mathematical Proof?


So far simple containment has always had a higher cardinality estimate than base containment. Looking at the formulas it certainly feels like simple should have a higher estimate. Can we prove that the estimate will always be higher using the above formulas? It’s been quite a few years so I apologize for the proof below, but I believe that it gets the job done.

Definitions:

JS = JOIN_SELECTIVITY
C1 = T1_CARDINALITY
F1 = T1_FILTER_SELECTIVITY
C2 = T2_CARDINALITY
F2 = T2_FILTER_SELECTIVITY

Attempt a proof by contradiction, so assume the opposite of what we want to prove:

JS * LEAST(C1, C2) * F1 * F2 > JS * LEAST(F1 * C1, F2 * C2)

We know that JS > 0, F1 > 0, and F2 > 0, so:

LEAST(C1, C2) > LEAST(C1 / F2, C2 / F1)

The left hand expression can only evalute to C1 or C2. Let’s assume that it evaluates to C1, so C1 <= C2. We know that F1 <= 1, so C2 <= C2 / F1. C1 / F2 > C1, so the only hope of the inequality above being true is if C1 > C2 / F1. Putting it all together:

C1 <= C2 <= C2 / F1 < C1

That is clearly impossible. Very similar logic holds if the left hand expression evaluates to C2 (just flip 1 with c in the above), so we know that the equation that we started out with is not true. Therefore:

JS * LEAST(C1, C2) * F1 * F2 <= JS * LEAST(F1 * C1, F2 * C2)

In other words:

BASE CONTAINMENT <= SIMPLE CONTAINMENT

Here’s my public domain celebration picture:

a21_anniversary-157248_960_720

The details of this stuff within SQL Server are very complicated, so this doesn’t mean that there doesn’t exist a query that has a larger cardinality estimate with base containment. However, it seems to be a safe assumption that in general simple containment will result in a larger or equal estimate compared to base containment.

Why Does Any of This Matter?


I almost created a kind of real life example here, but I ran out of time so you’re eating Zs for dinner again as usual. Let’s introduce a table to cause some trouble:

DROP TABLE IF EXISTS dbo.ROWGOAL_TROUBLES;

CREATE TABLE dbo.ROWGOAL_TROUBLES (
	UNIQUE_EVEN_ID BIGINT NOT NULL,
	PAGE_FILLER VARCHAR(1000) NOT NULL
);

INSERT INTO dbo.ROWGOAL_TROUBLES
	WITH (TABLOCK)
SELECT 2 * t.RN
, REPLICATE('Z', 1000)
FROM
(
	SELECT TOP (50000) ROW_NUMBER()
		OVER (ORDER BY (SELECT NULL)) / 100 RN
	FROM master..spt_values t1
	CROSS JOIN master..spt_values t2
) t
OPTION (MAXDOP 1);

Consider the following business critical query that I run all the time:

SELECT *
FROM dbo.TA_1_TO_1000000 t1
INNER JOIN dbo.TB_1_TO_1000000 t2
	ON t1.UNIQUE_ID = t2.UNIQUE_ID
WHERE t1.MOD_FILTER = 1
AND t2.MOD_FILTER = 1
AND NOT EXISTS (
	SELECT 1
	FROM dbo.ROWGOAL_TROUBLES rt
	WHERE rt.UNIQUE_EVEN_ID = t1.UNIQUE_ID
)
OPTION (MAXDOP 1);

The plan doesn’t look so hot:

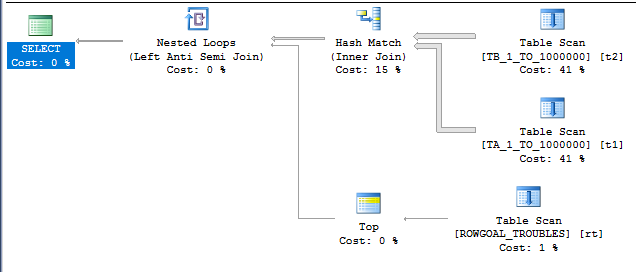
a21_bad_row_goal

There are unmatched rows in the ROWGOAL_TROUBLES table, so we know that the scan on the inner side of the nested loop is going to read a lot of rows. The query took about 60 seconds to finish on my machine and read 499775000 rows from the ROWGOAL_TROUBLES table. Why did this plan seem attractive to SQL Server? The query optimizer thought that only 100 rows would be returned after the join of TA_1_TO_1000000 to TB_1_TO_1000000. The filters are perfectly correlated so 10000 rows will be returned in reality. With perfectly correlated filters we can expect a better estimate if we use simple containment:

SELECT *
FROM dbo.TA_1_TO_1000000 t1
INNER JOIN dbo.TB_1_TO_1000000 t2
	ON t1.UNIQUE_ID = t2.UNIQUE_ID
WHERE t1.MOD_FILTER = 1
AND t2.MOD_FILTER = 1
AND NOT EXISTS (
	SELECT 1
	FROM dbo.ROWGOAL_TROUBLES rt
	WHERE rt.UNIQUE_EVEN_ID = t1.UNIQUE_ID
)
OPTION (
MAXDOP 1,
USE HINT ('ASSUME_JOIN_PREDICATE_DEPENDS_ON_FILTERS')
);

With a better estimate of 10000 rows comes a better query plan:

a21_no_row_goal

The query finishes in under a second on my machine.

Final Thoughts


Hopefully this blog post gives you a better understanding of the difference between base and simple containment. Read some of the other explanations out there if this wasn’t helpful. Containment is a tricky subject and you never know what it’ll take for it to make sense to you.

Thanks for reading!

Going Further


If this is the kind of SQL Server stuff you love learning about, you’ll love my training. I’m offering a 75% discount to my blog readers if you click from here. I’m also available for consulting if you just don’t have time for that and need to solve performance problems quickly.

A Columnstore Compression Magic Trick For SQL Server

Columnstore compression is complicated, and in some cases, surprising.

The Setup


The source data for the CCI has enough rows to fit six perfect rowgroups. The ID column is just sequential integers from 1 to 6291456. The ID2 column is the ID column modulo 20001. Code to load the data into a temp table:

DROP TABLE IF EXISTS #STG_DATA;
CREATE TABLE #STG_DATA (
	ID BIGINT NOT NULL,
	ID2 BIGINT NOT NULL,
	PRIMARY KEY (ID)
);

INSERT INTO #STG_DATA WITH (TABLOCK)
SELECT t.RN, t.RN % 20001
FROM
(
	SELECT TOP (6 * 1048576) ROW_NUMBER()
		OVER (ORDER BY (SELECT NULL)) RN
	FROM master..spt_values t1
	CROSS JOIN master..spt_values t2
) t;

Here’s the table definition for the target CCI:

DROP TABLE IF EXISTS dbo.TARGET_CCI;
CREATE TABLE dbo.TARGET_CCI (
	ID2 BIGINT NOT NULL,
	ID BIGINT NOT NULL,
	INDEX CCI CLUSTERED COLUMNSTORE
);

The reversal of column order is important for the demo below.

Changing MAXDOP


First let’s load the ID2 column the temp table into the CCI. The order of data can matter for compression so I have a superfluous TOP expression to force SQL Server to read the data in clustered key order.

INSERT INTO dbo.TARGET_CCI WITH (TABLOCK)
SELECT TOP (9876543210) ID2, 0
FROM #STG_DATA
ORDER BY ID
OPTION (MAXDOP 1);

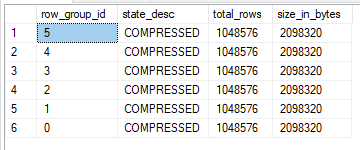
The insert query takes 2765 ms of CPU time and 2771 ms of elapsed time on my machine. According to sys.dm_db_column_store_row_group_physical_stats each rowgroup has a size of 2098320 bytes:

a20_maxdop_1_rg_dmv

Now let’s move on to a parallel insert query with MAXDOP 2. The purpose of the second column in the CCI is to make the insert go parallel on my machine. It’s possible that you’ll need to use trace flag 8649 or some other trick to get a parallel insert. Here’s the code that I ran:

TRUNCATE TABLE dbo.TARGET_CCI;

INSERT INTO dbo.TARGET_CCI WITH (TABLOCK)
SELECT TOP (9876543210) ID2, 0
FROM #STG_DATA
ORDER BY ID
OPTION (MAXDOP 2);

The insert query now takes 3594 ms of CPU time and 2112 ms of elapsed time on my machine. The size of each rowgroup did not change. It’s still 2098320 bytes. Even though this is a parallel query there’s no element of randomness in this case. In the query plan we can see that the source table was scanned in a serial zone and round robin distribution is to used to distribute exactly half of the rows to each parallel thread.

a20_parallel_insert

This seems like a reasonable plan given that TOP forces a serial zone and we need to preserve order. It’s possible to rewrite the query to encourage a parallel scan of the source table, but that would introduce an order-preserving gather streams operator.

I’m not satisfied with the runtime yet, so I’m going to bump up MAXDOP to 3:

TRUNCATE TABLE dbo.TARGET_CCI;

INSERT INTO dbo.TARGET_CCI WITH (TABLOCK)
SELECT TOP (9876543210) ID2, 0
FROM #STG_DATA
ORDER BY ID
OPTION (MAXDOP 3);

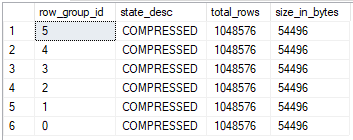
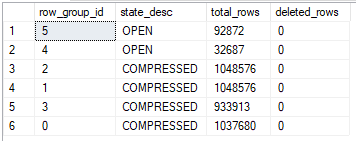
The insert query now takes 114172 ms of CPU time and 39208 ms of elapsed time to execute. However, each rowgroup now is just 54496 bytes.

a20_maxdop_3_rg_dmv

The INSERT took significantly longer than before, but we have 38X better compression compared to the table after the MAXDOP 2 query. What happened?

Revealing the Magic Trick


An interesting pattern for compressed data sizes appears when working with repeated integers for a single rowgroup. The query that I tested with was roughly of the following format:

INSERT INTO dbo.CCI
SELECT t.RN % @MOD_NUM
FROM
(
	SELECT TOP (@ROWS_INSERTED)
		ROW_NUMBER()
		OVER (ORDER BY (SELECT NULL)) RN
	FROM master..spt_values t1
	CROSS JOIN master..spt_values t2
) t;

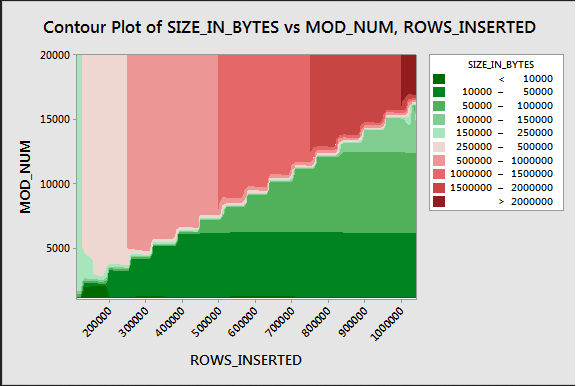
Below is a contour plot that shows how the compressed size for a single rowgroup varies as the number of rows and the modulus value changes:

a20_contour_size

Values that are repeated 64 or more times seem to be compressed much better than other values. This pattern definitely doesn’t always hold as you add more columns to the table which is why I made the ID2 column the first column in the target CCI. Why is this pattern relevant to the previous example?

Consider the MAXDOP 1 insert query. With a full rowgroup of 1048576 rows a value will be repeated at most 1048576/20001 = 53 times in each rowgroup. It doesn’t cross the threshold of 64 so we end up with a compressed size of 2098320 bytes.

Now consider the MAXDOP 2 insert query. The ordered data from the scan is distributed using round robin distribution on two threads. For the first 20001 rows from the scan, thread 0 gets all even values and thread 1 gets all odd values. For the next 20001 rows, thread 0 gets all odd values and thread 1 gets all even values. This occurs because 20001 isn’t divisible by 2. For all six compressed rowgroups we end up with the same data distribution as we had when doing MAXDOP 1 inserts. It makes sense that the compressed size remained at 2098320 bytes.

Now consider the MAXDOP 3 insert query. The query still uses round robin distribution but there are now three threads. 20001 is divisible by 3 so thread 0 only ends up with 6667 unique values from 0, 3, … to 19999. Thread 1 also ends up with 6667 unique values from 1, 4, … to 20000. Thread 2 follows a similar pattern. Each compressed rowgroup only has 6667 unique values instead of 20001. Each value shows up at least 157 times in the rowgroup, so all of the data qualifies for much better compression.

Final Thoughts


This has absolutely no practical value. Thanks for reading!

Going Further


If this is the kind of SQL Server stuff you love learning about, you’ll love my training. I’m offering a 75% discount to my blog readers if you click from here. I’m also available for consulting if you just don’t have time for that and need to solve performance problems quickly.

ROWGROUP_FLUSH Deadlocks In SQL Server Column Store Indexes

We recently observed many ROWGROUP_FLUSH deadlocks while doing concurrent inserts into CCIs. I’m not really a concurrency kind of guy but I figured that I should blog about this just so other people with the same problem can find some information about it.

Deadlock Reproduction


The schedulers of the involved sessions are important in some way, especially when going for a simple reproduction. It’s easiest to just make all new sessions go the same CPU:

ALTER SERVER CONFIGURATION
SET PROCESS AFFINITY CPU = 0;

Obviously you should never do that in production. After affinity has been addressed I recommend creating a nearly empty source table and a new CCI table:

DROP TABLE IF EXISTS dbo.CCI_DEADLOCKED;
CREATE TABLE dbo.CCI_DEADLOCKED (
	COL VARCHAR(1500),
	INDEX CCI CLUSTERED COLUMNSTORE
);

CREATE TABLE ##SOURCE_IDS (ID BIGINT NOT NULL);

INSERT INTO ##SOURCE_IDS WITH (TABLOCK)
SELECT TOP (1048576) ROW_NUMBER()
	OVER (ORDER BY (SELECT NULL))
FROM master..spt_values t1
CROSS JOIN master..spt_values t2
OPTION (MAXDOP 1);

One way to see the deadlock is to quickly kick off two inserts into the CCI_DEADLOCKED table from different sessions. Inserting a larger amount of data means that you’ll have more time to kick off the second session before the first completes, but a longer rollback time on the first session. On my machine inserting 1048576 rows of VARCHAR(1500) data seems like a reasonable compromise:

INSERT INTO dbo.CCI_DEADLOCKED
SELECT REPLICATE('Z', 1500)
FROM ##SOURCE_IDS
OPTION (MAXDOP 1, MAX_GRANT_PERCENT = 0);

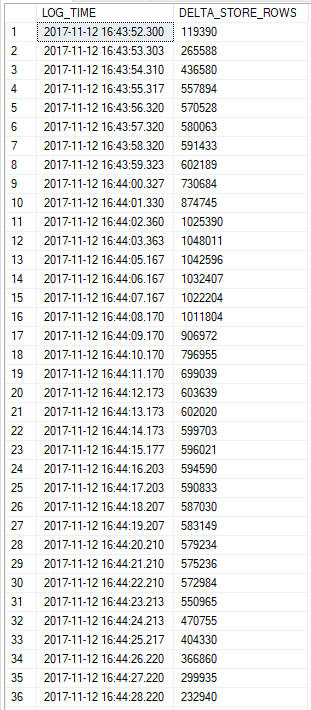
The second session waits on the first with a LCK_M_IX wait event. The first session loads all of its rows into the delta store, then deadlocks and rolls them all back. You can see this happen in near real time by looking at  sys.dm_db_column_store_row_group_physical_stats:

a19_disappearing_delta_store_rows

Here’s the deadlock XML for those who are interested in that kind of thing:


unknown

INSERT INTO dbo.CCI_DEADLOCKED SELECT REPLICATE('Z', 1500) FROM ##SOURCE_IDS OPTION (MAXDOP 1, MAX_GRANT_PERCENT = 0);

unknown

INSERT INTO dbo.CCI_DEADLOCKED SELECT REPLICATE('Z', 1500) FROM ##SOURCE_IDS OPTION (MAXDOP 1, MAX_GRANT_PERCENT = 0);

SSMS can't produce a deadlock graph for this type of deadlock. Below is the non-copy-and-pastable error message from it:

Failed to initialize deadlock control.
There is an error in XML document (1, 2497).
Instance validation error: 'ROWGROUP_FLUSH' is not a valid value for hobtlockSubresource.

Plan Explorer from SentryOne can help us:

a19_deadlock_graph

If you're following along at home don't forget to reset your affinity to whatever you had it before. The most common option:

ALTER SERVER CONFIGURATION
SET PROCESS AFFINITY CPU = AUTO;

The Workarounds


We've only observed this deadlock with multiple concurrent sessions insert to the delta store for the same target CCI due to server memory pressure or very low cardinality estimates (less than 251 rows). The correct mitigation depends on why you're seeing the issue in the first place. If you're seeing it due to low cardinality estimates then fix your estimates, or at the very least get them above 250 rows. If you're seeing them because the memory grant for the CCI build times out after 25 seconds then lower concurrency or increase server memory.

The problem can also be avoided by not doing concurrent inserts in the first place. In some cases a parallel insert may be a reasonable alterative. There's also some evidence that the deadlock is only seen when the number of rows for insert is very close to 1048576, but we weren't able to make any definitive conclusions around that.

Final Thoughts


Don't despair if you run into a ROWGROUP_FLUSH deadlock! There's probably something you can do in the application to avoid it. If you feel that you shouldn't have to take such measures feel free to vote for my connect item here.

Going Further


If this is the kind of SQL Server stuff you love learning about, you'll love my training. I'm offering a 75% discount to my blog readers if you click from here. I'm also available for consulting if you just don't have time for that and need to solve performance problems quickly.

Surprise Delta Stores In SQL Server’s Column Store Indexes

This post contains all of the possible causes for delta store creation that I’ve found. I cannot say with certainty that it’s a complete list, but some of them may be new or unexpected to the reader.

Why Care about Delta Stores?


Microsoft and many others will be quick to tell you that loading data into CCIs is much faster when you can bypass the delta store. In SQL Server 2016 and beyond, delta stores are uncompressed rowstore mini-tables that serve as a temporary holding data until the data can be compressed into columnar format. They’re good when you have a trickle of data to load into a CCI, but bad in all possible ways for a data warehouse workload.

Reviewing the Documentation


I briefly reviewed the documentation written by Microsoft concerning the appearance of delta stores. Here’s a quote:

Rows go to the deltastore when they are:
Inserted with the INSERT INTO VALUES statement.
At the end of a bulk load and they number less than 102,400.
Updated. Each update is implemented as a delete and an insert.

There are also a few mentions of how partitioning can lead to the creation of multiple delta stores from a single insert. It seems as if the document is incomplete or a little misleading, but I admit that I didn’t exhaustively review everything. After all, Microsoft hides columnstore documentation all over the place.

Test Data


The source data for the CCI inserts is fairly uninteresting. I put four rowgroups worth of rows into a rowstore table with a BIGINT column and a randomly generated VARCHAR(16) value.

DROP TABLE IF EXISTS dbo.STAGING_TABLE;

CREATE TABLE dbo.STAGING_TABLE (
	ID BIGINT NOT NULL,
	STR1 VARCHAR(16) NOT NULL,
	PRIMARY KEY (ID)
);

INSERT INTO dbo.STAGING_TABLE WITH (TABLOCK)
SELECT TOP (4 * 1048576)
  ROW_NUMBER() OVER (ORDER BY (SELECT NULL))
, LEFT(CAST(NEWID() AS VARCHAR(36)), 16)
FROM master..spt_values t1
CROSS JOIN master..spt_values t2
OPTION (MAXDOP 1);

The columns for the table definition for the CCI were chosen to cover all of the demos except for the partitioning one. Your fact table definitions probably don’t look like this.

DROP TABLE IF EXISTS dbo.DELTA_STORE_DUMPING_GROUND;
CREATE TABLE dbo.DELTA_STORE_DUMPING_GROUND (
	ID BIGINT NULL,
	STR1 VARCHAR(100) NULL,
	STR2 VARCHAR(100) NULL,
	STR3 VARCHAR(100) NULL,
	STR1_MAX VARCHAR(MAX) NULL,
	INDEX CCI CLUSTERED COLUMNSTORE
);

Not Enough Rows For Bulk Load


The first reason for delta creation is well known and understood on SQL Server 2016. If you insert fewer than 102400 rows then SQL Server will not attempt to skip the delta store. This behavior is by design. The following query does not do a bulk load:

INSERT INTO dbo.DELTA_STORE_DUMPING_GROUND (ID)
SELECT TOP (102399) ID
FROM dbo.STAGING_TABLE
ORDER BY ID
OPTION (MAXDOP 1);

We can see the delta store that was just created with the following query:

SELECT
    row_group_id
  , state_desc
  , total_rows
--, trim_reason_desc
--, deleted_rows
--, partition_number
FROM sys.dm_db_column_store_row_group_physical_stats rg
INNER JOIN sys.tables t ON rg.OBJECT_ID = t.OBJECT_ID
WHERE t.name = 'DELTA_STORE_DUMPING_GROUND';

The results:

a18_dmv_1

The other examples in this post use similar queries to get information about the newly added rowgroups to the table. They will be omitted for brevity. Simply inserting one row results in the delta store getting skipped:

TRUNCATE TABLE dbo.DELTA_STORE_DUMPING_GROUND;

INSERT INTO dbo.DELTA_STORE_DUMPING_GROUND (ID)
SELECT TOP (102400) ID
FROM dbo.STAGING_TABLE
ORDER BY ID
OPTION (MAXDOP 1);

Now the rowgroup is compressed:

a18_dmv_2

The rules change slightly in SQL Server 2017 with support of VARCHAR(MAX) and other LOB columns in columnstore. The delta store can be skipped with an insert of as few as 251 rows. Whether or not you write to the delta store depends on the amount of data being written. Below is one query that still writes to the delta store:

TRUNCATE TABLE dbo.DELTA_STORE_DUMPING_GROUND;

INSERT INTO dbo.DELTA_STORE_DUMPING_GROUND (STR1_MAX)
SELECT TOP (251) REPLICATE(STR1, 40)
FROM dbo.STAGING_TABLE
ORDER BY ID
OPTION (MAXDOP 1);

Once again you can see the delta store:

a18_dmv_3

Things are different if we increase the length of the inserted data. The query below writes to a compressed rowgroup and bypasses the delta store:

TRUNCATE TABLE dbo.DELTA_STORE_DUMPING_GROUND;

INSERT INTO dbo.DELTA_STORE_DUMPING_GROUND (STR1_MAX)
SELECT TOP (251) REPLICATE(STR1, 500)
FROM dbo.STAGING_TABLE
ORDER BY ID
OPTION (MAXDOP 1);

The resulting rowgroup is compressed:

a18_dmv_4

Removing just a single row from the insert brings us back to the delta store.

Inserting to Multiple Partitions


If a MAXDOP 1 INSERT query writes to multiple partitions then it could possibly write to multiple delta stores. The number of rows written to each partition is important as opposed to the total number of rows written to the table. Below I define a simple table with 2 partitions:

CREATE PARTITION FUNCTION CLUNKY_SYNTAX_1
(BIGINT)
AS RANGE LEFT
FOR VALUES (
  0
, 2000000
); 

CREATE PARTITION SCHEME CLUNKY_SYNTAX_2
AS PARTITION CLUNKY_SYNTAX_1
ALL TO ( [PRIMARY] );

DROP TABLE IF EXISTS dbo.PARTITIONED_DELTA_STORE;
CREATE TABLE dbo.PARTITIONED_DELTA_STORE (
ID BIGINT NULL,
INDEX CCI CLUSTERED COLUMNSTORE
) ON CLUNKY_SYNTAX_2 (ID);

The insert writes 200k rows to the CCI which you might expect to bypass the delta store, but since the rows are evenly spread over two partitions we end up with two delta stores:

INSERT INTO dbo.PARTITIONED_DELTA_STORE (ID)
SELECT ID
FROM dbo.STAGING_TABLE
WHERE ID BETWEEN 1900001 AND 2100000
OPTION (MAXDOP 1);

a18_dmv_5

With MAXDOP 8 INSERT queries and the maximum number of partitions defined on a table, it is possible to get 120000 delta stores. I don’t recommend doing this.

Bulk Insert Leftovers


Often applications will not insert an exact multiple of 1048576 rows. That means that rows can be left over after a few rowgroups worth of inserted rows are compressed. Those leftover rows can go into a delta store. Consider the following insert query that inserts 100000 rows more than 1048576:

TRUNCATE TABLE dbo.DELTA_STORE_DUMPING_GROUND;

INSERT INTO dbo.DELTA_STORE_DUMPING_GROUND (ID)
SELECT TOP (1048576 + 100000) ID
FROM dbo.STAGING_TABLE
ORDER BY ID
OPTION (MAXDOP 1);

As expected, the final result is one compressed rowgroup of 1048576 rows and one delta store of 100k rows.

a18_dmv_6

If we inserted just a few thousand more rows than we’d end up with two compressed rowgroups.

Updates


UPDATE queries always write to the delta store. There are many other reasons to avoid UPDATES to CCIs if the application makes it possible to do so.

TRUNCATE TABLE dbo.DELTA_STORE_DUMPING_GROUND;

INSERT INTO dbo.DELTA_STORE_DUMPING_GROUND (ID)
SELECT TOP (1048576) ID
FROM dbo.STAGING_TABLE
ORDER BY ID
OPTION (MAXDOP 1);

At first there’s just a single compressed rowgroup:

a18_dmv_7

Now run the UPDATE query and go make coffee:

UPDATE DELTA_STORE_DUMPING_GROUND
SET ID = ID;

Our table doesn’t look so hot:

a18_dmv_8

In SQL Server 2016 the Tuple Mover will not clean up this table. Another row needs to be inserted into the table before the rowgroup is marked as CLOSED.

Parallel Insert


Many parallel queries have an element of randomess around how rows are distributed to parallel threads. Rows are not moved between threads after they flow to the part of the plan that performs the insert into the CCI. It’s possible to end up with a number of new delta stores equal to the number of parallel threads for the query. Let’s start with a parallel insert that moves 4 * 1048576 rows into the CCI:

TRUNCATE TABLE dbo.DELTA_STORE_DUMPING_GROUND;

INSERT INTO dbo.DELTA_STORE_DUMPING_GROUND
WITH (TABLOCK) (ID)
SELECT ID
FROM dbo.STAGING_TABLE
OPTION (MAXDOP 4);

It’s possible to end up without any delta stores and the results of the query against sys.dm_db_column_store_row_group_physical_stats will vary, but generally you’ll get at least one:

a18_dmv_9

If we have unnaturally high beauty standards for our rowgroups we can rewrite the query to effectively force rows to be evenly distributed on all threads. The query below does this with a join to a derived table:

TRUNCATE TABLE dbo.DELTA_STORE_DUMPING_GROUND;

INSERT INTO dbo.DELTA_STORE_DUMPING_GROUND
WITH (TABLOCK) (ID)
SELECT stg.ID
FROM
(
	VALUES
	(0 * 1048576 + 1, 1 * 1048576),
	(1 * 1048576 + 1, 2 * 1048576),
	(2 * 1048576 + 1, 3 * 1048576),
	(3 * 1048576 + 1, 4 * 1048576)
)
v (start_id, end_id)
INNER JOIN dbo.STAGING_TABLE stg ON
	stg.ID BETWEEN v.start_id and v.end_id
OPTION (MAXDOP 4);

Perfection:

a18_dmv_10

I know that you were looking forward to another image of a tiny table, but here’s the important part of the query plan for those who like that sort of thing:

a18_parallel_query_plan_1

Getting perfect rowgroups can also be accomplished by adding the TOP operator to the original query, but that adds a serial zone to the plan:

TRUNCATE TABLE dbo.DELTA_STORE_DUMPING_GROUND;

INSERT INTO dbo.DELTA_STORE_DUMPING_GROUND
WITH (TABLOCK) (ID)
SELECT TOP (9999999999999999) stg.ID
FROM dbo.STAGING_TABLE stg
OPTION (MAXDOP 4);

The key here is the parallelism operator in the plan uses a round robin method for distributing rows:

a18_parallel_query_plan_2

Dictionary Pressure


In SQL Server 2016 the maximum size for a column dictionary is 16 MB. This limit is raised in SQL Server 2017 for VARCHAR(MAX) and similar columns. I’m not going to get into the details of dictionaries here but it suffices to say that columns with too many unique string columns can experience dictionary pressure. Dictionary pressure leads to compressed rows that are less than the perfect size of 1048576 rows. Let’s insert the STR1 column into the CCI this time:

TRUNCATE TABLE dbo.DELTA_STORE_DUMPING_GROUND;

INSERT INTO dbo.DELTA_STORE_DUMPING_GROUND (STR1)
SELECT TOP (1048576) stg.STR1
FROM dbo.STAGING_TABLE stg
ORDER BY ID
OPTION (MAXDOP 1);

Due to dictionary pressure there’s now a delta store with about 73000 rows:

a18_dmv_11

We can see that the dictionary size for the column is close to the limit with the query below:

SELECT csd.entry_count, csd.on_disk_size
FROM sys.column_store_dictionaries csd
INNER JOIN sys.partitions p
    ON csd.partition_id = p.partition_id
INNER JOIN sys.tables t
    ON p.OBJECT_ID = t.OBJECT_ID
WHERE t.name = 'DELTA_STORE_DUMPING_GROUND'
AND csd.column_id = 2;

Here are the results:

a18_dict

Rowgroup Memory Pressure


The memory grant for CCI compression for an INSERT is calculated based on DOP and column definitions of target columns in the target table. The memory grant can be insufficient to get a full 1048576 rows into a compressed rowgroup depending on the table definition and the characteristics of the data getting loaded into the table. Consider an example in which data is loaded into three columns of the CCI:

TRUNCATE TABLE dbo.DELTA_STORE_DUMPING_GROUND;

INSERT INTO dbo.DELTA_STORE_DUMPING_GROUND
(STR1, STR2, STR3)
SELECT TOP (1048576)
  LEFT(STR1, 10)
, LEFT(STR1, 5)
, LEFT(STR1, 6)
FROM
dbo.STAGING_TABLE stg
ORDER BY ID
OPTION (MAXDOP 1);

With the above syntax the memory grant is calculated from just the STR1, STR2, and STR3 columns. The memory grant of 171152 KB isn’t enough to avoid a delta store:

a18_dmv_12

Note that you may not see the same results on your machine due to the randomness of the source data. For my table and source data set, adding a single column and inserting NULL into it bumps the memory grant up enough to avoid memory pressure:

TRUNCATE TABLE dbo.DELTA_STORE_DUMPING_GROUND;

ALTER TABLE dbo.DELTA_STORE_DUMPING_GROUND
ADD MORE_MEMORY_PLZ VARCHAR(1) NULL;

INSERT INTO dbo.DELTA_STORE_DUMPING_GROUND
(STR1, STR2, STR3, MORE_MEMORY_PLZ)
SELECT TOP (1048576)
  LEFT(STR1, 10)
, LEFT(STR1, 5)
, LEFT(STR1, 6)
, NULL
FROM
dbo.STAGING_TABLE stg
ORDER BY ID
OPTION (MAXDOP 1);

The compressed rowgroup contains 1048576 rows now that memory pressure has been addressed.

a18_dmv_13

Cardinality Estimate Less Than 251 Rows


SQL Server won’t even ask for a memory grant if the cardinality estimate is less than 251 rows. Perhaps this is because the memory grant would be wasted unless at least 102400 rows were inserted into the table. There’s no second chance at a memory grant here, so it’s possible to insert millions of rows to delta stores. A TOP expression with a variable will default to a cardinality estimate of 100 rows, so this works nicely to show the behavior:

TRUNCATE TABLE dbo.DELTA_STORE_DUMPING_GROUND;

DECLARE @top_rows BIGINT = 1048576;
INSERT INTO dbo.DELTA_STORE_DUMPING_GROUND (ID)
SELECT TOP (@top_rows) ID
FROM dbo.STAGING_TABLE
ORDER BY ID
OPTION (MAXDOP 1);

Despite inserting 1048576 rows we aren’t able to bypass the delta store:

a18_dmv_14

The same behavior can be observed with a cardinality estimate of 250 rows. The OPTIMIZE FOR query hint is used to control the estimate.

TRUNCATE TABLE dbo.DELTA_STORE_DUMPING_GROUND;

DECLARE @top_rows BIGINT = 1048576;
INSERT INTO dbo.DELTA_STORE_DUMPING_GROUND (ID)
SELECT TOP (@top_rows) ID
FROM dbo.STAGING_TABLE
ORDER BY ID
OPTION (MAXDOP 1, OPTIMIZE FOR (@top_rows = 250));

However, if I bump up the estimate by one more row a memory grant is given to the query and the delta store is bypassed:

TRUNCATE TABLE dbo.DELTA_STORE_DUMPING_GROUND;

DECLARE @top_rows BIGINT = 1048576;
INSERT INTO dbo.DELTA_STORE_DUMPING_GROUND (ID)
SELECT TOP (@top_rows) ID
FROM dbo.STAGING_TABLE
ORDER BY ID
OPTION (MAXDOP 1, OPTIMIZE FOR (@top_rows = 251));

a18_dmv_15

Under this scenario we’ve observed deadlocks when multiple sessions insert into delta stores from the same target table.

Extreme Server Memory Pressure


Memory grants for queries that insert into CCIs have a hardcoded timeout of 25 seconds. After 25 seconds they execute with required serial memory and always write to the delta store. In the query below I simulate memory pressure with a MAX_GRANT_PERCENT hint of 0:

TRUNCATE TABLE dbo.DELTA_STORE_DUMPING_GROUND;

INSERT INTO dbo.DELTA_STORE_DUMPING_GROUND (ID)
SELECT TOP (1048576) ID
FROM dbo.STAGING_TABLE
ORDER BY ID
OPTION (MAXDOP 1, MAX_GRANT_PERCENT = 0);

The query always writes to the delta store. It cannot compress data without a memory grant.

a18_dmv_15

Under this scenario we’ve observed deadlocks when multiple sessions insert into delta stores from the same target table.

Final Thoughts


It took forever to do the formatting for this one, so I hope that someone finds it useful.

Going Further


If this is the kind of SQL Server stuff you love learning about, you’ll love my training. I’m offering a 75% discount to my blog readers if you click from here. I’m also available for consulting if you just don’t have time for that and need to solve performance problems quickly.

A Row Goal Request For SQL Server

If you don’t know about row goals I strongly recommend reading up on them here. Queries with plans similar to the following may sometimes take longer than expected to finish:

a16_suspicious_query

This can happen even in SQL Server 2017 with very representative statistics and perfect cardinality estimates. This post digs into why these performance degradations can happen and proposes a way to prevent them.

The Test Data


For test data I threw about a million rows into a heap. There are exactly 1000 unique values for the ID column. The table is about 1 GB in size.

DROP TABLE IF EXISTS dbo.BIG_HEAP;

CREATE TABLE dbo.BIG_HEAP (
	ID BIGINT NOT NULL,
	PAGE_FILLER VARCHAR(900) NOT NULL
);

-- table is about 1 GB in size
INSERT INTO dbo.BIG_HEAP WITH (TABLOCK)
SELECT
  RN
, REPLICATE ('Z', 900)
FROM
(
	SELECT TOP (1000000)
		ROW_NUMBER()
		OVER (ORDER BY (SELECT NULL)) % 1000 RN
	FROM master..spt_values t1
	CROSS JOIN master..spt_values t2

	UNION ALL

	SELECT TOP (1000) 0 RN
	FROM master..spt_values t1
	CROSS JOIN master..spt_values t2
) t
OPTION (MAXDOP 1);

CREATE STATISTICS S ON dbo.BIG_HEAP (ID)
WITH FULLSCAN, NORECOMPUTE;

The histogram isn’t as compact as it theoretically could be, but I would say that it represents the data very well:

a16_rowstore_histogram

Through the histogram it’s easy to see that there are 1000 distinct values for the ID column. There are 2000 rows with an ID of 0 and 1000 rows for IDs between 1 and 999.

The data is evenly distributed on disk. This behavior isn’t guaranteed because we’re inserting into a heap, but what counts is that it remains true during the testing period. We can get the first row with any ID in the table by reading 1000 rows or fewer from the heap. Below are a few examples:

-- rows read from table = 1
SELECT TOP (1) ID
FROM dbo.BIG_HEAP
WHERE ID = 1;

-- rows read from table = 500
SELECT TOP (1) ID
FROM dbo.BIG_HEAP
WHERE ID = 500;

-- rows read from table = 999
SELECT TOP (1) ID
FROM dbo.BIG_HEAP
WHERE ID = 999;

-- rows read from table = 1000
SELECT TOP (1) ID
FROM dbo.BIG_HEAP
WHERE ID = 0;

Approximate Formula for Scan Costing with a Row Goal


After some investigation I was able to come up with an approximate formula for the cost of a scan with a row goal applied to it. The formula has rounding and other issues but it illustrates the general behavior quite well. Here it is:

scan cost in optimizer units = 0.0031895 + LEAST(1, ROW_GOAL / CARDINALITY_ESTIMATE) * (FULL_SCAN_COST – 0.0031895)

I assume that the 0.0031895 constant is there to represent the minimum amount of work required to read a single row from a table. The ROW_GOAL parameter will just be the number of rows limited by TOP in our example queries. The CARDINALITY_ESTIMATE parameter is the number of rows estimated to be returned by SQL Server if there was no row goal. The FULL_SCAN_COST parameter is the cost in optimizer units of a single scan that reads all of the rows from the table. For BIG_HEAP this has a value of 93.7888.

SQL Server assumes that rows are evenly distributed in the table when reducing the cost of the scan. It’s certainly possible to take issue with that assumption, but this blog post does not go in that direction. In fact, I loaded the data into BIG_HEAP in such a way so that assumption would be largely true. The basic idea behind the formula is that if there are two matching rows in a table and a query needs to get just one of them, then on average the query optimizer thinks that half of the rows will need to be read from the table.

Let’s start with a few simple examples. If a row goal exceeds the total number of rows in a table then we shouldn’t expect it to change the cost of a scan. For this query:

SELECT TOP (7654321) ID
FROM dbo.BIG_HEAP;

The formula simplifies to 0.0031895 + (1) * (93.7888 - 0.0031895) = 93.7888 units which is exactly the cost of the scan.

Consider a query that selects the first row without any filtering:

SELECT TOP (1) ID
FROM dbo.BIG_HEAP;

The ROW_GOAL is 1 and the CARDINALITY_ESTIMATE is the number of rows in the table, 1001000. The formula gives a cost of 0.0031895 + (1 / 1001000) * (93.7888 - 0.0031895) = 0.00328319191 units which is fairly close to the actual cost of 0.0032831 units.

The formula also works for the classic SELECT TOP (0) query. The query below does not contain a scan of the heap so it could be said that the cost of the scan is 0 units.

SELECT TOP (0) ID
FROM dbo.BIG_HEAP;

For a less trivial example consider the following query:

SELECT TOP (3) ID
FROM dbo.BIG_HEAP
WHERE ID = 1;

The ROW_GOAL is 3 and the CARDINALITY_ESTIMATE is 1000. The formula gives a cost of 0.0031895 + (3 / 1000) * (93.7888 - 0.0031895) = 0.2845463315 units. The scan cost reported by SQL Server is 0.284546 units.

Consider the following query:

SELECT TOP (1) ID
FROM dbo.BIG_HEAP
WHERE ID = 0;

The ROW_GOAL is 1 and the CARDINALITY_ESTIMATE is 2000. The formula gives a cost of 0.0031895 + (1 / 2000) * (93.7888 - 0.0031895) = 0.05008230525 units. The scan cost reported by SQL Server is 0.0500822 units.

An estimate based on density gives what you might expect. Consider the following query:

DECLARE @var BIGINT = 1;
SELECT TOP (1) ID
FROM dbo.BIG_HEAP
WHERE ID = @var
OPTION (MAXDOP 1);

Here the cardinality estimate will be 1001 rows. The formula gives a cost of 0.0031895 + (1 / 1001) * (93.7888 - 0.0031895) = 0.09688141858 units. The scan cost reported by SQL Server is 0.0968814 units.

Approximate Formula for Join Scan Costing with a Row Goal


The truly interesting part is how the scan cost changes due to a row goal when it’s on the inner side of a nested loop join. To model the cost we need to make a few changes to the above formula. First we need a way to approximate the cost of each successive scan. Let’s create a small, single column table:

CREATE TABLE dbo.SMALL_TABLE (
	ID BIGINT NOT NULL
);

CREATE STATISTICS S ON dbo.SMALL_TABLE (ID);

For cross joins, the cost increases at a linear rate of 46.382 optimizer units per execution of the scan. It’s not clear to me where this number comes from. I assume SQL Server discounts each scan after the first because some of the data will be in the buffer cache. I tested this by throwing a few rows into SMALL_TABLE and getting an estimated plan for the following query:

SELECT *
FROM dbo.SMALL_TABLE s
CROSS JOIN dbo.BIG_HEAP b
OPTION (NO_PERFORMANCE_SPOOL, FORCE ORDER);

With 1 row the cost was 93.7888 units, with 2 rows the cost was 140.17 units, with 3 rows the cost was 186.552 units, and so on. We can use the formula from before to try to approximate the cost. The first scan has a cost according to the following (same as before):

0.0031895 + LEAST(1, ROW_GOAL / CARDINALITY_ESTIMATE) * (FULL_SCAN_COST – 0.0031895)

Each successive scan has a cost according to the following:

0.0031895 + LEAST(1, ROW_GOAL / CARDINALITY_ESTIMATE) * (REDUCED_FULL_SCAN_COST – 0.0031895)

This isn’t as accurate as it is for a single scan without a join. There’s a missing piece that I wasn’t able to find. However, it works well enough to later illustrate the problem with costing.

Let’s reset SMALL_TABLE and insert five rows:

TRUNCATE TABLE dbo.SMALL_TABLE;

INSERT INTO dbo.SMALL_TABLE VALUES (500);
INSERT INTO dbo.SMALL_TABLE VALUES (501);
INSERT INTO dbo.SMALL_TABLE VALUES (502);
INSERT INTO dbo.SMALL_TABLE VALUES (503);
INSERT INTO dbo.SMALL_TABLE VALUES (504);

UPDATE STATISTICS SMALL_TABLE S WITH FULLSCAN;

Here is the query that we’ll be testing with for the next few tests:

SELECT *
FROM dbo.SMALL_TABLE s
WHERE NOT EXISTS
(
	SELECT 1
	FROM dbo.BIG_HEAP b
	WHERE s.ID = b.ID
);

The plan has a final cardinality estimate of a single row and looks like this:

a16_scan_1_row_ce

Using the previous formulas we could expect the cost of the scan to be 0.0031895 + (1 / 1000) * (93.7888 - 0.0031895) + 4 * (0.0031895 + (1 / 1000) * (46.382 - 0.0031895)) = 0.2952483525. The actual cost is 0.294842 units so it’s kind of close.

If we change one of the values to 0 we should expect a slight reduction in cost because SQL Server might think that it needs to scan fewer rows to find a row with an ID of 0.

TRUNCATE TABLE dbo.SMALL_TABLE;

INSERT INTO dbo.SMALL_TABLE VALUES (0);
INSERT INTO dbo.SMALL_TABLE VALUES (501);
INSERT INTO dbo.SMALL_TABLE VALUES (502);
INSERT INTO dbo.SMALL_TABLE VALUES (503);
INSERT INTO dbo.SMALL_TABLE VALUES (504);

UPDATE STATISTICS SMALL_TABLE S WITH FULLSCAN;

This does not happen. The cost remains the same as before: 0.294842 units. This is because the scan is costed according to density instead of by looking at the histogram of the outer table. The following query with a local variable repeated five times also has a cost of 0.294842 optimizer units:

DECLARE @var BIGINT = 1;
SELECT *
FROM (
VALUES (@var), (@var), (@var), (@var), (@var)
) s (ID)
WHERE NOT EXISTS
(
	SELECT 1
	FROM dbo.BIG_HEAP b
	WHERE s.ID = b.ID
)
OPTION (NO_PERFORMANCE_SPOOL);

The problem with using density instead of looking at the data in the outer table is mostly apparent when the outer table contains rows without a match in the inner table. Consider the following data:

TRUNCATE TABLE dbo.SMALL_TABLE;

INSERT INTO dbo.SMALL_TABLE VALUES (-1);
INSERT INTO dbo.SMALL_TABLE VALUES (-2);
INSERT INTO dbo.SMALL_TABLE VALUES (-3);
INSERT INTO dbo.SMALL_TABLE VALUES (-4);
INSERT INTO dbo.SMALL_TABLE VALUES (-5);

UPDATE STATISTICS SMALL_TABLE S WITH FULLSCAN;

The query has a final cardinality estimate of five rows which is different than before. However, it still costs the scan as 0.294842 units. This is a problem. We know that SQL Server will need to read the entire table for each row that is returned to the client. For this query 5005000 rows are read from the heap.

The Request


The cost reduction for the row goal feels too aggressive with an anti join. If even a single row is output from the join that means that all of the rows were scanned from the table for that row. Is that really better than a hash join? The query optimizer is already doing the work of estimating how many rows will be output from the join. Even using the density of matched rows and assuming full scans for unmatched rows may be a significant improvement over the current model of always using density. This would also be more consistent with the costing of individual scans.

The Good


The optimizer is using density to calculate the cost of the scan, so it’s reasonable to think that we’ll get an efficient plan if SMALL_TABLE contains rows that mostly exist in BIG_HEAP. For integers between 1 and 1000 only one row will be returned to the client with an ID of 1000.

TRUNCATE TABLE dbo.SMALL_TABLE;

INSERT INTO dbo.SMALL_TABLE WITH (TABLOCK)
SELECT TOP (1000)
	ROW_NUMBER()
	OVER (ORDER BY (SELECT NULL))
FROM master..spt_values t1
CROSS JOIN master..spt_values t2

UPDATE STATISTICS SMALL_TABLE S WITH FULLSCAN;

We continue to test with this query:

SELECT *
FROM dbo.SMALL_TABLE s
WHERE NOT EXISTS
(
	SELECT 1
	FROM dbo.BIG_HEAP b
	WHERE s.ID = b.ID
)
OPTION (MAXDOP 1);

This query gets a nested loop anti join with a TOP operator:

a16_good_query

It finishes in less than a second on my machine. About 1.5 million rows in total are read from the heap which is no problem:

a16_good_rows_read

The Bad


Performance changes pretty drastically if we put rows into SMALL_TABLE that don’t have a match in BIG_HEAP. As explained earlier, each row returned to the client requires a full scan of the BIG_HEAP table. Consider the following data set for SMALL_TABLE:

TRUNCATE TABLE dbo.SMALL_TABLE;

INSERT INTO dbo.SMALL_TABLE WITH (TABLOCK)
SELECT TOP (1000)
	- 1 * ROW_NUMBER()
	OVER (ORDER BY (SELECT NULL))
FROM master..spt_values t1
CROSS JOIN master..spt_values t2

UPDATE STATISTICS SMALL_TABLE S WITH FULLSCAN;

Once again we’re using the same query:

SELECT *
FROM dbo.SMALL_TABLE s
WHERE NOT EXISTS
(
	SELECT 1
	FROM dbo.BIG_HEAP b
	WHERE s.ID = b.ID
) OPTION (MAXDOP 1);

All 1000 rows will be returned to the client, so one billion rows will be read from the BIG_HEAP table. This is indeed what happens and the query takes around 2 minutes to complete on my machine. It’s important to note that SQL Server calculates the correct final cardinality estimate of 1000 rows:

a16_bad_plan

The query optimizer already does the work to figure out that there won’t be any rows returned from the BIG_HEAP table. It would be helpful if it used this knowledge to cost the scan of BIG_HEAP more accurately. The cost of the scan is 0.294842 optimizer units which obviously does not reflect reality.

If a cached scan that reads all of the rows from the table has a cost of around 46.382 units then it seems reasonable to expect that the cost of 1000 scans will be at least 46382 optimizer units, even with the row goal applied. That cost would result in a hash join or some other plan being naturally chosen by the optimizer. Forcing a hash join has an overall cost of 100.393 optimizer units but the query finishes in under one second.

Until we get better costing in this area, one workaround is to use trace flag 4138 or the DISABLE_OPTIMIZER_ROWGOAL use hint.

The Ugly


We can also see performance issues with CCIs. Below I insert 100 million rows into a CCI with roughly the same data distribution as the BIG_HEAP table. This took a few minutes on my machine.

DROP TABLE IF EXISTS dbo.CCI_ROW_GOAL;

CREATE TABLE dbo.CCI_ROW_GOAL (
	ID BIGINT NOT NULL,
	INDEX CCI CLUSTERED COLUMNSTORE
);

INSERT INTO dbo.CCI_ROW_GOAL WITH (TABLOCK)
SELECT TOP (100000000)
	ROW_NUMBER()
	OVER (ORDER BY (SELECT NULL)) % 1000 RN
FROM master..spt_values t1
CROSS JOIN master..spt_values t2
CROSS JOIN master..spt_values t3
OPTION (MAXDOP 1);

CREATE STATISTICS S ON dbo.CCI_ROW_GOAL (ID)
WITH FULLSCAN, NORECOMPUTE;

Once again I would say that the histogram represents the data well. You can take my word for it. Just to make sure that SMALL_TABLE has the right data we’ll reset it:

TRUNCATE TABLE dbo.SMALL_TABLE;

INSERT INTO dbo.SMALL_TABLE WITH (TABLOCK)
SELECT TOP (1000)
	- 1 * ROW_NUMBER()
	OVER (ORDER BY (SELECT NULL))
FROM master..spt_values t1
CROSS JOIN master..spt_values t2

UPDATE STATISTICS SMALL_TABLE S WITH FULLSCAN;

The query below is very familiar but we’ll start by forcing a hash join. The overall query cost is 0.126718 optimizer units and it finishes in less than a second.

SELECT *
FROM dbo.SMALL_TABLE s
WHERE NOT EXISTS
(
	SELECT 1
	FROM dbo.CCI_ROW_GOAL b
	WHERE s.ID = b.ID
) OPTION (MAXDOP 1, HASH JOIN);

I wouldn’t describe the plan as interesting:

a16_boring_CCI plan

The plan changes if the HASH JOIN hint is removed:

a16_bad_cci_plan

This is a very alarming plan. It has an overall cost of 2.00464 optimizer units, but the scan is in row mode instead of batch mode. For the query to complete it will need to read about 100 billion rows from the CCI in row mode. On my machine I let it run for a little while and it looked like the query would take around 3.5 hours to complete.

Once again the optimizer expects that all 1000 rows from SMALL_TABLE will be returned to the client. The inefficient plan could be avoided with more sophisticated costing for the row goal applied to the CCI scan.

Going Further


If this is the kind of SQL Server stuff you love learning about, you’ll love my training. I’m offering a 75% discount to my blog readers if you click from here. I’m also available for consulting if you just don’t have time for that and need to solve performance problems quickly.

An Adaptive Join Regression In SQL Server

Adaptive joins are a new feature in SQL Server 2017. For adaptive join operators the decision to do a hash or loop join is deferred until enough input rows are counted. You can get an introduction on the topic in this blog post by Joe Sack. Dmitry Pilugin has an excellent post digging into the internals. The rest of this blog post assumes that you know the basics of adaptive joins.

Getting an Adaptive Join


It’s pretty easy to create a query that has an adaptive join in SQL Server 2017. Below I create a CCI with 100k rows and an indexed rowstore table with 400k rows:

DROP TABLE IF EXISTS dbo.MY_FIRST_CCI;

CREATE TABLE dbo.MY_FIRST_CCI (
	FILTER_ID_1 INT NOT NULL,
	FILTER_ID_2 INT NOT NULL,
	FILTER_ID_3 INT NOT NULL,
	JOIN_ID INT NOT NULL,
	INDEX CI CLUSTERED COLUMNSTORE
);

INSERT INTO dbo.MY_FIRST_CCI WITH (TABLOCK)
SELECT TOP (100000)
  t.RN
, t.RN
, t.RN
, t.RN
FROM
(
	SELECT ROW_NUMBER() OVER (ORDER BY (SELECT NULL)) RN
	FROM master..spt_values t1
	CROSS JOIN master..spt_values t2
) t
OPTION (MAXDOP 1);

ALTER TABLE dbo.MY_FIRST_CCI REBUILD WITH (MAXDOP = 1);

CREATE STATISTICS S1 ON dbo.MY_FIRST_CCI (FILTER_ID_1)
WITH FULLSCAN;
CREATE STATISTICS S2 ON dbo.MY_FIRST_CCI (FILTER_ID_2)
WITH FULLSCAN;
CREATE STATISTICS S3 ON dbo.MY_FIRST_CCI (FILTER_ID_3)
WITH FULLSCAN;
CREATE STATISTICS S4 ON dbo.MY_FIRST_CCI (JOIN_ID)
WITH FULLSCAN;

DROP TABLE If exists dbo.SEEK_ME;

CREATE TABLE dbo.SEEK_ME (
	JOIN_ID INT NOT NULL,
	PADDING VARCHAR(2000) NOT NULL,
	PRIMARY KEY (JOIN_ID)
);

INSERT INTO dbo.SEEK_ME WITH (TABLOCK)
SELECT TOP (400000)
  ROW_NUMBER() OVER (ORDER BY (SELECT NULL))
, REPLICATE('Z', 2000)
FROM master..spt_values t1
CROSS JOIN master..spt_values t2

CREATE STATISTICS S1 ON dbo.SEEK_ME (JOIN_ID)
WITH FULLSCAN;

The full scan stats are just there to show that there isn’t any funny business with the stats. The below query gets an adaptive join:

SELECT *
FROM dbo.MY_FIRST_CCI o
INNER JOIN dbo.SEEK_ME i ON o.JOIN_ID = i.JOIN_ID

It’s obvious when it happens in SSMS:

a16_sample_adaptive_join

It’s possible to get an adaptive join with even simpler table definitions. I created the tables this way because they’ll be used for the rest of this post.

Adaptive Threshold Rows


Unlike some other vendors, Microsoft was nice enough to expose the adaptive row threshold in SSMS when looking at estimated or actual plans:

a16_threshold

The adaptive join saves input rows to a temporary structure and acts as a blocking operator until it makes a decision about which type of join to use. In this example, if there are less than 80388.3 rows then the adaptive join will execute as a nested loop join. Otherwise it’ll execute as a hash join.

The adaptive threshold row count can change quite a bit based on the input cardinality estimate. It changes to 22680 rows if I add the following filter that results in a single row cardinality estimate:

WHERE o.FILTER_ID_1 = 1

It was surprising to me to see so much variance for this query. There must be some overhead with doing the adaptive join but I wouldn’t expect the tipping point between a loop and hash join to change so dramatically. I would expect it to be close to a traditional tipping point calculated without adaptive joins.

Traditional Tipping Point


Let’s disable adaptive joins using the 'DISABLE_BATCH_MODE_ADAPTIVE_JOINS' USE HINT and consider how an execution plan would look for this query:

SELECT *
FROM dbo.MY_FIRST_CCI o
INNER JOIN dbo.SEEK_ME i ON o.JOIN_ID = i.JOIN_ID
WHERE o.FILTER_ID_1 BETWEEN @start AND @end
OPTION (
RECOMPILE,
USE HINT('DISABLE_BATCH_MODE_ADAPTIVE_JOINS')
);

We should expect a hash join if the local variables don’t filter out as many rows. Conversely, we should expect a loop join if the local variables on FILTER_ID_1 filter out many rows from the table. There’s a tipping point where the plan will change from a hash join to a loop join if we filter out a single additional row . On my machine, the tipping point is between 48295 and 48296 rows:

a16_fixed_tipping_point.PNG

The estimated costs for the two queries are very close to each other: 74.6842 and 74.6839 optimizer units. However, we saw earlier that the tipping point for an adaptive join on this query can vary between 22680 and 80388.3 rows. This inconsistency means that we can find a query that performs worse with adaptive joins enabled.

The Regression


After some trial and error I found the following query:

SELECT *
FROM dbo.MY_FIRST_CCI o
INNER JOIN dbo.SEEK_ME i ON o.JOIN_ID = i.JOIN_ID
WHERE o.FILTER_ID_1 BETWEEN 1 AND 28000
AND o.FILTER_ID_2 BETWEEN 1 AND 28000
AND o.FILTER_ID_3 BETWEEN 1 AND 28000
ORDER BY (SELECT NULL)
	OFFSET 100001 ROWS FETCH NEXT 1 ROW ONLY
OPTION (MAXDOP 1);

The ORDER BY stuff isn’t important. It’s there just to not send any rows over the network. Here’s the plan:

a16_regression

The query has a cardinality estimate of 10777.7 rows coming out of the MY_FIRST_CCI table. The adaptive join has a tipping point of 27611.6 rows. However, I’ve constructed the table and the filter such that 28000 rows will be sent to the join. SQL Server expects a loop join, but it will instead do a hash join because 28000 > 27611.6. With a warm cache the query takes almost half a second:

CPU time = 469 ms, elapsed time = 481 ms.

If I disable adaptive joins, the query finishes in less than a fifth of a second:

CPU time = 172 ms, elapsed time = 192 ms.

A loop join is a better choice here, but the adaptive row threshold makes the adaptive join pick a hash join.

Final Thoughts


This post contains only a single test query, so it’s no cause for panic. It’s curious that Microsoft made the adaptive join tipping so dependent on cardinality estimates going into the join. I’m unable to figure out the design motivation for doing that. I would expect the other side of the join to be much more important.

Thanks for reading!

Going Further


If this is the kind of SQL Server stuff you love learning about, you’ll love my training. I’m offering a 75% discount to my blog readers if you click from here. I’m also available for consulting if you just don’t have time for that and need to solve performance problems quickly.

A Serial Parallel Query In SQL Server

Sometimes parallel queries perform poorly due to bad luck. The parallel page supplier may distribute rows in a way that’s not optimal for performance. The hashing function used by SQL Server to split rows into threads may assign too many rows to a single thread. You may have seen some of these situations in production queries, but they can be hard to reproduce because they may depend on a lot of different factors including the complete data in some of the involved tables. This blog post demonstrates a technique to create demos that show how parallel thread imbalance can lead to poor performance.

Mapping Hash Partition Destination Threads


This work is inspired by a recent blog post at sql.sasquatch by my friend and colleague @sqL_handLe. For a given data type and DOP it appears that the same hashing function and thread boundaries are always applied, although I haven’t confirmed that. In other words, if an INT of value 1 in a parallel MAXDOP 4 query gets hashed to thread 2 in a query, then it may also get hashed to thread 2 from a different table in a different query. In other words, it appears to be possible to figure out ahead of time where different values will be hashed to. That means that it’s possible to construct a data set with very poor thread balance.

To create the mapping we need to construct a data set that makes it easy to tell which value gets sent to which thread. I inserted 20 distinct values into a table with each value having a row count equal to a different power of 2. Sample code to do this:

DROP TABLE IF EXISTS dbo.FIND_HASH_VALUES;

CREATE TABLE dbo.FIND_HASH_VALUES (
ID INT NOT NULL
);

DECLARE @start_num INT = 0;

INSERT INTO dbo.FIND_HASH_VALUES WITH (TABLOCK)
SELECT t.n
FROM
(
	SELECT v.n + @start_num AS n
	, ROW_NUMBER() OVER (ORDER BY v.n) RN
	FROM (
	VALUES
	  (1), (2), (3), (4), (5)
	, (6), (7), (8), (9), (10)
	, (11), (12), (13), (14), (15)
	, (16), (17), (18), (19), (20)
	) v(n)
) t
CROSS APPLY (
	SELECT TOP (POWER(2, -1 + t.RN)) 1 dummy
	FROM master..spt_values t1
	CROSS JOIN master..spt_values t2
) ca
OPTION (MAXDOP 1);

The above code runs in about a second on my machine. To see which value goes to which thread I need a query with a repartition streams operator that has the hash partitioning type. One way to get this is with window functions. The following query naturally goes parallel on my machine and has the operator that I’m looking for:

SELECT TOP 1
  ID
, COUNT(*) OVER (PARTITION BY ID) CNT
FROM FIND_HASH_VALUES
OPTION (MAXDOP 4);

The TOP 1 isn’t essential. It’s there to limit the size of the result set. The query finishes quickly and rows are sent to all four threads:

a15_threads

Decoding which value went to which thread can be done in SQL Server using the & operator. The query below finds the thread number for the 20 distinct values in the table:

DECLARE
@start_num INT = 0,
@thread1 INT = 61440,
@thread2 INT = 330245,
@thread3 INT = 240,
@thread4 INT = 656650;

SELECT t.ID
, cast(@thread1 & t.bit_comp as bit)
+ 2 * cast(@thread2 & t.bit_comp as bit)
+ 3 * cast(@thread3 & t.bit_comp as bit)
+ 4 * cast(@thread4 & t.bit_comp as bit) AS THREAD
FROM
(
	SELECT v.n + @start_num AS ID
	, POWER(2, -1 + ROW_NUMBER()
		OVER (ORDER BY v.n)) bit_comp
	FROM (
	VALUES
	  (1), (2), (3), (4), (5)
	, (6), (7), (8), (9), (10)
	, (11), (12), (13), (14), (15)
	, (16), (17), (18), (19), (20)
	) v(n)
) t;

Here’s the result set:

a15_bitmap_results

Getting the mapping for other ranges of IDs is as simple as changing the variables for both queries. I put the first 100 values on pastebin in case it’s useful for someone.

The Data Set


For demo purposes I want a table that contains values that will always hash to the same thread at MAXDOP 4. You can find 25 values that hash to the same thread in the pastebin. In the table below I insert 100k rows for each unique value that goes to thread 1:.

DROP TABLE IF EXISTS dbo.SKEWED_DATA;

CREATE TABLE dbo.SKEWED_DATA (
ID INT NOT NULL,
FILLER VARCHAR(50)
);

INSERT INTO dbo.SKEWED_DATA WITH (TABLOCK)
SELECT t.n, 'Lamak'
FROM
(
	SELECT v.n
	FROM (
	VALUES
	  (13), (14), (15), (16)
	, (30), (31), (32), (33)
	, (46), (47), (48), (49), (50)
	, (63), (64), (65), (66)
	, (80), (81), (82), (83)
	, (97), (98), (99), (100)
	) v(n)
) t
CROSS APPLY (
	SELECT TOP (100000) 1 dummy
	FROM master..spt_values t1
	CROSS JOIN master..spt_values t2
) ca
OPTION (MAXDOP 1);

CREATE STATISTICS S ON dbo.SKEWED_DATA (ID) WITH FULLSCAN;

The Query


The business requirement of the day is to take the first 2.5 million rows from the SKEWED_DATA table, calculate the row number partitioned by ID, and to return all rows with a row number greater than 100k. The query will never return any results based on how data was inserted into the table. Here is one way to express such a query:

SELECT ID, FILLER
FROM
(
	SELECT
	  ID
	, FILLER
	, ROW_NUMBER() OVER (PARTITION BY ID
		ORDER BY (SELECT NULL)) RN
	FROM
	(
		SELECT TOP (2500000)
		    ID
		  , FILLER
		FROM dbo.SKEWED_DATA
	) t
) t2
WHERE t2.RN > 100000
OPTION (MAXDOP 4);

The query runs at MAXDOP 4 but does not benefit from parallelism at all. All of the rows are sent to the same thread:

a15_terrible_parallel_query

The sort spills to tempdb because the memory grant for the sort is split evenly across all four threads. Threads 2-4 don’t get any rows so 75% of the memory grant is wasted:

a15_memory

I ran the query five times and it executed in an average of 2816 ms. CPU time was generally pretty close to the elapsed time. This is a very bad example of a parallel query.

Lowering DOP


The query above is designed to not be able to take advantage of parallelism. The useless repartition streams step and the spill to tempdb suggest that the query might perform better with a MAXDOP 1 hint. With a MAXDOP 1 hint the query runs with an average time of 2473 ms. There is no longer a spill to tempdb.

What happens if the query is run with MAXDOP 3? Earlier I said that the hashing function or thread boundaries can change based on DOP. With MAXDOP 3 I get a much more even row distribution on threads:

a15_good_threads

The better distribution of rows means that the spill to tempdb does not happen either:

a15_good_memory

The query definitely seems like it could benefit from parallelism. After five runs it had an average execution time of 1563 ms, almost a 50% improvement over the MAXDOP 4 query. The ratio of CPU time to elapsed time is also much more in line with what we might expect from a good parallel query:

CPU time = 3219 ms, elapsed time = 1574 ms.

Final Thoughts


It was fun to construct a query that runs faster when MAXDOP is lowered from 4 to 3. Hopefully the details were interesting in of themselves.

Thanks for reading!

Going Further


If this is the kind of SQL Server stuff you love learning about, you’ll love my training. I’m offering a 75% discount to my blog readers if you click from here. I’m also available for consulting if you just don’t have time for that and need to solve performance problems quickly.

Hash Partitioned Exchange Spills In SQL Server

This blog post contains a few demos for generating hash partitioned exchange spills. It does not attempt to explain why performance is so bad in some cases, but I think that the behavior here is simply interesting to observe. Note that all of the demos were done on SQL Server 2016 SP1 CU4. Some of this may not be reproducible on other versions.

Order Preserving Streams


First I need to say a few words about repartition and gather streams operators. Here’s an example of one:

a14_operator

These operators are easy to misunderstand. Even when they have an “order by” they do not directly do a sort in the traditional sense. Instead, they rely on the ordered input threads to produce 1 or more ordered output threads. There’s no memory grant associated with them. For an illustration of how this could work, consider a very simple example with 4 rows on two threads:

a14_order_preserving

After the first step, values 1 and 2 from thread 1 are processed. There is a switch to thread 2 that moves 3, 4, and 5, and so on. This all explained in a much better way by Paul White in his talk on parallelism at the 2013 PASS Summit:

What is an Exchange Spill?


As usual, the good stuff is hidden in extended event descriptions:

Occurs when the memory communication buffers for a query with multiple Parallelism operators become full, resulting in one of the operators writing to TempDB. If this happens multiple times in a single query plan the query performance is impacted. Use this event in conjunction with any of the *_showplan events to determine which operation in the generated plan is causing the exchange spill using the node_id field

According to Paul White, one way to get a deadlock is when the buffers are full but there aren’t any rows on one of the threads. There is a brilliant demo that involves partitioning by round robin near the end of the talk that starts here:

This blog post focuses on deadlocks that occur with hash partitioning.

The Test Query


Only one table is needed to see exchange spills caused by hash partitioning. The first column stores the ID used for the join and the second column is used to pad out the pages. The clustered index isn’t a primary key to allow for duplicate values. Table definition:

DROP TABLE IF EXISTS DEADLOCK;

CREATE TABLE DEADLOCK (
	ID BIGINT NOT NULL,
	FLUFF VARCHAR(100)
);

CREATE CLUSTERED INDEX CI__DEADLOCK ON DEADLOCK (ID);

The query that I’ll run forces a parallel merge join with varying MAXDOP:

SELECT t1.ID
FROM DEADLOCK t1
WHERE EXISTS (
       SELECT 1
       FROM DEADLOCK t2
       WHERE t1.ID = t2.ID
)
ORDER BY t1.ID
OPTION (QUERYTRACEON 8649, MERGE JOIN, MAXDOP 2);

With this query, we can force an order preserving repartition streams to be hashed against a column with as few distinct values as we like. Note that there is an element of chance to this. For some data distributions a deadlock may not always occur. The performance of the same query can vary to an extreme degree as well.

Getting a Deadlock


One way to see a deadlock is by putting 50k rows into the table with four distinct values for ID:

TRUNCATE TABLE DEADLOCK;

INSERT INTO DEADLOCK WITH (TABLOCK)
SELECT
  (RN - 1) / 12500
, REPLICATE('Z', 100)
FROM (
       SELECT TOP (50000) ROW_NUMBER()
		OVER (ORDER BY (SELECT NULL)) RN
       FROM master..spt_values t1
       CROSS JOIN master..spt_values t2
	   CROSS JOIN master..spt_values t3
) t
OPTION (MAXDOP 1);

UPDATE STATISTICS DEADLOCK CI__DEADLOCK WITH FULLSCAN;

Running the SELECT query from before with MAXDOP 2 seems to pretty reliably produce a deadlock. The query typically takes around 7 seconds to run at first but it usually finishes much quicker after the deadlock checker has woken up. The deadlock can be seen with the exchange_spill extended event or by the tempdb spill in the repartition streams operator:

a14_deadlock

Putting the Dead in Deadlock


Some queries have extremely variable performance. They can run for seconds, minutes, hours, or even longer than a day. They can eventually be killed by the deadlock monitor. I had one such query running for longer than 24 hours, but apparently Microsoft got embarrassed and killed SSMS:

a14_SSMS

There are many ways to see this behavior. Inserting alternating 0s and 1s seems to do the trick:

TRUNCATE TABLE DEADLOCK;

INSERT INTO DEADLOCK WITH (TABLOCK)
SELECT
  RN % 2
, REPLICATE('Z', 100)
FROM (
       SELECT TOP (100000) ROW_NUMBER()
		OVER (ORDER BY (SELECT NULL)) RN
       FROM master..spt_values t1
       CROSS JOIN master..spt_values t2
	   CROSS JOIN master..spt_values t3
) t
OPTION (MAXDOP 1);

UPDATE STATISTICS DEADLOCK CI__DEADLOCK WITH FULLSCAN;

The first 49000 rows or so are displayed fairly consistently in SSMS. After that the query slows to a crawl. It only used 140 ms of CPU time after five minutes of execution. I wasn’t able to get this query to finish on my machine, but other similar queries finished after many hours. The data in sys.dm_exec_query_profiles is interesting:

a14_dmv

Assuming a packet size of 4500 rows, the scan at node id 8 is just one packet away from finishing. Thread 1 for the repartition streams is finished along with thread 1 of the merge join. All 50k rows with a value of 0 have been processed by the merge join but only 49898 rows made it to the gather streams at the end of the plan. I’ve seen this kind of behavior with the performance issue that affects some parallel queries with a TOP operator.

All six rows from sys.dm_os_waiting_tasks have a wait type of CXPACKET. There are resource descriptions of WaitType=e_waitPortClose. Ultimately, it’s not clear to me why this query appears to run “forever”, but one way or another it should eventually finish.

Final Thoughts


The same behavior can be seen in 2017 RC2. I couldn’t get either of the two example queries to finish on that version. Some of my test cases don’t cause deadlocks in 2016 SP1 CU2. It appears that Microsoft has done work in this area with negative consequences for some data distributions. A theory for why this happens can be found here. Microsoft appears to have fixed this in 2016 SP1 CU6.

Thanks for reading!

Going Further


If this is the kind of SQL Server stuff you love learning about, you’ll love my training. I’m offering a 75% discount to my blog readers if you click from here. I’m also available for consulting if you just don’t have time for that and need to solve performance problems quickly.