Steps For Getting Rid Of NOLOCK Hints In SQL Server Queries

Way Out


Whenever I see people using NOLOCK hints, I try to point out that they’re not a great idea, for various reasons explained in detail all across the internet.

At minimum, I want them to understand that the hint name is the same as setting the entire transaction isolation level to READ UNCOMMITTED, and that the hint name is quite misleading. It doesn’t mean your query takes no locks, it means your query ignores locks taken by other queries.

That’s how you can end up getting incorrect results.

That warning often comes with a lot of questions about how to fix blocking problems so you can get rid of those hints.

After all, if you get rid of them, your SQL Server queries will (most likely) go back to using the READ COMMITTED isolation level and we all know that read committed is a garbage isolation level, anyway.

Cause and Wrecked


An important thing to understand is why the hint was used in the first place. I’ve worked with some nice developers who slapped it on every query just in case.

There was no blocking or deadlocking. They just always used it, and never stopped.

Not that I blame them; the blocking that can occur under read committed the garbage isolation level is plain stupid, and no respectable database platform should use it as a default.

In many ways, it’s easier for a user to re-run a query and hopefully get the right result and shrug and mumble something about computers being awful, which is also true.

So, first step: ask yourself if there was ever really a blocking problem to begin with.

Bing Tutsby


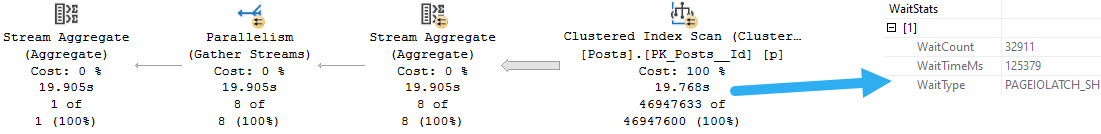
Next, we need to understand where the blocking was coming from. Under read committed the garbage isolation level, writers can block readers, and readers can block writers.

In most cases though, people have added the hint to all of their queries, even ones that never participated in blocking.

  • If the problem was writers blocking writers, no isolation can help you.
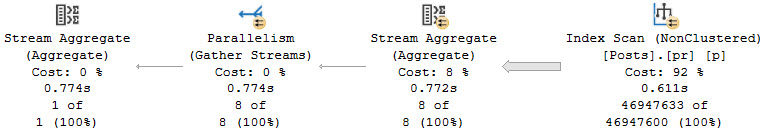
  • If the problem was readers blocking writers, you may need to look at long running queries with Key Lookups

If the problem was writers blocking readers, you’d have to look at a few things:

If you have query store enabled, you can use sp_QuickieStore to search it for queries that do a lot of writes. If you don’t, you can use sp_BlitzCache to search the plan cache for them.

Best Case


Of course, you can avoid all of these problems, except for writers blocking writers, by using an optimistic isolation level like Read Committed Snapshot Isolation or Snapshot Isolation.

In the past, people made a lot of fuss about turning these on, because

  • You may not have tempdb configured correctly
  • You have queue type code that relied on blocking for correctness

But in reasonably new versions of SQL Server, tempdb’s setup is part of the install process, and the wacky trace flags you used to have to turn on are the default behavior.

If you do have code in your application that processes queues and relies on locking to correctly process them, you’re better off using locking hints in that code, and using an optimistic isolation level for the rest of your queries. This may also be true of triggers that are used to enforce referential integrity, which would need READCOMMITTEDLOCK hints.

The reason why they’re a much better choice than using uncommitted isolation levels is because rather than get a bunch of dirty reads from in-flight changes, you read the last known good version of the row before a modification started.

This may not be perfect, but it will prevent the absolute majority of your blocking headaches. It will even prevent deadlocks between readers and writers.

No, Lock


If your code has a lot of either NOLOCK hints or READ UNCOMITTED usage, you should absolutely be worried about incorrect results.

There are much better ways to deal with blocking, and I’ve outlined some of them in this post.

Thanks for reading!

Going Further


If this is the kind of SQL Server stuff you love learning about, you’ll love my training. I’m offering a 75% discount to my blog readers if you click from here. I’m also available for consulting if you just don’t have time for that and need to solve performance problems quickly.

Signs It’s Time To Switch From ORMs To Stored Procedures In SQL Server Development

Meet Wall


There are, unfortunately, some times when developers refuse to put the ORM down.

I mean, it’s mostly unfortunate for them, because they’ll continue to have performance problems.

Me? I’ll be okay.

The items in this post are issues I’ve run into constantly when working with people who use ORMs, but don’t spend any time looking at the queries they generate.

I expect this list to grow. Heck, maybe it’ll even get some good comments that I can add to the list.

I know, I know. Good comments.

Unreasonable


Here’s the stuff I see quite frequently causing issues with ORM code, in no particular order, and they’re quite often signs that you’d be better off with a stored procedure.

1. Your select list doesn’t fit in the cached plan

Developers using ORMs often have to learn the hard way that when they poke an object, all the columns come out. Not only does the lesson seem hard to learn, the behavior seems hard to change. I’ve worked with people months and years apart and found the same bad habits over and over again, and this isn’t an exception. Not only can this hurt query performance for a number of reasons, but it also makes reproducing any issues really difficult because you can’t get the full query text easily.

2. Your queries generates long IN lists

It’s bad enough that most ORMs don’t deal gracefully with  this by parameterizing the IN clause values. Even if you do parameterize them all, SQL Server might have different ideas about how best to apply that IN clause. Scroll down to the “Complexity” section in this blog post. You can get wildly different plans depending on how many search arguments you pass in. This is one of those times where a table valued parameter, temp table, or other materialization of the list is a way better idea.

3. You don’t understand the query it generates

Because you-know-who, did you-know-what, with you-know-who, but let’s keep that between me and you isn’t a good way to send queries to SQL Server. The number of far overly-complicated queries that generate unrecognizable logic that I’ve seen have, at this point, probably generated physical weight in the world beyond mere electrons. The 20 lines of code you wrote to explain what you want have turned into a 200 line query full of derived left joins to every single imaginable relation in the database. Why? I don’t know. You don’t know either.

4. You can’t get a good query plan

You see that paragraph up there? That’s why you can’t get a good query plan. The optimizer spent a reasonable amount of time assessing all of the crazy semantic needs of your query and came up with a reasonable plan as quickly as possible. But somewhere along the line, it misjudged something, or didn’t have time to explore that one last join reordering that would have made everything okay. Or maybe, like a query that generates a long IN clause, this monster would benefit from breaking the million-layer-dip of logic up by dumping some initial results into a #temp table.

5. You can’t get developers to fully parameterize queries

When you write queries that take parameters, whether it’s a stored procedure or dynamic SQL, you get better plan re-use. When you throw literal values into the mix, the optimizer is far less charitable, and will treat each query like it has never seen it before and go about compiling a brand new execution plan for it. Even if you turn on Forced Parameterization, your semi-parameterized queries won’t be parameterized. And of course, Optimize For Ad Hoc Workloads won’t help once the plan moves beyond stub-status.

Move On


There are many ways to tune a query, but unfortunately a good portion of them are unavailable while using ORMs in their natural code-only state. Sure, you can write custom queries in the code, but that has a lot of potential downsides, too. Depending on how the code is constructed, and if parameters are strongly typed, you may not get consistent plan re-use.

I’m all for application developers using tooling that enables them to work on new features quickly and in a way that they’re comfortable with. But at some point, SQL developers or DBAs need to step in and enforce coding standards. At some point, mom and dad have to the keys away and implement something that performs beyond just what “works”.

Thanks for reading!

Going Further


If this is the kind of SQL Server stuff you love learning about, you’ll love my training. I’m offering a 75% discount to my blog readers if you click from here. I’m also available for consulting if you just don’t have time for that and need to solve performance problems quickly.

Why Single Key Column Indexes Aren’t Good Choices

Choose To Lose


Most tables you encounter in SQL Server will have a clustered row store index on them, and probably some nonclustered row store indexes too.

If you live in the data warehouse world, you’ll probably see more and more column store indexes (hopefully), and if you need to report straight from your OLTP tables, you might even see some nonclustered column store indexes.

If your non-staging tables are heaps, you’ve probably got other things you should be doing than reading this post, like figuring out a good clustered index for them.

But anyway! Let’s focus on the most common types of tables, so that most everyone can happily follow along.

Drown Out


When you’ve got a table with a row store clustered index, all of your nonclustered indexes will “inherit” the keys of the clustered index. Where they end up depends on if the nonclustered index is defined as unique or not.

  • Non unique nonclustered row store indexes will store them in the key
  • Unique nonclustered row store indexes will store them as includes

There are times when a single key column index can be useful, like for a unique constraint.

But for the most part, outside of the occasional super-critical query that needs to be tuned, single key column indexes either get used in super-confusing ways, or don’t get used at all and just sit around hurting your buffer pool and transaction log, and increasing the likelihood of lock escalation.

Expansive


I can hear a lot of you saying that you use them to help foreign keys, and while a single key column index may get used for those processes, you most likely have many other queries that join tables with foreign key relationships together.

Those queries aren’t gonna sit around with just join columns. You’re gonna select, filter, group, and order those columns too, and wider indexes are gonna be way more helpful for that, and wider indexes are just as useful for helping foreign keys do their job.

If you have a single key column index, and a wider index that leads with the same key column, you really need to ask yourself why you have that single key column index around anymore.

In extreme cases, I see people create a single key column index on every column in a table. That’s beyond absurd, and a recipe for disaster in all of the ways listed above.

If you truly need an index on every single column, then you need a column store index.

Thanks for reading!

Going Further


If this is the kind of SQL Server stuff you love learning about, you’ll love my training. I’m offering a 75% discount to my blog readers if you click from here. I’m also available for consulting if you just don’t have time for that and need to solve performance problems quickly.

I/O Bound vs CPU Bound Queries In SQL Server

Handcuffed


When you’re looking for queries to tune, it’s important to understand which part is causing the slowdown.

That’s why Actual Execution plans are so valuable in newer versions of SQL Server and SSMS. Getting to see operator timing and wait stats for a query can tell you a lot about what kind of problem you’re facing.

Let’s take a look at some examples.

Diskord


If you’re looking at a query plan, and all the time is spent way to the right, when you’re reading from indexes, it’s usually a sign of one or two things:

  • You’re missing a good index for the query
  • You don’t have enough memory to cache data relevant to the query

If you run the query a second time, and it has the same characteristics — meaning we should now have the data cached in the buffer pool but we don’t — then one or both of those two things is true.

If you run the query a second time and it’s fast because all the data we care about is cached, then it’s more likely that only the second thing is true.

SQL Server Query Plan
wasabi

For example, every time I run this query it takes 20 seconds because every time it has to read the clustered index from disk into memory to get a count. That’s because my VM has 96 GB of RAM, and the clustered index of the Posts table is about 120 GB. I can’t fit the whole thing into the buffer pool, so each time I run this query has the gas station sushi effect on the buffer pool.

If I add a nonclustered index — and keep in mind I don’t really condone adding single key column nonclustered indexes like this — the query finishes much faster, because the smaller nonclustered index takes less time to read, and it fits into the buffer pool.

CREATE INDEX pr ON dbo.Posts
(
    Id
);
SQL Server Query Plan
birthday

If our query had different characteristics, like a where clause, join, group by, order by, or windowing function, I’d consider all of those things for the index definition. Just grabbing a count can still benefit from a smaller index, but there’s nothing relational that we need to account for here.

Proc Rock


Let’s say you already have ideal indexes for a query, but it’s still slow. Then what?

There are lots of possible reasons, but we’re going to examine what a CPU bound query looks like. A good example is one that needs to process a lot of rows, though not necessarily return a lot of rows, like a count or other aggregate.

SQL Server Query Plan
splish splash

While this query runs, CPUs are pegged like suburban husbands.

SQL Server Query Plan
in the middle of the street

For queries of this stature, inducing batch mode is often the most logical choice. Why? Because CPU instructions are run over batches of rows at once, rather than a single row at a time.

With a small number of rows — like in an OLTP workload — you probably won’t notice any real gains. But for this query that takes many millions of rows and produces an aggregate, it’s Hammer Time™

SQL Server Query Plan
known as such

Rather than ~30 seconds, we can get our query down to ~8 seconds without making a single other change to the indexes or written form.

Under Compression


For truly large data sets, compression indexes is a great choice for further reducing I/O bound portions of queries. In SQL Server, you have row, page, and column store (clustered and nonclustered) compression available to you based on the type of workload you’re running.

When you’re tuning a query, it’s important to keep the type of bottleneck you’re facing in mind. If you don’t, you can end up trying to solve the wrong problem and getting nowhere.

Thanks for reading!

Going Further


If this is the kind of SQL Server stuff you love learning about, you’ll love my training. I’m offering a 75% discount to my blog readers if you click from here. I’m also available for consulting if you just don’t have time for that and need to solve performance problems quickly.

Forced Parameterization vs Optimize For Ad Hoc Workloads

Shredded Cheese


I often speak with people who are confused about what these settings do, and which one they should be using to fix certain problems.

The first myth is that Optimize For Ad Hoc Workloads has some special effect on queries run outside of stored procedures: it does not. It’s very poorly named in that regard. There are no special optimizations applied because of that setting.

If you hit up the documentation, there’s no mention of it, but because it’s named how it is, people think YEAH IT’LL MAKE MY AD HOC QUERIES FASTER!

But no. It does not.

Add Chalk


Optimize For Ad Hoc Workloads mainly helps servers where the plan cache is unstable because it gets full of plans that don’t ever get reused. You end up with a lot of churn.

Why don’t they get reused? There are a lot of reasons, but often it’s because queries either aren’t parameterized, or because parameters aren’t explicitly defined in the application.

When you turn Optimize For Ad Hoc Workloads on, first-time plans are stored as stubs. That’s all. If they get used a second time, the full plan is stored.

This is great, unless all your plans have a low rate of reuse anyway, like < 10 or so.

Paramesan Cheese


First, the documentation for Forced Parameterization is hard to find.

Second, it’s usually a *wonderful* setting for queries that are fully unparameterized. One of the limitations is that if a query is only partially parameterized, it won’t parameterize the unparameterized bits.

That kinda sucks, but I understand why it doesn’t: Microsoft thinks you’re smart and you know what you’re doing, and there must be a *very good reason* for you to only have partially parameterized a query.

For instance, to get a filtered index used, or to avoid some parameter sniffing issue with skewed data.

Which One Do You Need?


Focus on the problem you’re trying to solve.

  • If you have a lot of single use plans clogging up your plan cache and forcing a lot of churn, then Optimize For Ad Hoc Workloads can be great
  • If you have a lot of unparameterized queries creating loads of duplicate plans (maybe even single use), you want Forced Parameterization

Thanks for reading!

Going Further


If this is the kind of SQL Server stuff you love learning about, you’ll love my training. I’m offering a 75% discount to my blog readers if you click from here. I’m also available for consulting if you just don’t have time for that and need to solve performance problems quickly.

Replication Deadlocks In SQL Server, And How To Fix Them

As If


Replication is one of my least favorite things, and I go out of my way not to deal with it. I have had a few clients now that have run into problems with deadlocks arising from it doing Replication-y things.

If you use Plan Explorer to look at deadlocks, which you should because SSMS sucks at it, you’ll see stuff that looks like this:

i am deadlock

You’ll see deadlocks on things like LockMatchID, sys.sp_MSrepl_changestatus, and sp_MSrepl_addsubscription.

i am deadlock

You may also see weird looking ones like this on sp_addsubscription.

i am also deadlock

If you see deadlocks that involved Database Id 32767, and a negative object ID like -993696157, it’s going to be some weird replication stuff. That’s the Id of the Resource Database, which you can’t really get at without the DAC, or copying and attaching the files for it as a user database.

i too am deadlock

You may also see deadlocks on things like sp_replupdatechema coming from mssqlsystemresource.

Fixing It


The official line from Microsoft Support is that you can usually fix the deadlocks by running these commands:

EXEC sp_changepublication
  @publication = N'yourpublication',
  @property = N'allow_anonymous',
  @value = N'false';
GO

EXEC sp_changepublication
  @publication = N'yourpublication',
  @property = N'immediate_sync',
  @value = N'false';
GO

In practice, the clients I’ve had do this have had their Replication Deadlocks resolved. Hopefully if you’re hitting the same problems, you’ll find them useful.

Thanks for reading!

Going Further


If this is the kind of SQL Server stuff you love learning about, you’ll love my training. I’m offering a 75% discount to my blog readers if you click from here. I’m also available for consulting if you just don’t have time for that and need to solve performance problems quickly.

Index Key Columns And Data Access Patterns In SQL Server

Financial Advice


When I talk about “data access patterns” in relation to databases, it’s often met with blank stares.

What is a data access pattern? What does it have to do with indexes?

Well, my dear friend, today you’re gonna learn it good and hard.

Medical Doctor


Data access patterns refer to the most common ways that queries filter, join, order, and display data.

The earliest point of a data access pattern is your where clause. Different queries may have different patterns of data to look for.

Giving some generic OLTP-ish examples, you might have queries that look for:

  • Customer orders
    • Within a date range
    • Ordered by most recent
  • Items in a customer order
    • With the total price
    • Plus shipping
    • Plus tax
  • Items in stock
    • Total quantity

Depending on how normalized your data is, getting some of this stuff will likely require 2-3 tables getting joins together in some manner.

But all of these different scenarios define your data access patterns, and this is how you need to gear your indexes.

A lot of people get caught up on the minutiae of indexes without taking care of any of the basics, worrying about foreign keys, GUIDs, fragmentation, and other ridiculous memes.

Personal Trainer


Your data access patterns should define your indexes, because that — along with well-written queries to use those indexes most efficiently — is what’s going to make your application fast.

I’ve blogged about some of the fundamental concepts behind this in the past:

If you still need help with your index design after reading those, drop me a line! That’s the kind of thing I love helping people out with.

Thanks for reading!

Going Further


If this is the kind of SQL Server stuff you love learning about, you’ll love my training. I’m offering a 75% discount to my blog readers if you click from here. I’m also available for consulting if you just don’t have time for that and need to solve performance problems quickly.

The Academics Behind FROID

I am a heading


If you’re curious about all the stuff behind FROID, I’d highly suggest checking out this video by Andy Pavlo (b|t). It’s a great talk based on the academic material written about it, and made quite approachable and understandable even if you don’t understand all those fancy symbols that math people tell me are really numbers.


If you like this video, I’d highly suggest following Andy’s classes on YouTube. While they’re pretty database agnostic, they’re still awesome to watch to get a better understanding of how and why databases work, and do what they do. And there are some hot beats, to boot.

Thanks for reading!

Going Further


If this is the kind of SQL Server stuff you love learning about, you’ll love my training. I’m offering a 75% discount to my blog readers if you click from here. I’m also available for consulting if you just don’t have time for that and need to solve performance problems quickly.

Trace Flag 3608 Disables Automatic Statistics Creation And Ghost Record Cleanup In SQL Server

Short Bad


According to the docs:

Prevents SQL Server from automatically starting and recovering any database except the master database. If activities that require TempDB are initiated, then model is recovered and TempDB is created. Other databases will be started and recovered when accessed. Some features, such as snapshot isolation and read committed snapshot, might not work. Use for Move System Databases and Move User Databases.

Note: Do not use during normal operation.

Scope: global only

But it turns out it can do quite a bit of harm. It seems that many things stop working when it’s in use, though, including statistics getting automatically created.

Here’s a repro script:

DROP TABLE IF EXISTS
    dbo.stats_test,
    dbo.stats_test_3608;


CREATE TABLE dbo.stats_test
(
    id int NOT NULL
);
GO 

INSERT
    dbo.stats_test
(
    id
)
VALUES
(
    0
);
GO

SELECT 
    st.* 
FROM dbo.stats_test AS st 
WHERE st.id = 1;
GO 

DBCC TRACEON(3608, -1);
GO 

CREATE TABLE dbo.stats_test_3608
(
    id int NOT NULL
);
GO 

INSERT
    dbo.stats_test_3608
(
    id
)
VALUES
(
    0
);
GO

SELECT 
    st.* 
FROM dbo.stats_test AS st 
WHERE st.id = 1;
GO 

DBCC TRACEOFF(3608, -1);
GO

And here are the results:

end times

End Times


This post comes from finding the trace flag enabled at a client site, and nearly every query plan having warnings about columns with missing statistics.

Sometimes this happens when statistics exist for a single column, but multi-column statistics don’t.

In this case, disabling the trace flag fixed things.

Ghost Busters


Even forcing ghost record cleanup won’t work with this trace flag on.

DBCC TRACEOFF(3608, -1);
GO 

INSERT 
    dbo.stats_test WITH(TABLOCK)
(
    id
)
SELECT
    m.message_id
FROM sys.messages AS m;
GO 

DELETE dbo.stats_test;
GO 

DBCC FORCEGHOSTCLEANUP;
GO 

SELECT
    record_count,
    ghost_record_count,
    version_ghost_record_count
FROM sys.dm_db_index_physical_stats
(
    DB_ID(), 
    OBJECT_ID('stats_test'), 
    0, 
    0, 
    'DETAILED'
);
GO 

DBCC TRACEON(3608, -1);
GO 

INSERT 
    dbo.stats_test_3608 WITH(TABLOCK)
(
    id
)
SELECT
    m.message_id
FROM sys.messages AS m;
GO 

DELETE dbo.stats_test_3608;
GO 

DBCC FORCEGHOSTCLEANUP;
GO 

SELECT
    record_count,
    ghost_record_count,
    version_ghost_record_count
FROM sys.dm_db_index_physical_stats
(
    DB_ID(), 
    OBJECT_ID('stats_test_3608'), 
    0, 
    0, 
    'DETAILED'
);
GO 

DBCC TRACEOFF(3608, -1);
GO
better off without you

Turn Off


So, uh, if you see this enabled anywhere, you should disable it.

Thanks for reading!

Going Further


If this is the kind of SQL Server stuff you love learning about, you’ll love my training. I’m offering a 75% discount to my blog readers if you click from here. I’m also available for consulting if you just don’t have time for that and need to solve performance problems quickly.

Things SQL Server vNext Should Address: Make Dynamic SQL Easily Traceable

An Attempt


One tricky thing about working with dynamic SQL is that it’s rather unaccountable. You have a stored procedure, you build up a string, you execute it, and no one wants to claim responsibility.

Like a secret agent, or an ugly baby.

It would be nice if sp_executesql had an additional parameter to assign an object id to the code block so that when you’re looking at the plan cache or Query Store, you know immediately where the query came from.

Here’s an example.

A Contempt


Let’s use this as an example:

CREATE OR ALTER PROCEDURE dbo.dynamo
AS
SET NOCOUNT, XACT_ABORT ON;
BEGIN

    DECLARE
        @sql nvarchar(MAX) = N'';
    
    SELECT TOP (1)
        b.*
    FROM dbo.Badges AS b
    WHERE b.UserId = 22656
    ORDER BY b.Date DESC

    SELECT
        @sql = N'    
    /*dbo.dynamo*/
    SELECT
        c = COUNT_BIG(*)
    FROM dbo.Users AS u
    JOIN dbo.Posts AS p
        ON p.OwnerUserId = u.Id;    
        ';
    
    EXEC sys.sp_executesql
        @sql;
    
END;
GO

This is, by all accounts, Properly Written Dynamic SQL™

I know, this doesn’t need to be dynamic SQL, but I don’t need a great example of that to show what I mean. The first query is there to get the procedure to show up anywhere, and the dynamic SQL is there to show you that… dynamic SQL doesn’t show up as associated with the procedure that called it.

If we execute the procedure, and then look for the details of it in Query Store, all we get back it the first query.

EXEC dbo.dynamo;
GO 

EXEC sp_QuickieStore
    @database_name = 'StackOverflow2013',
    @procedure_schema = 'dbo',
    @procedure_name = 'dynamo';
GO
twenty minutes

It sure would be nice to know that this procedure executed a whole other query.

A Temp


There’s no great workaround for this, but you can at least get a hint that something else happened if you dump the dynamic SQL results into a temp table.

CREATE OR ALTER PROCEDURE dbo.dynamo_insert
AS
SET NOCOUNT, XACT_ABORT ON;
BEGIN

    DECLARE
        @sql nvarchar(MAX) = N'';

    CREATE TABLE
        #results
    (
        c bigint
    );
    
    SELECT TOP (1)
        b.*
    FROM dbo.Badges AS b
    WHERE b.UserId = 22656
    ORDER BY b.Date DESC

    SELECT
        @sql = N'    
    /*dbo.dynamo*/
    SELECT
        c = COUNT_BIG(*)
    FROM dbo.Users AS u
    JOIN dbo.Posts AS p
        ON p.OwnerUserId = u.Id;    
        ';
    
    INSERT
        #results WITH(TABLOCK)
    (
        c
    )    
    EXEC sys.sp_executesql
        @sql;

    SELECT
        r.*
    FROM #results AS r
    
END;
GO

This still sucks though, because we don’t know what the dynamic portion of the query did.

one catch

The query plan looks like this, with no real details or metrics:

break room

A Fix


It would be super if sp_executesql took an additional parameter in the context of a stored procedure that could be assigned to a @@PROCID.

EXEC sys.sp_executesql
    @sql,
    @object_id = @@PROCID;

This would avoid all the headless dynamic SQL horsemen running around, and make it easier to locate procedure statements by searching for the procedure that executes them, rather than having to search a bunch of SQL text for a commented procedure name.

Sure, it’s fine if you stumble across dynamic SQL with a comment pointing to the procedure that runs it, but I hardly see anyone doing that.

Thanks for reading!

Going Further


If this is the kind of SQL Server stuff you love learning about, you’ll love my training. I’m offering a 75% discount to my blog readers if you click from here. I’m also available for consulting if you just don’t have time for that and need to solve performance problems quickly.