Make It Out
I’m going to show you something bizarre. I’m going to show it to you because I care for your well-being and long term mental health.
Someday you’ll run into this and be thoroughly baffled, and I want to be here for you. Waiting, watching, lubricating.
I have a stored procedure. It’s a wonderful stored procedure.
But something funny happens when a parameter gets sniffed.
Wrote A Little Song About It
It’s not the usual parameter sniffing thing, where you get different plans and blah blah blah. That’s dull.
This is even more infuriating. Here’s the part where care about, where we read data to insert into the #temp table.

This is the “small” version of the plan. It only moves about 8200 rows.
Now here’s the “big” version of the plan.

We move way more rows out of the seek (9.8 million), but doesn’t it seem weird that a seek would take 5.6 seconds?
I think so.
Pay special attention here, because both queries aggregate the result down to one row, and the insert to the #temp table is instant both times.
Wanna Hear It?
Let’s do what most good parameter sniffing problem solvers do, and re-run the procedure after recompiling for the “big” value.

It’s the exact same darn plan.
Normally, when you’re dealing with parameter sniffing, and you recompile a procedure, you get a different plan for different values.
Not here though. Yes, it’s faster, but it’s the same operators. Seek, Compute, Stream, Stream, Compute, Insert 1 row.
Important to note here is that the two stream aggregates take around the same about of time as before too.
The real speed up was in the Seek.
How do you make a Seek faster?
YOU NEEK UP ON IT.
Three Days Later
I just woke up from beating myself with a hammer. Sorry about what I wrote before. That wasn’t funny.
But okay, really, what happened? Why is one Seek 4 seconds faster than another seek?
Locking.
All queries do it, and we can prove that’s what’s going on here by adding a locking hint to our select query.
Now, I understand why NOLOCK would set your DBA in-crowd friends off, and how TABLOCK would be an affront to all sense and reason for a select.
So how about a PAGLOCK hint? That’s somewhere in the middle.

The Seek that took 5.6 seconds is down to 2.2 seconds.
And all this time people told you hints were bad and evil, eh?
YTHO?
It’s pretty simple, once you talk it out.
All queries take locks (even NOLOCK/READ UNCOMMITTED queries).
Lock escalation doesn’t usually happen with them though, because locks don’t accumulate with read queries the way they do with modification queries. They grab on real quick and then let go (except when…).
For the “small” plan, we start taking row locks, and keep taking row locks. The optimizer has informed the storage engine that ain’t much ado about whatnot here, because the estimate (which is correct) is only for 8,190 rows.
That estimate is preserved for the “big” plan that has to go and get a lot more rows. Taking all those additional row locks really slows things down.
No Accumulation, No Escalation.
We stay on taking 9.8 million row locks instead of escalating up to page or object locks.
When we request page locks from the get-go, we incur less overhead.
For the record:
- PAGLOCK: 2.4 seconds
- TABLOCK: 2.4 seconds
- NOLOCK: 2.4 seconds
Nothing seems to go quite as fast as when we start with the “big” parameter, but there’s another reason for that.
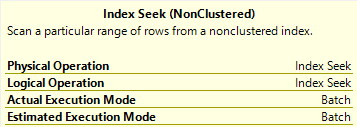
When we use the “big” parameter, we get batch mode on the Seek.

Welcome to 2019, pal.
Thanks for reading!
Going Further
If this is the kind of SQL Server stuff you love learning about, you’ll love my training. I’m offering a 75% discount to my blog readers if you click from here. I’m also available for consulting if you just don’t have time for that and need to solve performance problems quickly.