Sometimes parallel queries perform poorly due to bad luck. The parallel page supplier may distribute rows in a way that’s not optimal for performance. The hashing function used by SQL Server to split rows into threads may assign too many rows to a single thread. You may have seen some of these situations in production queries, but they can be hard to reproduce because they may depend on a lot of different factors including the complete data in some of the involved tables. This blog post demonstrates a technique to create demos that show how parallel thread imbalance can lead to poor performance.
Mapping Hash Partition Destination Threads
This work is inspired by a recent blog post at sql.sasquatch by my friend and colleague @sqL_handLe. For a given data type and DOP it appears that the same hashing function and thread boundaries are always applied, although I haven’t confirmed that. In other words, if an INT of value 1 in a parallel MAXDOP 4 query gets hashed to thread 2 in a query, then it may also get hashed to thread 2 from a different table in a different query. In other words, it appears to be possible to figure out ahead of time where different values will be hashed to. That means that it’s possible to construct a data set with very poor thread balance.
To create the mapping we need to construct a data set that makes it easy to tell which value gets sent to which thread. I inserted 20 distinct values into a table with each value having a row count equal to a different power of 2. Sample code to do this:
DROP TABLE IF EXISTS dbo.FIND_HASH_VALUES;

CREATE TABLE dbo.FIND_HASH_VALUES (
ID INT NOT NULL
);

DECLARE @start_num INT = 0;

INSERT INTO dbo.FIND_HASH_VALUES WITH (TABLOCK)
SELECT t.n
FROM
(
	SELECT v.n + @start_num AS n
	, ROW_NUMBER() OVER (ORDER BY v.n) RN
	FROM (
	VALUES
	  (1), (2), (3), (4), (5)
	, (6), (7), (8), (9), (10)
	, (11), (12), (13), (14), (15)
	, (16), (17), (18), (19), (20)
	) v(n)
) t
CROSS APPLY (
	SELECT TOP (POWER(2, -1 + t.RN)) 1 dummy
	FROM master..spt_values t1
	CROSS JOIN master..spt_values t2
) ca
OPTION (MAXDOP 1);
The above code runs in about a second on my machine. To see which value goes to which thread I need a query with a repartition streams operator that has the hash partitioning type. One way to get this is with window functions. The following query naturally goes parallel on my machine and has the operator that I’m looking for:
SELECT TOP 1
  ID
, COUNT(*) OVER (PARTITION BY ID) CNT
FROM FIND_HASH_VALUES
OPTION (MAXDOP 4);
The TOP 1 isn’t essential. It’s there to limit the size of the result set. The query finishes quickly and rows are sent to all four threads:

Decoding which value went to which thread can be done in SQL Server using the & operator. The query below finds the thread number for the 20 distinct values in the table:
DECLARE
@start_num INT = 0,
@thread1 INT = 61440,
@thread2 INT = 330245,
@thread3 INT = 240,
@thread4 INT = 656650;

SELECT t.ID
, cast(@thread1 & t.bit_comp as bit)
+ 2 * cast(@thread2 & t.bit_comp as bit)
+ 3 * cast(@thread3 & t.bit_comp as bit)
+ 4 * cast(@thread4 & t.bit_comp as bit) AS THREAD
FROM
(
	SELECT v.n + @start_num AS ID
	, POWER(2, -1 + ROW_NUMBER()
		OVER (ORDER BY v.n)) bit_comp
	FROM (
	VALUES
	  (1), (2), (3), (4), (5)
	, (6), (7), (8), (9), (10)
	, (11), (12), (13), (14), (15)
	, (16), (17), (18), (19), (20)
	) v(n)
) t;
Here’s the result set:

Getting the mapping for other ranges of IDs is as simple as changing the variables for both queries. I put the first 100 values on pastebin in case it’s useful for someone.
The Data Set
For demo purposes I want a table that contains values that will always hash to the same thread at MAXDOP 4. You can find 25 values that hash to the same thread in the pastebin. In the table below I insert 100k rows for each unique value that goes to thread 1:.
DROP TABLE IF EXISTS dbo.SKEWED_DATA;

CREATE TABLE dbo.SKEWED_DATA (
ID INT NOT NULL,
FILLER VARCHAR(50)
);

INSERT INTO dbo.SKEWED_DATA WITH (TABLOCK)
SELECT t.n, 'Lamak'
FROM
(
	SELECT v.n
	FROM (
	VALUES
	  (13), (14), (15), (16)
	, (30), (31), (32), (33)
	, (46), (47), (48), (49), (50)
	, (63), (64), (65), (66)
	, (80), (81), (82), (83)
	, (97), (98), (99), (100)
	) v(n)
) t
CROSS APPLY (
	SELECT TOP (100000) 1 dummy
	FROM master..spt_values t1
	CROSS JOIN master..spt_values t2
) ca
OPTION (MAXDOP 1);

CREATE STATISTICS S ON dbo.SKEWED_DATA (ID) WITH FULLSCAN;
The Query
The business requirement of the day is to take the first 2.5 million rows from the SKEWED_DATA table, calculate the row number partitioned by ID, and to return all rows with a row number greater than 100k. The query will never return any results based on how data was inserted into the table. Here is one way to express such a query:
SELECT ID, FILLER
FROM
(
	SELECT
	  ID
	, FILLER
	, ROW_NUMBER() OVER (PARTITION BY ID
		ORDER BY (SELECT NULL)) RN
	FROM
	(
		SELECT TOP (2500000)
		    ID
		  , FILLER
		FROM dbo.SKEWED_DATA
	) t
) t2
WHERE t2.RN > 100000
OPTION (MAXDOP 4);
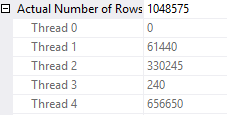
The query runs at MAXDOP 4 but does not benefit from parallelism at all. All of the rows are sent to the same thread:

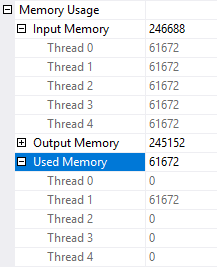
The sort spills to tempdb because the memory grant for the sort is split evenly across all four threads. Threads 2-4 don’t get any rows so 75% of the memory grant is wasted:

I ran the query five times and it executed in an average of 2816 ms. CPU time was generally pretty close to the elapsed time. This is a very bad example of a parallel query.
Lowering DOP
The query above is designed to not be able to take advantage of parallelism. The useless repartition streams step and the spill to tempdb suggest that the query might perform better with a MAXDOP 1 hint. With a MAXDOP 1 hint the query runs with an average time of 2473 ms. There is no longer a spill to tempdb.
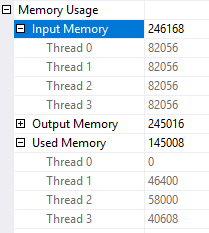
What happens if the query is run with MAXDOP 3? Earlier I said that the hashing function or thread boundaries can change based on DOP. With MAXDOP 3 I get a much more even row distribution on threads:

The better distribution of rows means that the spill to tempdb does not happen either:

The query definitely seems like it could benefit from parallelism. After five runs it had an average execution time of 1563 ms, almost a 50% improvement over the MAXDOP 4 query. The ratio of CPU time to elapsed time is also much more in line with what we might expect from a good parallel query:
CPU time = 3219 ms, elapsed time = 1574 ms.
Final Thoughts
It was fun to construct a query that runs faster when MAXDOP is lowered from 4 to 3. Hopefully the details were interesting in of themselves.
Thanks for reading!
Going Further
If this is the kind of SQL Server stuff you love learning about, you’ll love my training. I’m offering a 75% discount to my blog readers if you click from here. I’m also available for consulting if you just don’t have time for that and need to solve performance problems quickly.