PostgreSQL Performance Monitor
Free, open source monitoring for Aurora, RDS, and self-hosted PostgreSQL,
built by someone who tunes databases for a living.
26 PostgreSQL collectors. Outage predictors for the failures PostgreSQL never warns you about. Plan capture that works on managed hosting. A web dashboard, a desktop viewer, and an MCP server so your AI can read all of it.
Your data never leaves your network.
PostgreSQL 13–18 • Amazon Aurora & RDS • Self-hosted • MIT License • Signed binaries • No telemetry
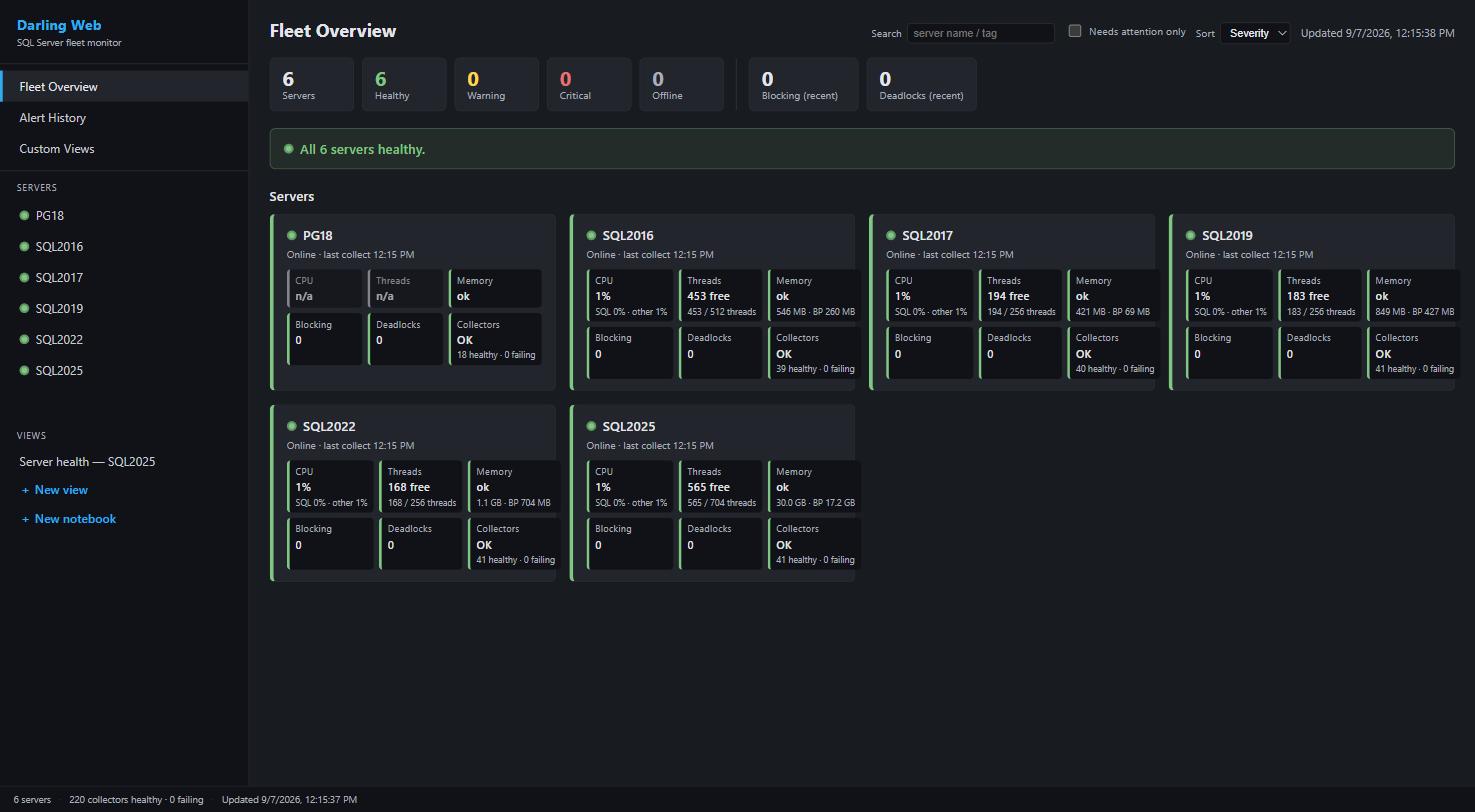
One fleet wall for every engine you run. That’s a PostgreSQL 18 card next to five SQL Servers, same dashboard, same store.
This is the PostgreSQL side of Performance Monitor, the same free tool that monitors SQL Server. One service watches both engines, so a mixed shop gets one fleet wall, one store, and one AI endpoint instead of two monitoring products. If you’re SQL Server only, start on the main page; everything below is about PostgreSQL.
Built for the Way PostgreSQL Actually Fails
PostgreSQL’s most damaging failures are quiet, slow, and fully predictable days ahead, and nothing in the engine raises its hand about them. Three of the collectors exist purely to predict outages, and all three alert.
Wraparound Headroom
XID and MultiXact freeze headroom per database, trended for 90 days. Run out of transaction IDs and the server stops accepting writes. The alert grades against your cluster’s own autovacuum_freeze_max_age, not a constant somebody guessed.
The Pinned Vacuum Horizon
Four unrelated causes make vacuum reclaim nothing, with an identical symptom and completely different fixes. The xmin horizon collector names the specific holder, the session, slot, or prepared transaction, instead of handing you a number to interpret.
Slot Retention
An abandoned replication slot retains WAL without bound, fills the volume, and stops the server, at whatever rate a busy writer generates WAL. Slot health and retained bytes are collected every minute and alerted before the disk does the alerting for you.
What Gets Collected
26 PostgreSQL-specific collectors into a time-series store the service manages itself. Extensions you have (pg_stat_statements, pg_stat_kcache, pg_qualstats, auto_explain) are detected and used; nothing requires one to start.
Queries & Plans
- Statement stats, self-hosted and Aurora
- Execution plans via auto_explain, captured and redacted, on Aurora and RDS too
- Per-query OS CPU and disk (pg_stat_kcache)
- Predicate statistics: what you actually filter on
- Test a hypothetical index without building it
- Wait analysis on every flavor, not just Aurora
Vacuum & Storage
- Autovacuum state with each table’s own computed trigger threshold
- Index bloat, measured rather than estimated
- Table bloat estimated cheaply, and suppressed when its inputs can’t be trusted
- Index usage, with the constraint facts that decide droppability
- Temp-file spills, per database
- Sessions holding transactions open, and whether they actually pin the horizon
Engine Internals
- Blocking as an edge list, so chains reassemble with a root
- Deadlock reports parsed whole: the wait graph, not just a count
- Lock state by mode, type, and relation
- Shared buffers: what is actually resident
- Checkpoints, background writer, and WAL
- Replication, with the lag measure that catches a stalled standby
Configuration is collected too, and so is what changed in it, so “what did somebody flip last Tuesday” is a lookup instead of an interrogation. Column statistics are collected with the customer data deliberately left behind, and raw statement text from pg_stat_activity is never stored, because it carries literal parameter values.
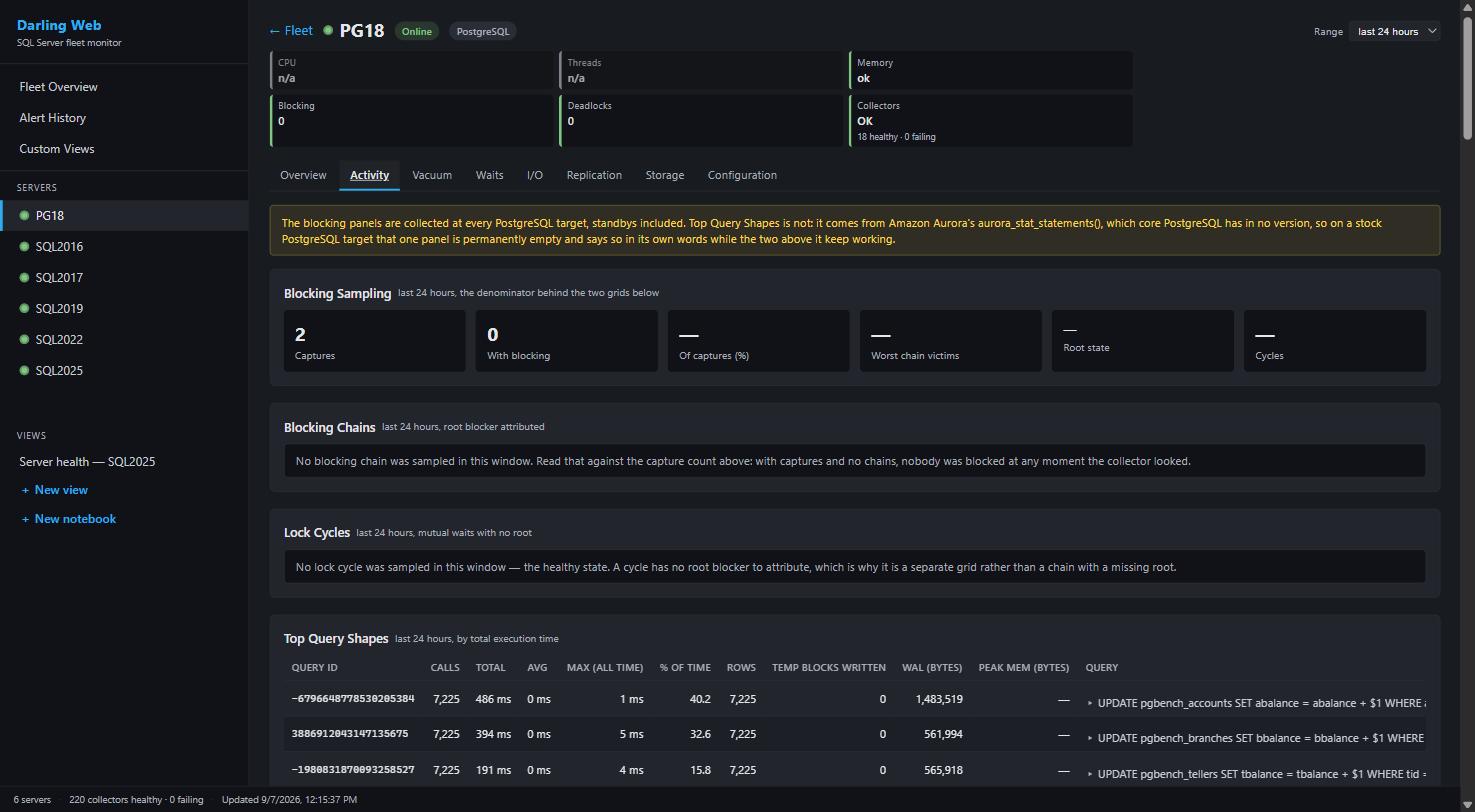
The Activity section on a live PostgreSQL target: blocking sampling with its denominator stated, and top query shapes by total execution time, with calls, WAL bytes, and the statement text.
Setup Is a Role and a Grant
Nothing is installed on the monitored cluster. No agent, no schema, no superuser. One read-only role with the standard pg_monitor grant covers every collector:
GRANT pg_monitor TO darling_monitor;
On Aurora and RDS, run the grant as an rds_superuser and you’re done. Statement-level stats want pg_stat_statements preloaded, which on managed hosting is a parameter-group change; everything else reads core catalogs.
Then Point the Service at It
A PostgreSQL target is a normal servers entry with an engine field. TLS defaults to full certificate verification, with the one relaxation Aurora’s RDS certificate authority usually needs.
“name”: “orders-prod”,
“engine”: “postgres”,
“host”: “orders-prod…rds.amazonaws.com”,
“auth”: “sql”,
“username”: “darling_monitor”,
“encryptedPassword”: “<encrypted blob>”
}
On a running fleet you don’t edit files at all: the viewer’s Add Server dialog or the MCP add_servers tool onboards a PostgreSQL target in one collection sweep, no restart. The install walkthrough covers the service itself, which runs on Windows or Linux.
Engine-Aware Everywhere
The store records what engine each target is, and every surface follows. A PostgreSQL server’s web page renders eight PostgreSQL sections: Overview, Activity, Vacuum, Waits, I/O, Replication, Storage, and Configuration. The desktop viewer does the same with its tabs. Nobody gets nineteen empty SQL Server screens at an Aurora instance.
The built-in MCP server carries 31 PostgreSQL-family tools out of its 134, so an AI assistant can read wraparound headroom, blocking edges, bloat, and plans from your actual collected data. And Custom Views compose dashboards and notebooks over any of it, no SQL required.
Standbys are handled like standbys: collectors that would report a replica’s meaningless zeros gate themselves off instead of reporting perfect health for a cluster thirteen million dead tuples behind. That number is from a real cluster. It’s why the gate exists.
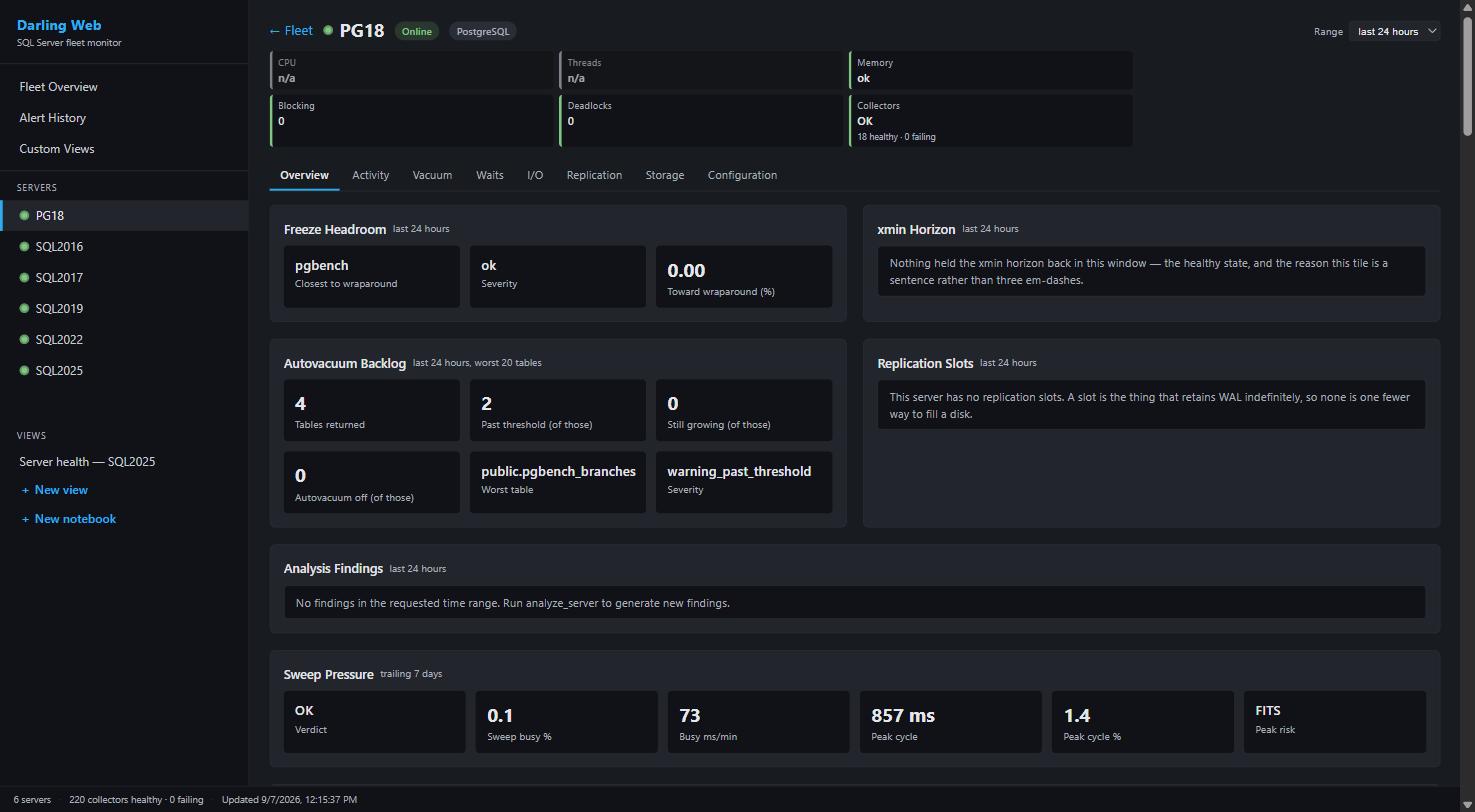
A PostgreSQL 18 target’s page: freeze headroom, autovacuum backlog with the worst table named, xmin horizon, and all eight sections in the strip.
Where the PostgreSQL Side Is Headed
The PostgreSQL side is newer than the SQL Server side, and it’s moving fast: everything above shipped across the last few releases. Today a PostgreSQL target collects the full picture, is readable through the web dashboard, viewer, and MCP, and raises the three outage-predictor alerts, with thresholds derived from your server’s own settings. The broader threshold family is next, and the first two are already built: the poison wait alert and the instance CPU alert (Aurora and RDS, read from Performance Insights) land in the next release, with the rest of the alert engine and scheduled analysis findings behind them.
One design note worth knowing rather than discovering: two collectors are honest samples rather than event logs, because PostgreSQL records nothing unless something asks. Blocking shorter than the one-minute interval is never seen, and the reads say so instead of pretending otherwise. PostgreSQL monitoring is the Darling fleet service’s job; the standalone Lite desktop app stays SQL Server.
Free Forever, With a Paper Trail If You Need One
MIT licensed, open source, signed releases, no telemetry, no license keys, and every query it runs against your clusters is in the repo for your security team to read. If procurement needs a vendor agreement, the support subscription is $500 a year for unlimited servers, both engines included.