Some SQL Server workloads are slow even though there aren’t any hints in the wait stats that suggest ways to make them go faster. This blog post works through a columnstore example of such a workload.
The Test Setup
The test server has 96 physical cores. The test workload has many concurrent writers to the same columnstore target table. The source data is a simple staging table with ten columns. Each column contains sequential integers from 1 to 10485760. Here is T-SQL to create and populate the tables:
DROP TABLE IF EXISTS dbo.RS_SOURCE_10_COLUMN_SIMPLE;

CREATE TABLE dbo.RS_SOURCE_10_COLUMN_SIMPLE (
    ID1 BIGINT,
    ID2 BIGINT,
    ID3 BIGINT,
    ID4 BIGINT,
    ID5 BIGINT,
    ID6 BIGINT,
    ID7 BIGINT,
    ID8 BIGINT,
    ID9 BIGINT,
    ID10 BIGINT
);

INSERT INTO dbo.RS_SOURCE_10_COLUMN_SIMPLE
	WITH (TABLOCK)
SELECT q.ID, q.ID, q.ID, q.ID, q.ID
, q.ID, q.ID, q.ID, q.ID, q.ID
FROM
(
       SELECT TOP (10485760) ROW_NUMBER()
             OVER (ORDER BY (SELECT NULL)) ID
       FROM master..spt_values t1
       CROSS JOIN master..spt_values t2
       CROSS JOIN master..spt_values t3
) q
OPTION (MAXDOP 1);

DROP TABLE IF EXISTS dbo.CCI_TARGET_10_COLUMN;

CREATE TABLE dbo.CCI_TARGET_10_COLUMN (
    ID1 BIGINT,
    ID2 BIGINT,
    ID3 BIGINT,
    ID4 BIGINT,
    ID5 BIGINT,
    ID6 BIGINT,
    ID7 BIGINT,
    ID8 BIGINT,
    ID9 BIGINT,
    ID10 BIGINT,
    INDEX CCI0 CLUSTERED COLUMNSTORE
);
Concurrency is controlled by changing the number of stored procedures kicked off by a SQLCMD batch file. Each stored procedure does a single MAXDOP 1 insert from the staging table into the columnstore table. This test is different from the previous columnstore insert test documented here in that all of the sessions write to the same table and the source data gets significantly worse compression. In addition, each stored procedure only does a single insert, so the total overall work done increases as the number of concurrent sessions increases. If I run a single insert like the following:
INSERT INTO dbo.CCI_TARGET_10_COLUMN
SELECT *
FROM dbo.RS_SOURCE_10_COLUMN_SIMPLE
OPTION (MAXDOP 1);
That takes about 25 seconds to complete on the test server. It would be ideal if the average run time of the stored procedure stays at around 25 seconds as concurrency increases.
Test Results
We are not in an ideal world. The average run time of each stored procedure execution quickly increases with the number of concurrent sessions:
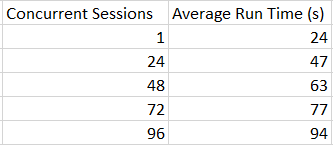
It may be slightly unreasonable to expect 96 concurrent sessions to scale perfectly well and to end up with an average run time of 24 seconds. With that said, the observed overhead is almost 4X at that scale. Let’s start by looking at wait stats:

Most of the entries are related to memory. SOS_PHYS_PAGE_CACHE shows up because LPIM is enabled. This might be a helpful clue, but the waits only add up to about 10 seconds of waits per second. On a server with 96 cores that alone cannot explain a 4X degradation in scalability.
There is nothing helpful in latches:

A number of spinlock collisions occurred during the workload:

This is entirely a judgment call on my part, but based on my experience on this server and with similar workloads I don’t find those spinlock numbers to be at all remarkable. With that said, one avenue of investigation would be to dig into those spinlocks more.
From my point of view, the most important clue is that the server experiences high CPU throughout the workload according to SQL Server (using sys.dm_resource_governor_resource_pools), resource monitor, and perfmon. Perfmon also reports high privileged time:
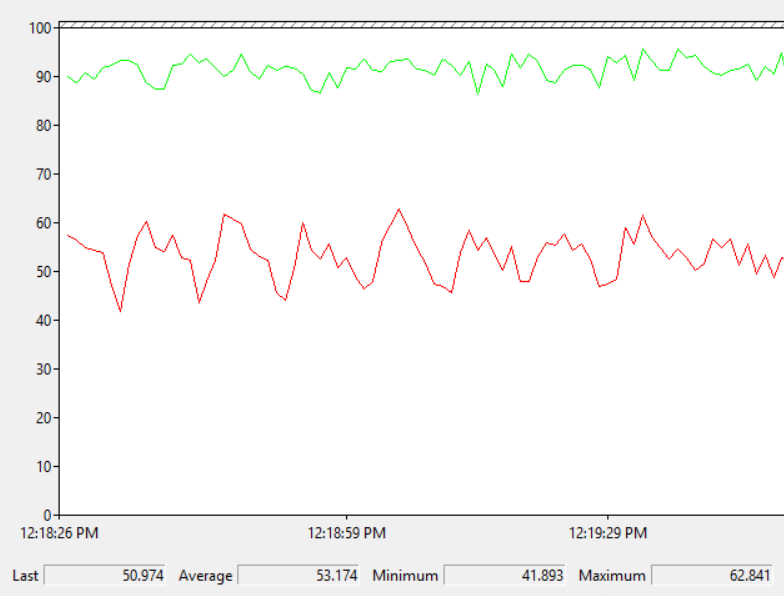
SQL Server appears to be doing something which requires significantly more CPU at higher concurrency. Therefore, it makes perfect sense that the wait stats and latch stats alone aren’t very helpful. It’s reasonable to expect most wait types and latch classes to result in low CPU during their waits as opposed to high CPU.
ETW Tracing
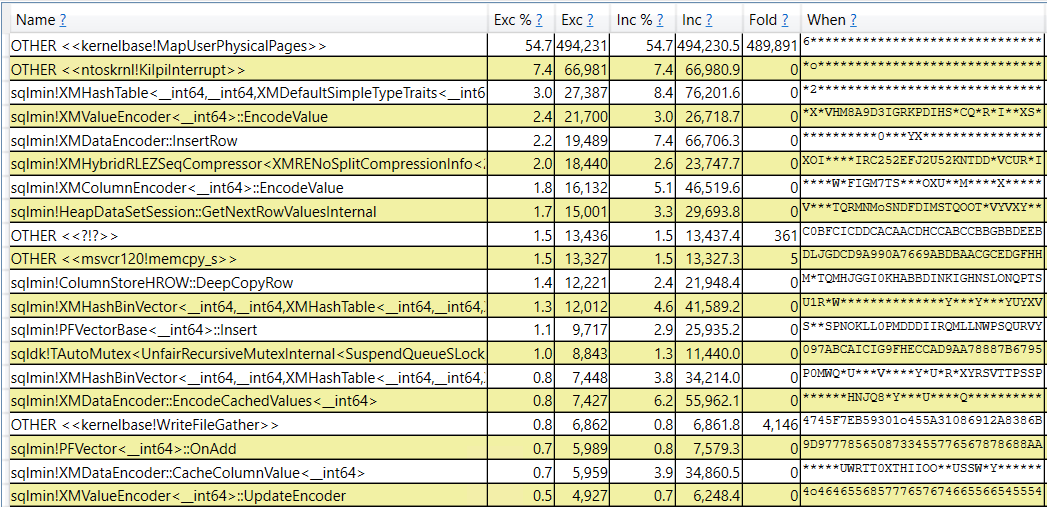
ETW tracing can be used to diagnose CPU issues on servers. I’m still pretty new at it, but I use PerfView. In particular, what I really want to see is sampled call stacks to get an idea as to where CPU is being spent. I took a ten second sample during the 96 concurrent session workload and grouped by module name:

The circled modules are typically what I see in SQL Server call stacks. SQL Server is responsible for the majority of CPU work on the server, but the majority of the work is done in the ntoskrnl and hal modules. I have it on good authority that CPU spent in that context will be tracked as privileged time in perfmon, so this roughly lines up with the perfmon graph previously shown.
A different view of the data reveals that most of the work is done as part of kernalbase!MapuserPhysicalPages:
In addition, we can see methods that call kernalbase!MapuserPhysicalPages:
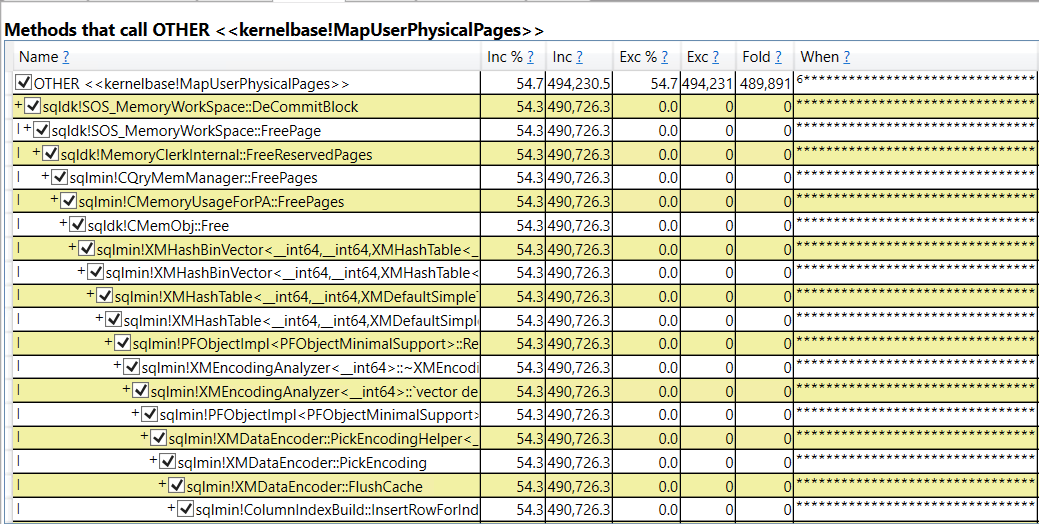
Presenting the data in a different way, we can see what was called by sqldk!SOS_MemoryWorkSpace::FreePage:
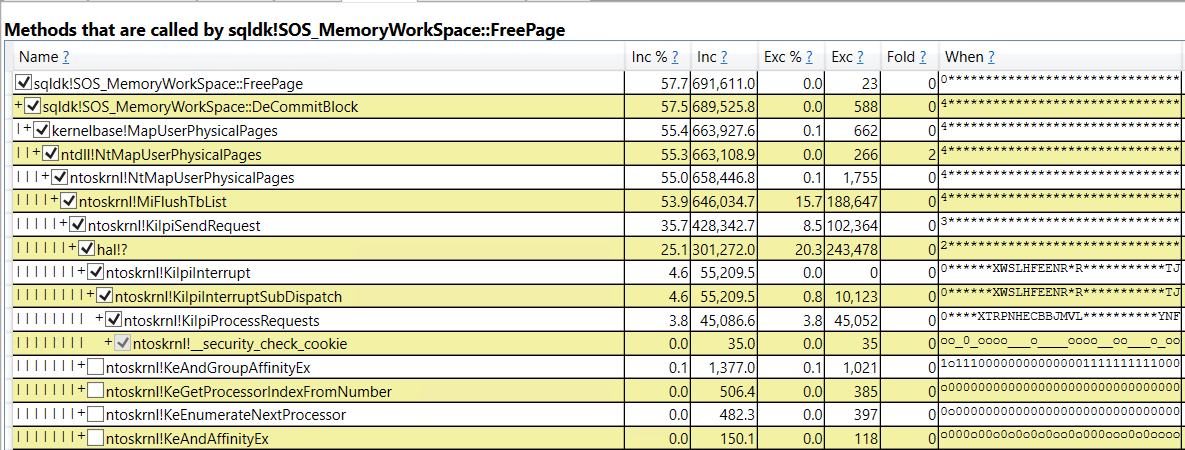
It appears that most of the CPU during the workload is spent returning memory from SQL Server to the OS. Backing that up, the memory commit for SQL Server was observed to decrease during the workload through resource monitor, even though there wasn’t any pressure from the OS and the total commit size was only at about 50% of max server memory.
For this workload, we are lucky in that important call stack names can be tied back to something in SQL Server. For example, sqldk!SOS_MemoryWorkSpace::FreePage would appear to be associated with freeing pages and that can be tracked from within SQL Server using extended events.
Extending The Investigation
The page_allocated and page_freed debug extended events are helpful in understanding how memory is allocated and freed during a query’s execution. First I started with a histogram target on memory_clerk_name for the page_freed event page_freed filtered to a single session. Here’s what that looks like:
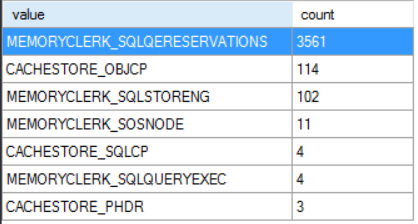
Nearly all of the free page events are for the MEMORYCLERK_SQLQERESERVATIONS clerk. I believe this clerk is responsible for granted query memory so this makes sense. Next we can turn on causality tracking and include the page_allocated event as well. Here’s a screenshot of some of the data for a simple CCI insert that processes three rowgroups in total:
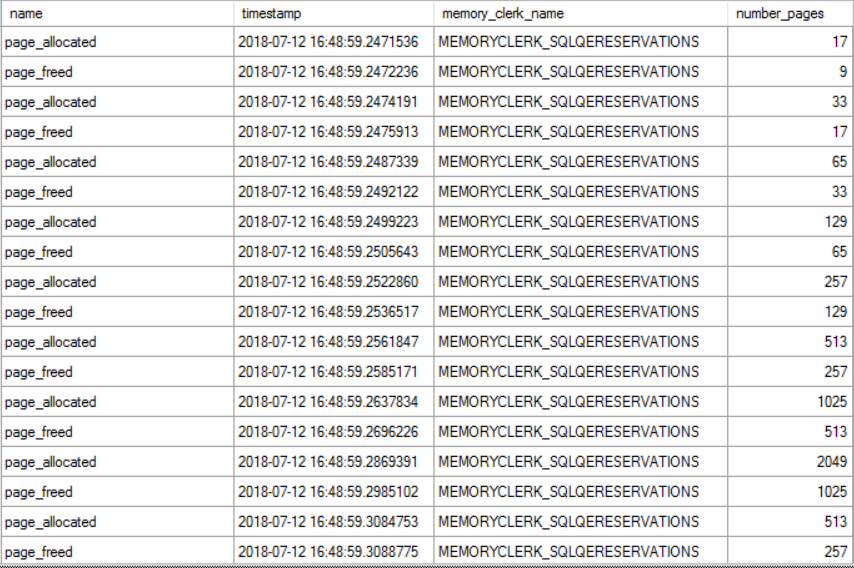
There are many different patterns in the data. Sometimes there is a series of free events and sometimes there is a series of allocation events. They can also alternate as shown in the picture above. The number of pages freed or allocated is usually one plus a power of two. I saved the data to a table and calculated a running total of current memory allocations for the query. The running total increased whenever pages were allocated and decreased whenever pages were freed. I’m really phoning it in with this graph, but here are the results:
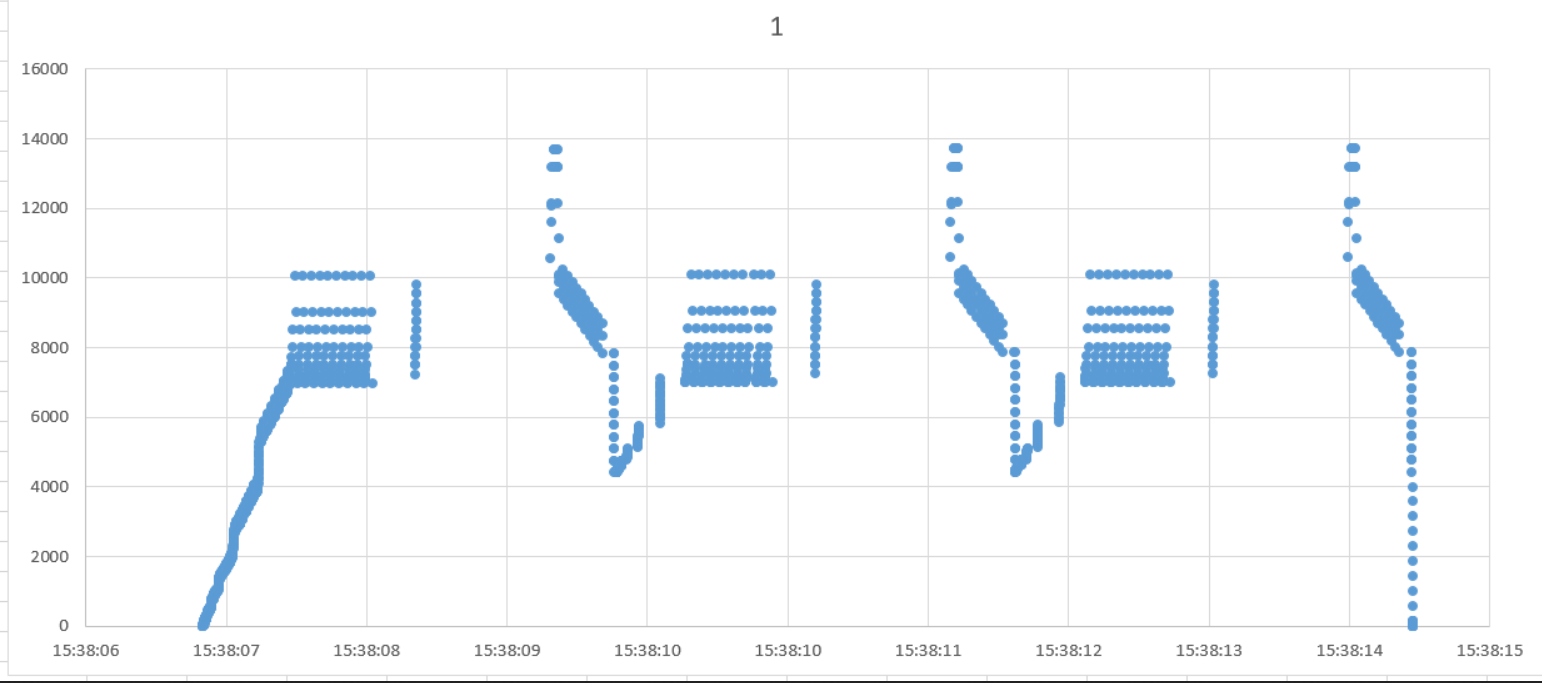
The x-axis is time and the y-axis is total pages currently allocated to the query. This query compresses three rowgroups in total. That’s why the pattern repeats three times. Other than that, the only thing I was able to tie back to the compression algorithm was that pages are rapidly freed as segments are finished:

In summary, page allocations and page free events rapidly occur, sometimes in an alternating pattern. SQL Server will often free a number of pages just to immediately request allocations for a similar number of pages. If all of the free page events result in returned memory to the OS then the reason for the scalability bottleneck becomes clear. When running the full workaround with 96 concurrent sessions, a total of 341965 page freed operations were performed. Those events freed about 71.3 million pages in total. That amounts to about 584 GB of memory returned to the OS in total, based on the previous assumptions.
It seemed bizarre to me for SQL Server to return so much memory to the OS during columnstore compression even though it would very likely immediately need more memory for compression. A colleague suggested that this could be a deliberate design decision by Microsoft to reduce the likelihood of out-of-memory errors when allocating memory above the max server memory setting:
“Starting with SQL Server 2012 (11.x), SQL Server might allocate more memory than the value specified in the max server memory setting. This behavior may occur when the Total Server Memory (KB) value has already reached the Target Server Memory (KB) setting (as specified by max server memory). If there is insufficient contiguous free memory to meet the demand of multi-page memory requests (more than 8 KB) because of memory fragmentation, SQL Server can perform over-commitment instead of rejecting the memory request.
This behavior is typically observed during the following operations:
Large Columnstore index queries.
Columnstore index (re)builds, which use large volumes of memory to perform Hash and Sort operations.”
What is Normal?
All of the above observations around memory allocations and freed memory are interesting but some additional context is needed. I suspect that it doesn’t, but it’s possible that a traditional row mode query would show the same pattern of allocated and freed pages. To investigate that, I created a row mode query with a memory consuming operator that processes a result set of rows, releases the rows, and continues to do so in a loop. The query plan looks like this:

Note the Hash Match (Aggregate) operator on the inner side of the nested loop. For each row in the DRIVE_ME table, SQL Server will send nearly all of the rows from DISTINCT_ONE_COL into the hash match operator. The reason that I went for this type of query is that it felt like the most similar pattern to columnstore compression in that compression processes up to 1048576 rows per thread in what’s effectively a loop. For those following along at home here is T-SQL to generate that query plan:
drop table if exists DRIVE_ME;

create table DRIVE_ME (ID INT);

INSERT INTO DRIVE_ME VALUES
(1), (2), (3), (4), (5), (6), (7),
(8), (9), (10), (11), (12), (13), (14);

drop table if exists DISTINCT_ONE_COL;

create table DISTINCT_ONE_COL (ID INT);

INSERT INTO DISTINCT_ONE_COL WITH (TABLOCK)
SELECT TOP (10000000) ROW_NUMBER()
      OVER (ORDER BY (SELECT NULL)) ID
FROM master..spt_values t1
CROSS JOIN master..spt_values t2
CROSS JOIN master..spt_values t3
OPTION (MAXDOP 1)

GO

CREATE OR ALTER PROCEDURE
dbo.REPEATED_ROW_MODE_ALLOC AS
BEGIN
SET NOCOUNT ON;
SELECT ca.cnt
FROM DRIVE_ME d
OUTER APPLY
(
	SELECT COUNT(DISTINCT ID)
	FROM DISTINCT_ONE_COL
	WHERE ID > d.ID
) ca (cnt)
OPTION (MIN_GRANT_PERCENT = 2.5)
END;
On the test server executing a single query took around 90 seconds. That single query execution frees around 760000 memory pages in total. Memory is allocated and freed in cycles. There isn’t a pattern where allocation and free events trade off between each other.
The workload does very well at scale. With 96 concurrent sessions the average stored procedure execution remains at around 90 seconds. We’re freeing the same amount of pages in total as the columnstore insert workload without seeing a drop in scalability. We can again use PerfView to analyze the workload by modules:
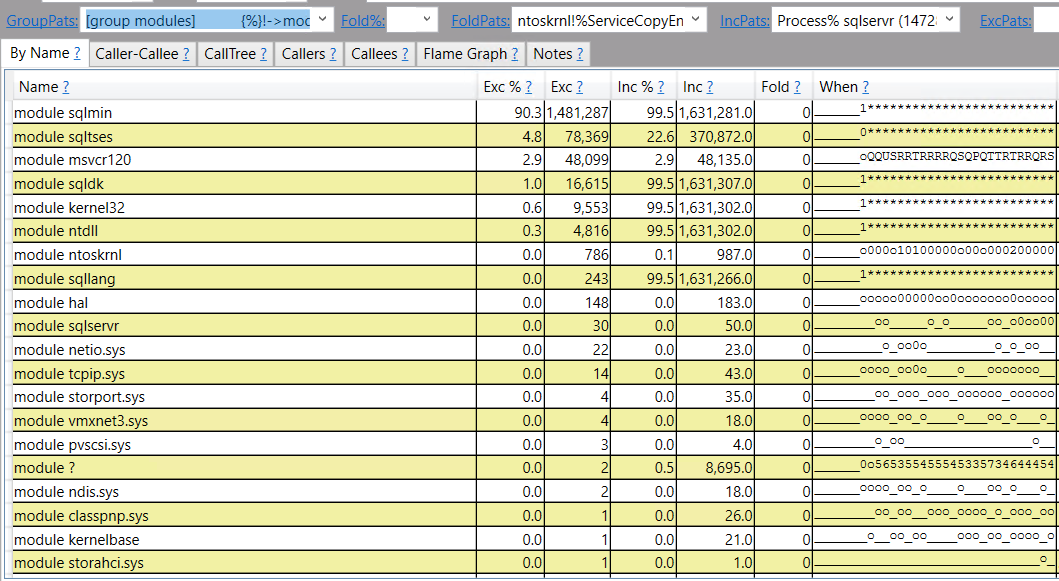
This time most of the CPU is spent on SQL Server managed code. Drilling down, the operation that uses the most CPU appears to involving inserting rows into a hash table that’s in a query’s memory grant:
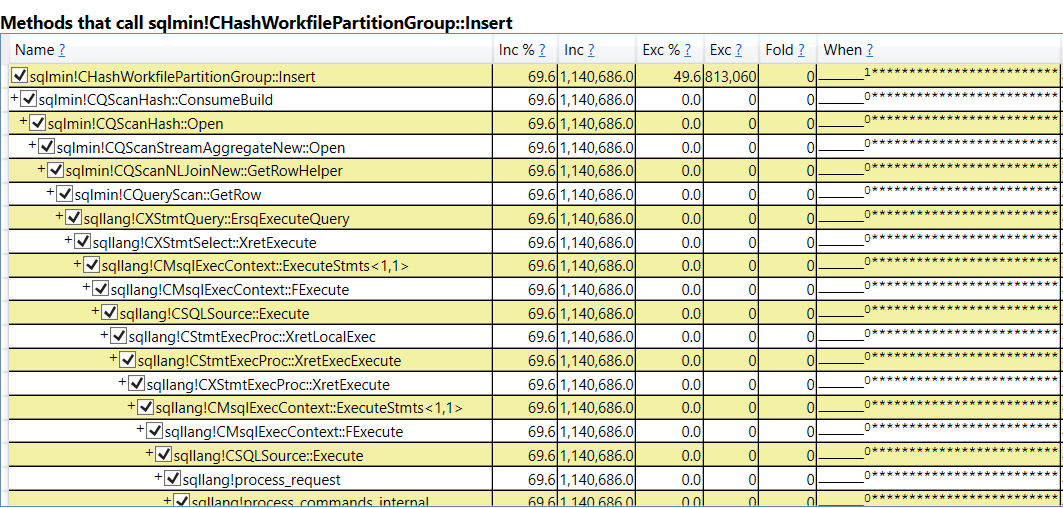
There isn’t necessarily anything wrong with this. After all, something needs to use the most CPU during the workload and we do achieve very good scalability. To me, the most important part is how call stacks are different when looking at everything called by sqldk!SOS_MemoryWorkSpace::FreePage:
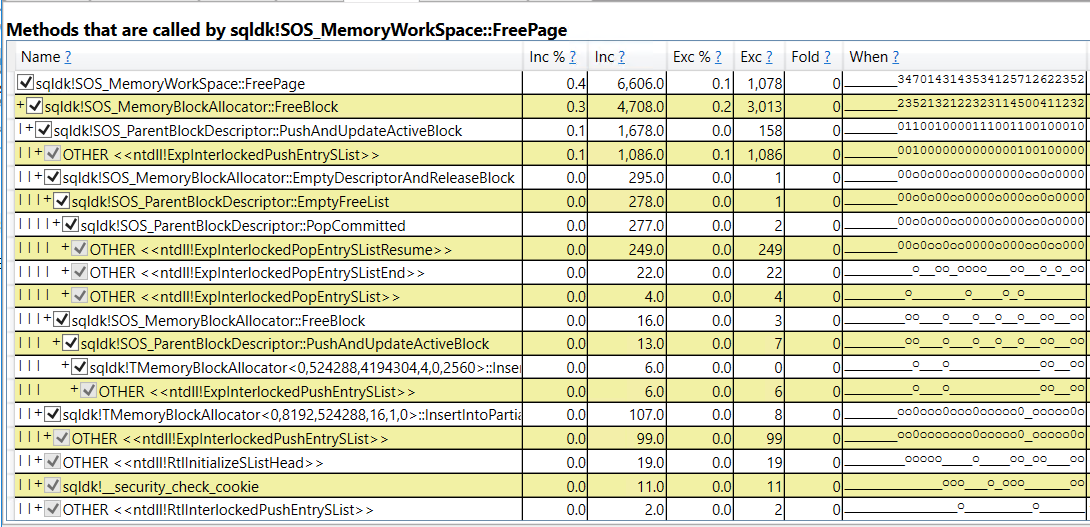
Within SQLOS we call “FreeBlock” instead of “DecommitBlock”. The windows OS calls are significantly different compared to columnstore compression and I wasn’t able to observe the memory commit for SQL Server changing during the workload. I can’t say for sure, but it looks like when memory is freed for memory-consuming row mode operators it is returned to SQL Server as opposed to returned to the OS. That makes a big difference in scalability.
I wanted to test with batch mode memory consuming operators, but couldn’t figure out a query pattern that resulted in the number of processed rows getting constantly reset for an operator that didn’t involve UDFs. I will say that I observed memory getting returned to the OS during batch mode queries, but I did not immediately see the performance bottleneck around freeing the pages. It’s possible that with more work a demo could be created to show this bottleneck. It’s also possible that the different pattern of freed pages means that it won’t realistically happen. In my limited testing I did not see batch mode operators free pages before they had done all of their work, which is significantly different from the columnstore compression pattern of allocating and freeing pages.
Changing the Memory Model
We know that the problem has to do with memory deallocation, so testing with the conventional and large pages memory models may be fruitful. The workload significantly degraded without lock pages in memory. The average insert time was about 368 seconds with 96 concurrent sessions. 91% of the workload time can be tied back to memory related waits:

At first glance, this workload has a problem with memory allocation as opposed to freeing memory pages. It would be possible to use techniques within SQL Server to further drill into the scalability bottleneck, but I will not do that analysis here.
Enabling large pages for the buffer pool via TF 834 does not resolve this bottleneck. The average insert completion time is nearly identical to the LPIM test and I did not observe any significant differences in PerfView results. TF 834 is helpful with some columnstore workloads but it does not help with this one. Keep in mind that TF 834 is not supported with columnstore according to Microsoft.
Waiting for a Wait Type
I’m not a cloud guy, but I wonder if it would even be possible to troubleshoot an issue like this if the investigator doesn’t have access to the underlying OS or the ability to install ETW tracing tools. It would be helpful if Microsoft was able to capture and present this bottleneck in SQL Server. For example, a new wait type could be defined named something like “RESERVED_MEMORY_FREE_EXT” with the timer starting after sqldk!SOS_MemoryWorkSpace::DeCommitBlock and ending after the OS owned code finishes its work. A defined wait type would make it much more obvious that there’s a problem and allow affected end users to easily search for guidance or workarounds for the issue. This would be a cpu busy external wait. I don’t know if defining a wait like this is in line with Microsoft’s general philosophy for designing wait types, but it’s just an idea.
If the bottleneck in the OS truly can’t be solved then perhaps it could be protected by a spinlock within SQL Server. That spinlock might not accomplish anything other than letting someone who only has access to SQL Server know that there’s a problem. Again I don’t know if that’s an appropriate use of a spinlock. I’m out of my depth here when it comes to suggestions like these, but I do think there is a need to classify this bottleneck. Of course, Microsoft making code changes in SQL Server or even in Windows Server to resolve the bottleneck would be preferred.
Final Thoughts
This blog post covered the investigation of a slow workload for which wait stats were not helpful in diagnosing the problem. In summary:
- ETW tracing and extended events revealed a bottleneck related to returning memory to the OS from SQL Server. This bottleneck can occur when loading data into columnstore tables at reasonably high concurrency.
- Lock pages in memory can have a dramatic effect on workload performance even when paging to disk is not occurring. This must be a gross oversimplification, but with LPIM SQL Server uses different OS calls to manage memory and the difference in those calls can lead to scalability issues with and without LPIM. For example, highly concurrent workloads that call HASHBYTES have been observed to get better throughput with LPIM.
- For columnstore workloads on SQL Server 2017, I recommend the use of LPIM unless there is a very good reason not to use it. I have seen LPIM cause performance issues on SQL Server 2016 but have not fully sourced those issues. LPIM still may be the right starting point on SQL Server 2016.
- The investigation did not have a happy ending in that it isn’t clear how to resolve the bottleneck except by lowering concurrency. However, the work done here does provide a helpful foundation for reaching out to a VM or Windows admin or for opening a support ticket with Microsoft.
Thanks for reading!
Going Further
If this is the kind of SQL Server stuff you love learning about, you’ll love my training. I’m offering a 75% discount to my blog readers if you click from here. I’m also available for consulting if you just don’t have time for that and need to solve performance problems quickly.
One thought on “What To Do When SQL Server Wait Stats Don’t Help”
Comments are closed.