Time Is On My Side
Whenever I’m looking over query plans with clients, their eyes get drawn towards many things that I’ve learned to ignore over the years.
It’s not that they’re never important, it’s just that, you know… There’s usually more important stuff.
One of those things is compilation timeouts. Most people think that it’s time-based, and it means that their query timed out or took a long time to compile.
Not so! It’s purely a set number of steps the optimizer will take to figure out things like:
- Join order
- Join/Aggregate type
- Index usage
- Seeks vs Scans
- Parallelism
And probably some other stuff that I just don’t have the Friday afternoon energy to think about any more.
But anyway, the point is that it’s not a sign that your query timed out, or even that plan compilation took a long time.
The initial number of steps allowed is based on the optimizer’s assessment of statement complexity, which includes the number of joins (of course), in case you were wondering.
From there each additional stage gets a set number of steps based on the number of steps that the previous stage took.
Plan Cache Script
You can use this script to look in your plan cache for plans that the optimizer has marked as having a timeout.
WITH
    XMLNAMESPACES
(
    DEFAULT 'http://schemas.microsoft.com/sqlserver/2004/07/showplan'
)
SELECT
    query_text =
        SUBSTRING
        (
            st.text,
            qs.statement_start_offset / 2 + 1,
            CASE qs.statement_start_offset
                 WHEN -1
                 THEN DATALENGTH(st.text)
                 ELSE qs.statement_end_offset
            END - qs.statement_start_offset / 2 + 1
        ),
    compile_time_ms =
        qs.query_plan.value('(//StmtSimple/QueryPlan/@CompileTime)[1]', 'bigint'),
    compile_cpu_ms =
        qs.query_plan.value('(//StmtSimple/QueryPlan/@CompileCPU)[1]', 'bigint'),
    compile_memory_mb =
        qs.query_plan.value('(//StmtSimple/QueryPlan/@CompileMemory)[1]', 'bigint') / 1024.,
    qs.query_plan,
    qs.execution_count,
    qs.total_worker_time,
    qs.last_execution_time
FROM
(
    SELECT TOP (10)
        qs.plan_handle,
        qs.sql_handle,
        qs.statement_start_offset,
        qs.statement_end_offset,
        qs.last_execution_time,
        qs.execution_count,
        qs.total_worker_time,
        qp.query_plan
    FROM sys.dm_exec_query_stats AS qs
    CROSS APPLY sys.dm_exec_query_plan(qs.plan_handle) AS qp
    WHERE qp.query_plan.exist('//StmtSimple/@StatementOptmEarlyAbortReason[.="TimeOut"]') = 1
    ORDER BY
        total_worker_time / qs.execution_count DESC
) AS qs
CROSS APPLY sys.dm_exec_sql_text(qs.sql_handle) AS st;
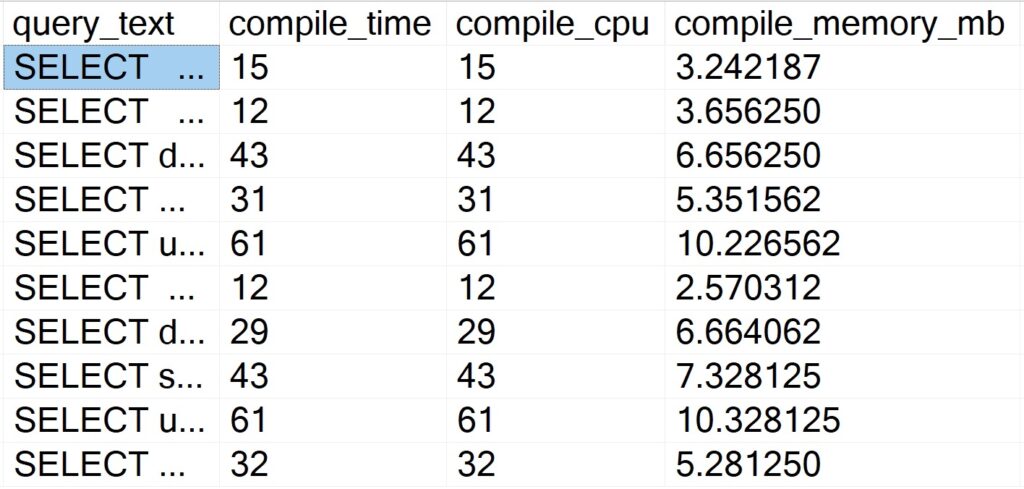
There’s not a whole lot of sense to this query other than to prove a point. Here are some abridged results from a client system:

Despite all of these queries “timing out” during optimization phases, the longest compile time is 61 milliseconds.
Query Store Script
Like above, there’s not a lot of sense to this one. It is nice to be able to skip some of the additional XML shredding and go to some of the plan metadata stored in Query Store:
WITH
    XMLNAMESPACES
(
    DEFAULT 'http://schemas.microsoft.com/sqlserver/2004/07/showplan'
),
    queries
AS
    (
        SELECT TOP (101)
            parent_object_name =
                ISNULL
                (
                    OBJECT_NAME(qsq.object_id),
                    'No Parent Object'
                ),
            qsqt.query_sql_text,
            query_plan =
                TRY_CAST(qsp.query_plan AS xml),
            qsrs.last_execution_time,
            qsrs.count_executions,
            qsrs.avg_duration,
            qsrs.avg_cpu_time,
            avg_compile_duration_ms =
                qsq.avg_compile_duration / 1000.,
            avg_compile_memory_mb =
                qsq.avg_compile_memory_kb / 1024.,
            avg_optimize_cpu_time_ms =
                qsq.avg_optimize_cpu_time / 1024.
        FROM sys.query_store_runtime_stats AS qsrs
        JOIN sys.query_store_plan AS qsp
            ON qsp.plan_id = qsrs.plan_id
        JOIN sys.query_store_query AS qsq
            ON qsq.query_id = qsp.query_id
        JOIN sys.query_store_query_text AS qsqt
            ON qsqt.query_text_id = qsq.query_text_id
        WHERE qsrs.last_execution_time >= DATEADD(DAY, -7, SYSDATETIME())
        AND   qsrs.avg_cpu_time >= (10 * 1000)
        AND   qsq.is_internal_query = 0
        AND   qsp.is_online_index_plan = 0
        AND   TRY_CAST(qsp.query_plan AS xml).exist('//StmtSimple/@StatementOptmEarlyAbortReason[.="TimeOut"]') = 1
        ORDER BY
            qsrs.avg_cpu_time DESC
    )
SELECT
    qs.query_sql_text,
    qs.parent_object_name,
    qs.query_plan,
    qs.avg_compile_duration_ms,
    qs.avg_optimize_cpu_time_ms,
    qs.avg_compile_memory_mb,
    qs.count_executions,
    qs.avg_duration,
    qs.avg_cpu_time,
    qs.last_execution_time
FROM
    queries AS qs
ORDER BY
    qs.avg_cpu_time DESC
OPTION (RECOMPILE);
Also like above, the results bring back very short compile times.
So There
The point of this post was that you don’t need to worry about these timeouts from a plan compilation time perspective.
Of course, it may represent a plan quality issue, but that’s much harder to prove from first glances. You’d need to dig into that on your own Friday afternoon.
If you find user queries experiencing optimizer timeouts, it may solve the problem to simplify them as much as possible. Breaking long queries up into #temp tables is a popular solution for this.
Thanks for reading!
Going Further
If this is the kind of SQL Server stuff you love learning about, you’ll love my training. I’m offering a 75% discount to my blog readers if you click from here. I’m also available for consulting if you just don’t have time for that and need to solve performance problems quickly.
Where I work we have a number of nested views that seem to be worse for getting optimized in SQL 2019 than previous versions. I am seeing some pretty high compile time ms with some well over 1000.
Hopefully SQL 2022 will improve on this.
Why would it do that?
SELECT REVERSE(‘amanaplanacanalpanama’)
Yeah try doing that twice though 🤔
Is there a way to grant the SQL Server optimizer extended time to study a particular query that we want to optimize?
Oracle has something called SQL profiles.
Yes, there’s a trace flag that I’m not allowed to publicize.