Wiseacre
When I was sitting down to figure out what to write about this, one of the topics that I thought would be interesting was the width of lines/arrows in query plans.
I sat here for half a day pecking here and there getting the post started, writing some demos, and… realized I couldn’t remember the last time I really looked at them. I could explain it, but… I’d be lying to you if I said I really cared.
Unless you have an actual execution plan, line thickness is based on estimates. They could be totally wrong, and chances are that if you’ve got a query plan in front of you it’s not because it’s running well.
If you’re going to run it and look at the actual execution plan anyway, you’d have to be seven levels obtuse to look at line widths instead of operator times.
They’re your best friends these days, and help you focus on the parts of the plan that need help.
Looney Tunes
At this point in 2022, most people are going to be looking at plans running only in row mode. As folks out there start to embrace:
- Column store
- SQL Server 2019 Enterprise Edition
- Compatibility level 150+
We’ll start to see more batch mode operators, especially from batch mode on row store. I only mention this because row mode and batch mode operators track time differently, and you need to be really careful when analyzing operator times in actual execution plans.
In plans that contain a mix of row mode and batch mode operators, timing might look really funny in some places.
Let’s chat about that!
Row Mode
As of this writing, all row mode query plan operators accumulate time, going from right to left. That means each operator tracks it’s own time, along with all of the child operators under it.
Where this is useful is for following time accumulation in a query plan to where it spikes. I sort of like this because it makes tracking things down a bit easier than the per-operator times in batch mode plans.
Let’s use this plan as an example:

Yes, it’s intentionally bad. I made it that way. You’re welcome. There are two things I’d like to point out here:
- Just about every line looks equally thick
- Costing is a bit weird, aside from the Eager Index Spool
But you know what? If you look at operator times, you can get a pretty good idea about where things went wrong.
- Maybe that Key Lookup wasn’t the greatest use of time
- Boy howdy, that eager index spool took about 90 seconds
I’m not gonna go into how to fix this, I just want you to understand where time is taken, and how it adds up across operators.
Batch Mode
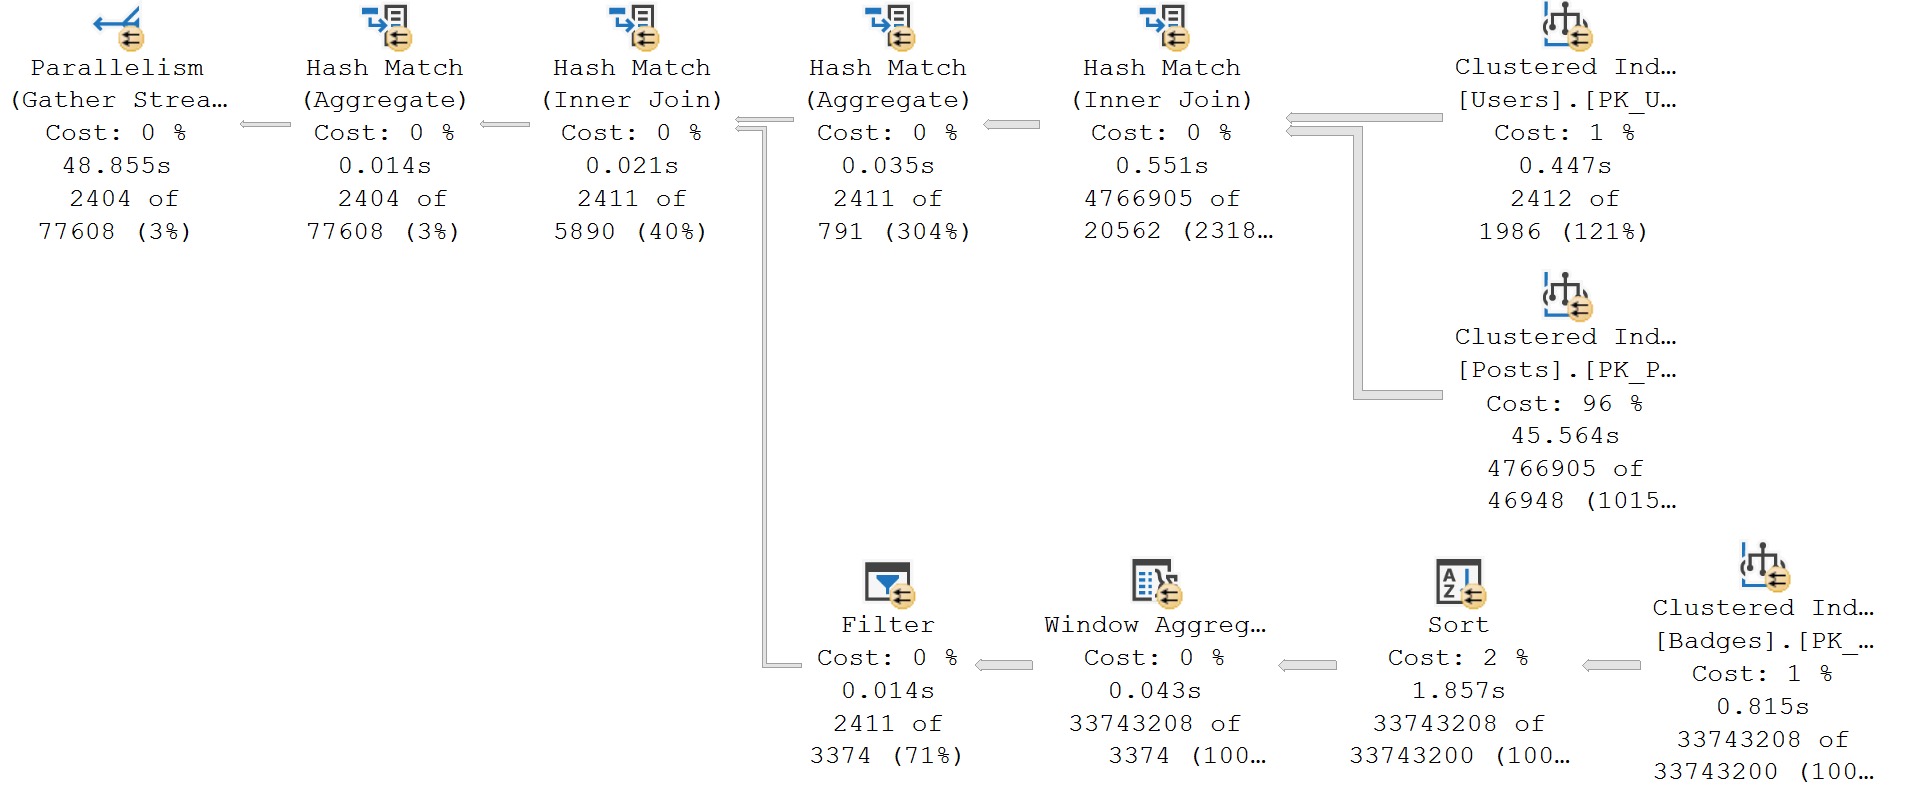
In batch mode plans, the story is a whole lot different.

Times for operators are all over the place. They’re not wrong, they’re just different. Each operator that executes in batch mode tracks it’s own time, without the child operator times.
Nothing adds up until the very end, when you hit the Gather Streams operator. Right now, none of the parallel exchange operators can run in batch mode, so they’ll add up all of the child operator times.
If you’ve got a plan with a lot of operators mixed between row and batch mode, things will look even weirder.
Thanks for reading!
Going Further
If this is the kind of SQL Server stuff you love learning about, you’ll love my training. I’m offering a 75% discount to my blog readers if you click from here. I’m also available for consulting if you just don’t have time for that and need to solve performance problems quickly.
Hey Erik,
if we promise to listen more than once to your album, can we also get the scripts that you are using in the demos? I, for one, cannot see anything on this tiny display, but I am more than willing to re-run your code to see what’s what on my local SSMS.
thank you!
Sometimes I publish them, sometimes I don’t. I don’t even know if I kept these. Sorry!
Looking at the Hash Match Aggregate operator it seems that exactly the same icon is used for both row-mode and batch-mode, that’s … helpful
Teehee! Yeah, there’s not a lot of great physical indicators.