One Way Or Another
The OR operator is a perfectly valid one to use in SQL statements. If you use an IN clause, there’s a reasonable chance that the optimizer will convert it to a series of OR statements.
For example, IN(1, 2, 3) could end up being = 1 OR = 2 OR = 3 without you doing a darn thing. Optimizers are funny like that. Funny little bunnies.
The problem generally isn’t when asking for IN or OR for a single column, with a list of literal values, the problem is usually when you:
- Use OR across multiple where clause columns
- Use OR in a join clause of any variety
- Use OR to handle NULL parameters or variables
Throw in some additional complexity by joining two tables together, and asking for something like:
SELECT
    *
FROM t1 AS t1
JOIN t2 AS t2
  ON t1.id = t2.id
WHERE t1.thing = 'something'
OR    t2.thing = 'something';
Of course, sufficiently complex filtering clauses will likely turn into case expressions, which I’ve seen cause more performance headaches that I’m happy to recall.
The main issue is, of course, performance, and figuring out what a reasonable index, or set of indexes might be.
To some, the idea of needing multiple indexes on a single table to make one query perform well might seem counterintuitive overkill. To anyone who has had to deal with interval queries, it’s a fact of life.
You might hate to hear this, but proper indexing isn’t enough in every case, and the point of this post is to show you how to rewrite queries so that SQL Server can use your indexes well.
The main problem is that certain query transformations, like index intersection and index union, which may be appropriate, might be costed much higher than a clustered index scan, or a seek/scan plus lookup.
Anyway, let’s get a move on. I can only be a young and good looking consultant for so long, here.
Not So Fast
If you have perfect indexes because you’re a perfect indexer, I’m happy for you.
Most people I do work for are not in that camp, nor even in that forest. Some may be blissfully unaware of camps and forests.
That’s okay though, because that’s what I get paid for.
Let’s say you have this index. It’s a good attempt at a good index.
CREATE INDEX
    p1
ON dbo.Posts
    (OwnerUserId, LastEditorUserId, Score)
WITH
    (SORT_IN_TEMPDB = ON, DATA_COMPRESSION = PAGE);
It’s a good attempt at a good index because this is the query it’s for.
SELECT
    p.*
FROM dbo.Posts AS p
WHERE
(
     p.OwnerUserId = 22656
  OR p.LastEditorUserId = 22656
)
AND p.Score > 0;
You might look at this arrangement and think: This is my greatest work. I’ll be able to seek to OwnerUserId, and then apply residual predicates on LastEditorUserId and Score.
I mean, maybe not those exact words. You might have other things you’re proud of. Hopefully those turn out better.
Zero Seeks
If you’re the type of person — and I like this type of person — who looks at the query plan, you’ll be just as sore as a sunburn after looking at this one.
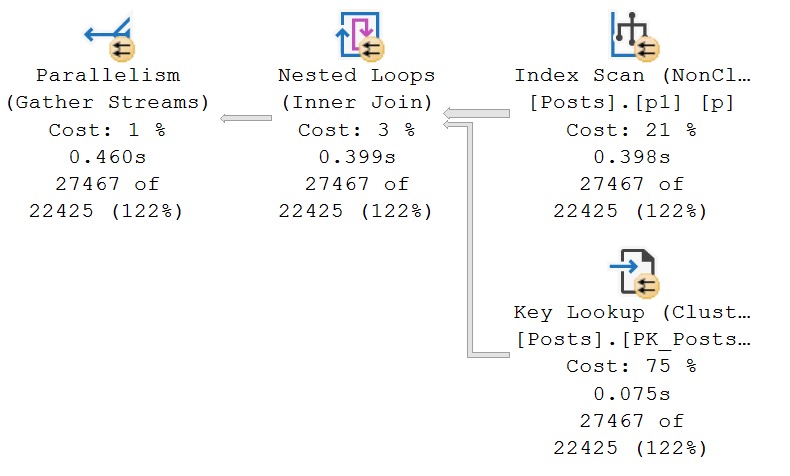
If you’re the type of person — and I like this type of person — who tries query hints when they don’t get their way, you might try a FORCESEEK hint here.
Unfortunately, you’ll remain in your sore state.
Msg 8622, Level 16, State 1, Line 28
Query processor could not produce a query plan because of the hints defined in this query.
Resubmit the query without specifying any hints and without using SET FORCEPLAN.
If you’re keen to play along at home and create and index with Score first, you’re going to get a seek, but a very disappointing one. There is no improvement in performance.
Okay, so what happened?
Breakdown
It’s really tough to get a seek with an OR on the two leading columns of an index. Sure, you could put Score first, but Score > 0 is about as selective as you at last call.
Of course, I mean that you’ll take whatever drink your friend comes back from the bar with. Don’t be lewd.

SQL Server done flipped that all upside down, didn’t it? Score is first, the OR clause is second. What a nuisance.
The problem of course is that we have two distinct sets of predicates:
- OwnerUserId = 22656 and Score > 0
- LastEditorUserId = 22656 and Score > 0
And the index we have doesn’t allow us to access the data in that way. No single index would, but two separate indexes would.
If we express out query in a slightly different way, that’s easier to see.
SELECT
    p.*
FROM
(
    SELECT
        p.*
    FROM dbo.Posts AS p
    WHERE p.OwnerUserId = 22656
    AND   p.Score > 1000

    UNION ALL

    SELECT
        p.*
    FROM dbo.Posts AS p
    WHERE p.LastEditorUserId = 0
    AND p.Score > 1000
) AS p;
Here’s the query plan for that:
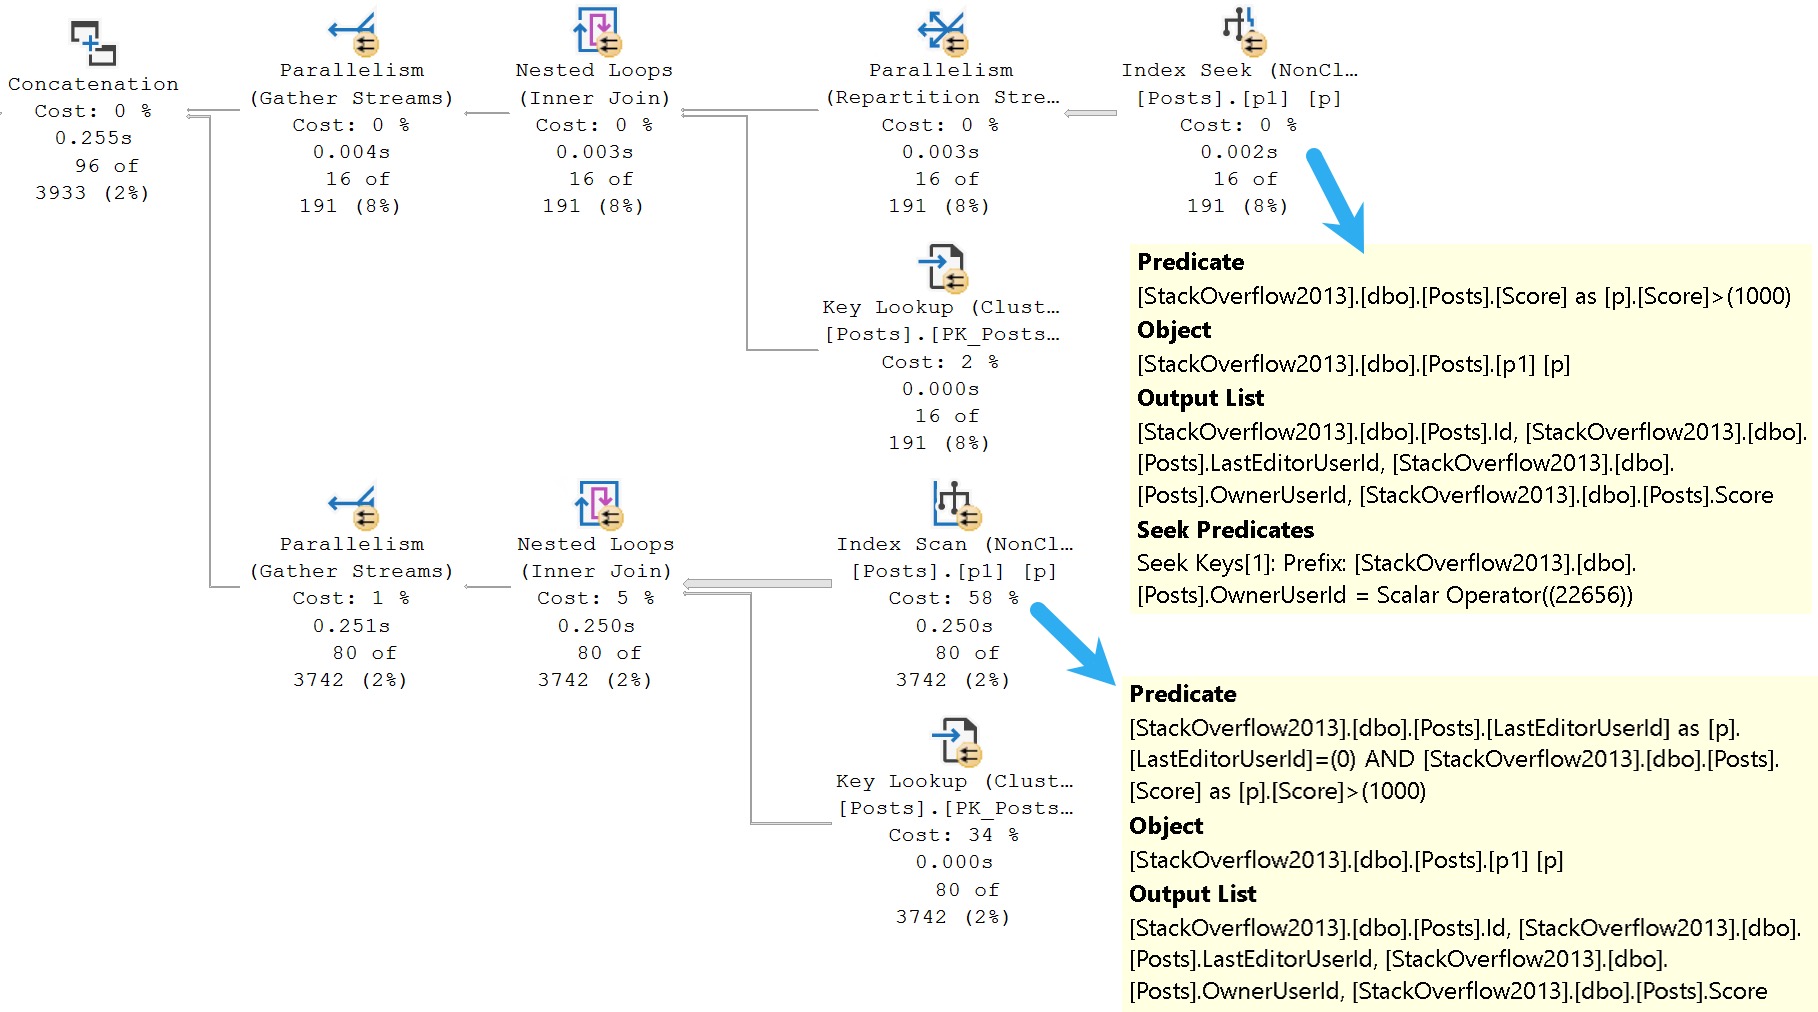
It may make more sense seeing this query plan, because you can see the optimizer’s dilemma a little better now.
While it’s possible to seek to OwnerUserId, and then evaluate Score, it’s not possible to seek to LastEditorUserId (regardless of a predicate on Score).
LastEditorUserId is the second key column, which means it’s not ordered in a helpful way for seeks to happen.
Different Drum
To get both sets of predicates to behave, you’d need two indexes like these:
CREATE INDEX
    p2
ON dbo.Posts
    (LastEditorUserId, Score)
WITH
    (SORT_IN_TEMPDB = ON, DATA_COMPRESSION = PAGE);

CREATE INDEX
    p3
ON dbo.Posts
    (OwnerUserId, Score)
WITH
    (SORT_IN_TEMPDB = ON, DATA_COMPRESSION = PAGE);
This allows for each set of predicates to be evaluated efficiently, even using the original query pattern with an OR predicate.
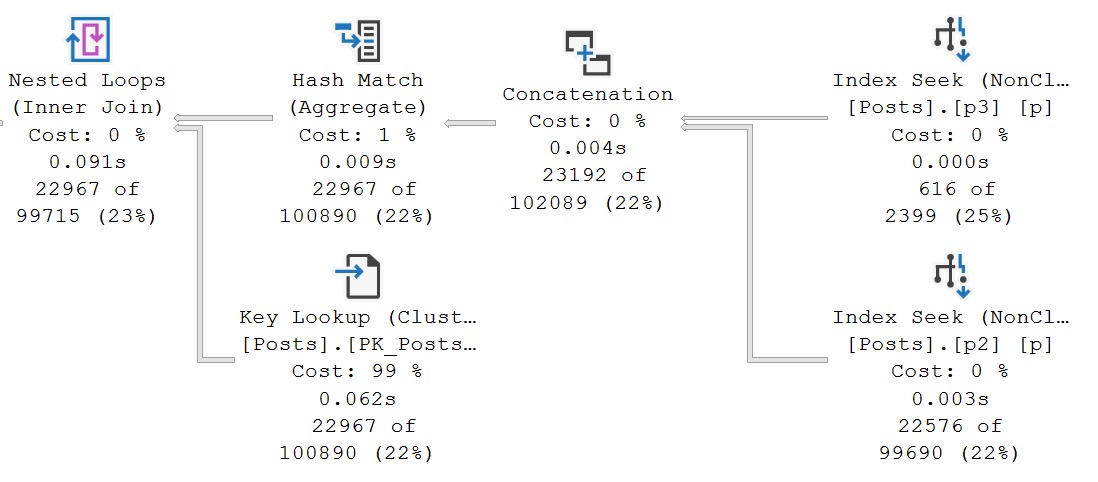
And we have the elusive index union plan that I mentioned earlier.
The two new indexes are used, sought into, union all-ed together, aggregated, and finally there’s a lookup in the plan to retrieve all the columns in Posts that aren’t covered by them.
The optimizer doesn’t often choose plans like this, and it’s not always good when it does, but these indexes do pretty well here because the predicate combinations are selective.
Of Join And Where And Or
SQL Server’s cost based optimizer is good at implying many things from the clutches of your calamitous queries, or so I’m told.
It’s quite an amazing piece of work, but it has a lot of problems.
I suppose that’s common with models, whether they’re cost models or runway models. Perhaps I should spend the next 15 years of my life studying runway models to be sure.
For example, if I have a query like this:
SELECT TOP (1)
    c.Id
FROM dbo.Posts AS p
JOIN dbo.Comments AS c
  ON p.OwnerUserId = c.UserId
WHERE p.OwnerUserId = 22656;
SQL Server is accurately able to figure out that the only number I care about is 22656, because one of the join columns is in the where clause. The query plan looks about like so:
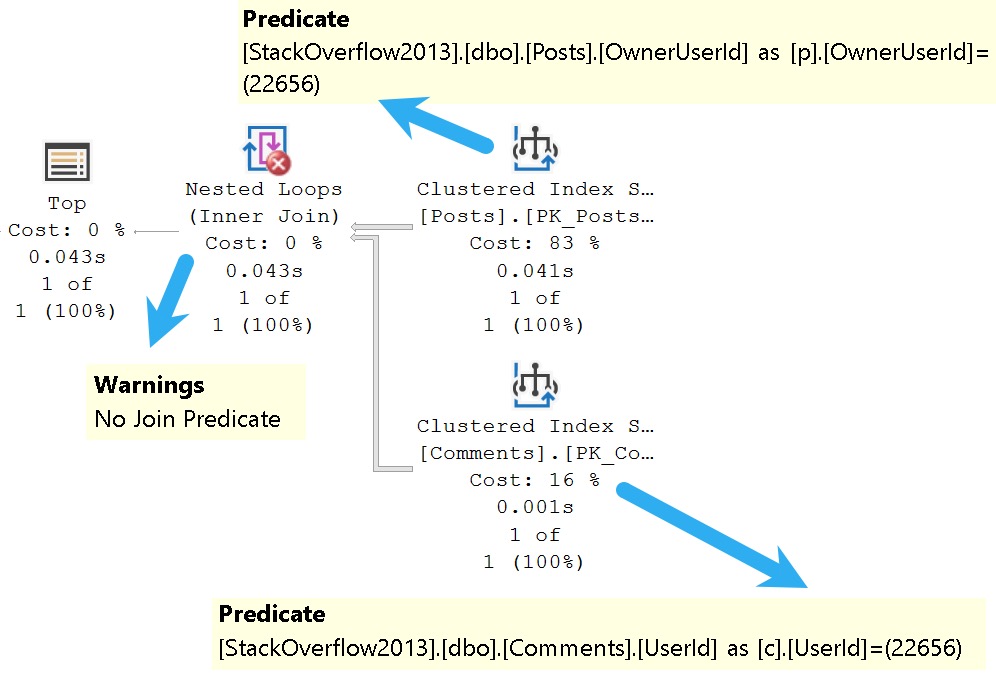
There’s a seek on both sides of the join specifically to a value in each index, which means only rows with matching values will be projected from either side into the join.
And yet, we have a warning that there’s no join predicate. Curse of the summer intern.
Where the optimizer is somewhat less good at such inferences is, of course, when you get OR clauses involved.
Here’s an example! I love examples. Grand things, those.
SELECT
    c = COUNT_BIG(*)
FROM dbo.Comments AS c
JOIN dbo.Votes AS v
  ON c.PostId = v.PostId
WHERE c.PostId = 138
OR    v.UserId = 831;
You might laugh and wonder who would ever write a query like this, but it’s far from uncommon to see a game of mix and match across tables and columns in the where clause.
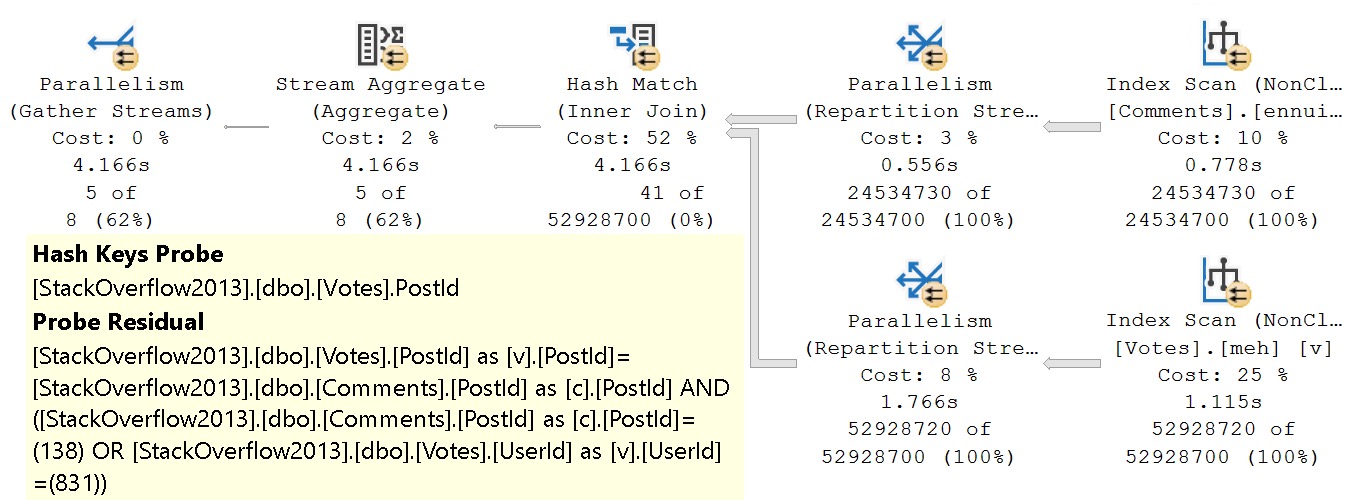
The unbearable weirdness of OR strikes again.
The entire join and where clause is evaluated at the hash join. There’s probably a good reason for it, but it’s late and I’m not feeling overly charitable in researching it.
If we rewrite the where clause a bit, here’s what we end up with:
SELECT
    c = COUNT_BIG(*)
FROM dbo.Comments AS c
JOIN dbo.Votes AS v
  ON c.PostId = v.PostId
WHERE v.PostId = 138
OR    v.UserId = 831;
The only change is that I’m using the PostId column from the Votes tables instead of the PostId column from the Comments table here.
And would it surprise you that the query plan ends up not being a miserable sofa? I hope not.

The secret of course, is having some good-enough indexes hanging around to help you locate all your precious data. I’m sure I’ve mentioned they’re important a time or two.
Here’s what I have:
CREATE INDEX
    meh
ON dbo.Votes
    (PostId, UserId)
WITH
    (MAXDOP = 8, SORT_IN_TEMPDB = ON, DATA_COMPRESSION = PAGE);

CREATE INDEX
    eh
ON dbo.Votes
    (UserId, PostId)
WITH
    (MAXDOP = 8, SORT_IN_TEMPDB = ON, DATA_COMPRESSION = PAGE);

CREATE INDEX
    ennui
ON dbo.Comments
    (PostId)
WITH
    (MAXDOP = 8, SORT_IN_TEMPDB = ON, DATA_COMPRESSION = PAGE);
And yet, even with all those pretty little indexes, the first query stunk it up worse than the easter egg I’m probably gonna find in a couple months behind a radiator.
Pitting good indexes against poorly written queries is just cruel.
Won’t someone think of the indexes?
Of Join And Or
Joins with OR clauses fare no better. It’s an unfortunate convenience for those writing queries, because it’s incredible inconvenient for the optimizer.
There are likely some shortcomings that the optimizer team could address in this space, but some join logic is probably more than they’d like to take a chance on.
A simple two-table join with an OR clause would be easy enough, but let’s look at one that isn’t so straightforward.
First, some very generous indexes:
CREATE INDEX
    v
ON dbo.Votes
    (PostId)
INCLUDE
    (BountyAmount)
WHERE
    (BountyAmount IS NOT NULL)
WITH
    (SORT_IN_TEMPDB = ON, DATA_COMPRESSION = PAGE);

CREATE INDEX
    p
ON dbo.Posts
    (AcceptedAnswerId, Id)
WITH
    (SORT_IN_TEMPDB = ON, DATA_COMPRESSION = PAGE);

CREATE INDEX
    p2
ON dbo.Posts
    (PostTypeId, Id)
WITH
    (SORT_IN_TEMPDB = ON, DATA_COMPRESSION = PAGE);
Look how generous I am with my indexes. The most generous and most humble indexer, they call me.
Query Time, Excellent
Here’s what we’re working with from a query perspective!
SELECT
    c = COUNT_BIG(*)
FROM dbo.Posts AS p
JOIN dbo.Posts AS p2
  ON  p.Id = p2.AcceptedAnswerId
JOIN dbo.Votes AS v
  ON p.Id = v.PostId
  OR p2.AcceptedAnswerId = v.PostId
WHERE v.BountyAmount IS NOT NULL
AND   p.PostTypeId = 2
AND   p2.AcceptedAnswerId > 0;
What makes this like more of a challenge is that Posts is joined to itself, and columns from each make up the join predicate to Votes.
What makes this kind of stupid is that this is all inner joins, even taking potential row duplication into account from a many to many relationship, it could be simplified from:
FROM dbo.Posts AS p
JOIN dbo.Posts AS p2
  ON p.Id = p2.AcceptedAnswerId
JOIN dbo.Votes AS v
  ON p.Id = v.PostId
  OR p2.AcceptedAnswerId = v.PostId
To
FROM dbo.Posts AS p
JOIN dbo.Posts AS p2
  ON p.Id = p2.AcceptedAnswerId
JOIN dbo.Votes AS v
  ON p.Id = v.PostId
Or
FROM dbo.Posts AS p
JOIN dbo.Posts AS p2
  ON p.Id = p2.AcceptedAnswerId
JOIN dbo.Votes AS v
  ON p2.AcceptedAnswerId = v.PostId
What’s particularly interesting, but somewhat difficult to describe well to the optimizer, is that any given question can only have one accepted answer, so there’s no many to many relationship with that join.
If we were to use the ParentId column instead of AcceptedAnswerId, it’d be a different story. One question can have many answers (but again, only one can be accepted as the answer).
This is a great reason to normalize your data, and not cram them full of parent/child relationships.
Fine Time
The query plan is quite typical of one with a join that contains an OR predicate. It takes just about six seconds.

If you’re keen on understanding the pattern, and it’s a good pattern to understand:
- 3.8 million rows hit the hash join
- One constant scan passes out rows for the Id column
- Another constant scan passes out rows for the AcceptedAnswerId column
- Merge Interval attempts to group overlapping values
It is a bit confusing at first glance, because of the two nested loops joins.
The outermost nested loops (next to the hash match) is of the apply variety, but SQL Server does all the work described above in order to reduce the number of times the Votes table would have to be accessed.
Since this is another OR condition, let’s think back to the first query we talked about, where a FORCESEEK hint produce an optimizer error because there was no readily seekable predicate.
If you’re the type of person — and I like this type of person — who tries query hints when they don’t get their way, you might try an OPTION(HASH JOIN) hint here.
But since hash joins require at least one equality predicate, you’ll get a rather familiar optimizer error. The OR condition produces a query plan with CompareOp="IS" in it, which is not the same as "EQ".
Fun With Rewrites
Part of the reason why Microsoft likely avoids this specific optimizer search space is that the logic required to get this right is somewhat involved.
Here’s the query I used to get a matching count. For this query, it’s safe to use EXISTS because you don’t need to project any columns out from the Posts table:
SELECT
    c = COUNT_BIG(*)
FROM dbo.Votes AS v
WHERE v.BountyAmount IS NOT NULL
AND   EXISTS
(
    SELECT
        p.Id
    FROM dbo.Posts AS p
    WHERE p.AcceptedAnswerId = v.PostId
    AND   p.AcceptedAnswerId > 0
    AND EXISTS
    (
        SELECT
            1/0
        FROM dbo.Posts AS p2
        WHERE p.Id = p2.AcceptedAnswerId
    )

    UNION ALL

    SELECT
        p.Id
    FROM dbo.Posts AS p
    WHERE p.Id = v.PostId
    AND   p.PostTypeId = 2
    AND EXISTS
    (
        SELECT
            1/0
        FROM dbo.Posts AS p2
        WHERE p.Id = p2.AcceptedAnswerId
    )
);
If you needed to do that, you would use CROSS APPLY.
SELECT
    c = COUNT_BIG(*)
FROM dbo.Votes AS v
CROSS APPLY
(
    SELECT
        p.Id
    FROM dbo.Posts AS p
    WHERE p.AcceptedAnswerId = v.PostId
    AND   p.AcceptedAnswerId > 0
    AND EXISTS
    (
        SELECT
            1/0
        FROM dbo.Posts AS p2
        WHERE p.Id = p2.AcceptedAnswerId
    )

    UNION ALL

    SELECT
        p.Id
    FROM dbo.Posts AS p
    WHERE p.Id = v.PostId
    AND   p.PostTypeId = 2
    AND EXISTS
    (
        SELECT
            1/0
        FROM dbo.Posts AS p2
        WHERE p.Id = p2.AcceptedAnswerId
    )

) AS p
WHERE v.BountyAmount IS NOT NULL;
The query plans are close enough to identical to not show you twice.
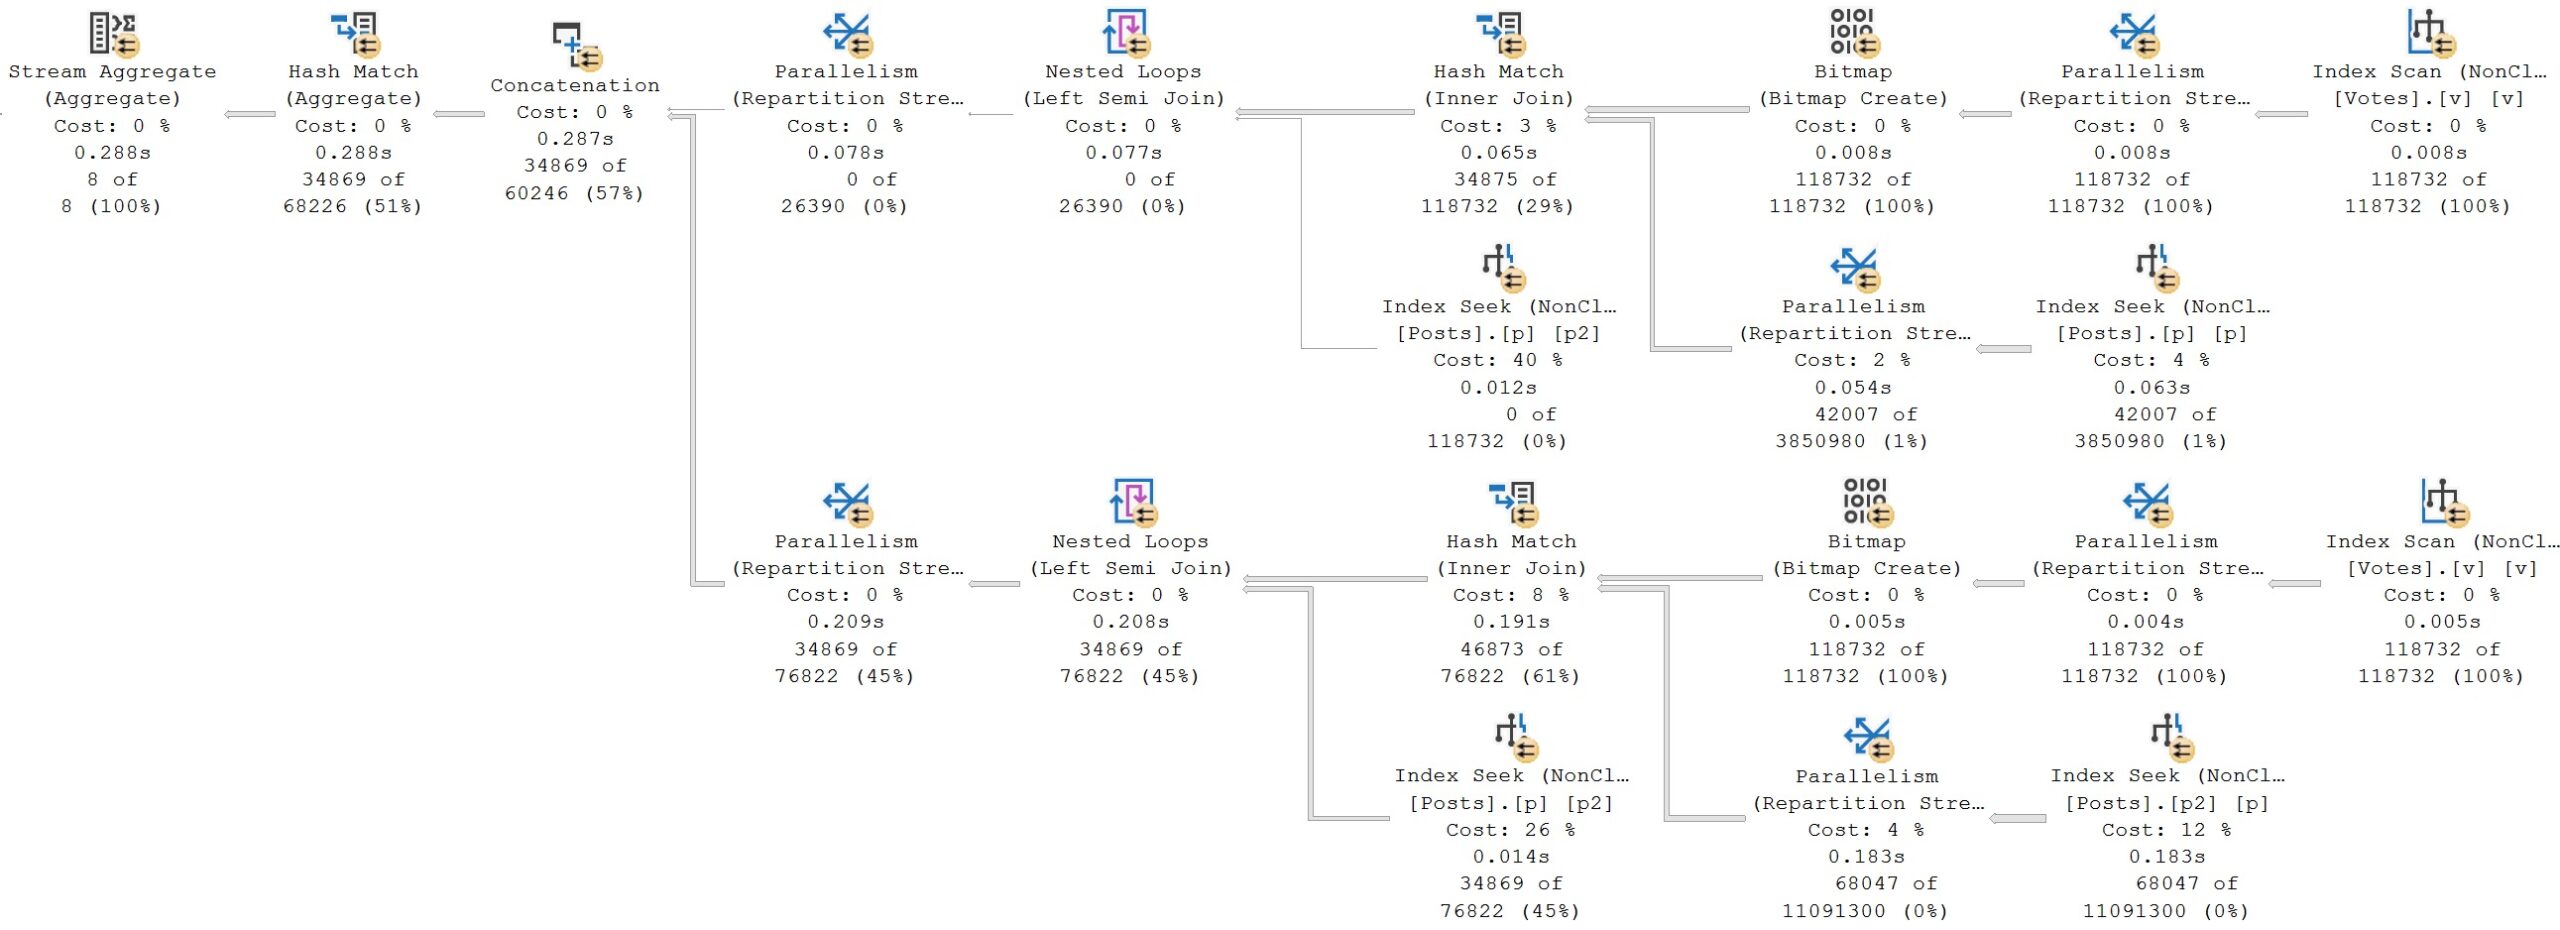
Is it bigger? Yes.
Was the query longer? Yes.
But if you’ve been following this series, or my blog posts in general, you’ll know that it’s quite rare that shortcuts and conveniences get you anywhere with the optimizer.
Case Closed
Something I mentioned early on in the post, with an element of obvious foreshadowing, is the use of case expressions in join and where clauses.
While they’re not precisely the same thing as OR clauses, they are conditional logic, which can do a decent job of mangling up performance.
Here’s our setup, index-wise:
CREATE INDEX
    p
ON dbo.Posts
    (Score, PostTypeId, OwnerUserId)
WITH
    (SORT_IN_TEMPDB = ON, DATA_COMPRESSION = PAGE);

CREATE INDEX
    u
ON dbo.Users
    (CreationDate, Reputation, AccountId)
INCLUDE
    (DisplayName)
WITH
    (SORT_IN_TEMPDB = ON, DATA_COMPRESSION = PAGE);
And here’s the query we’ll be looking at:
SELECT
    u.Id,
    u.DisplayName,
    s = SUM(p.Score)
FROM dbo.Posts AS p
JOIN dbo.Users AS u
  ON 1 = CASE
             WHEN p.PostTypeId IN (1, 2)
             AND  p.OwnerUserId = u.Id
             THEN 1
             WHEN p.PostTypeId > 2
             AND  p.OwnerUserId = u.AccountId
             THEN 1
             ELSE 0
         END
WHERE u.CreationDate >= '20131231 23:00'
AND   1 = CASE
              WHEN p.Score >= 1
              AND  u.Reputation >= 10
              THEN 1
              ELSE 0
          END
GROUP BY
    u.Id,
    u.DisplayName
ORDER BY
    s DESC;
I’ve seen enough nightmare-fuel queries like this to include it in the mix, because I never want to see one of these again.
Just kidding! I want to see yours and fix them for you. Show me all of them. Bring out the whole gang. My soul is prepared.
Avert Your Eyes
Here’s the query plan we get from this query.
The only thing that isn’t terrible is the one part of the where clause that isn’t wrapped up in some derived dilemma, which is the predicate on CreationDate.

The TL;DR here is that:
- We can seek to CreationDate because it’s the leading index key and not part of the case expression
- We can’t seek to anything in the Posts table at all
- The entire filtering process occurs at the Nested Loops join
If you’re paying careful attention to row counts, this filthy animal runs for 45 seconds to return a single row.
That’s a terrible row to seconds ratio.
Rewrites for this will be similar to others, so hopefully you’re not sick of those just yet.
Rewrite Your Eyes
Whenever I’m rewriting small, compact, sorta stubby looking queries, I like to think of myself as Willy Wonka stretching out Mike Teavee.
Queries like that remind me a bit of the character himself. Rewriting them into more sensible forms with better attitudes does take a bit of stretching out.
SELECT
    u.Id,
    u.DisplayName,
    s = SUM(p.Score)
FROM
(
    SELECT
        u.Id,
        u.AccountId,
        u.DisplayName
    FROM dbo.Users AS u
    WHERE u.Reputation >= 10
    AND   u.CreationDate >= '20131231 23:00'
) AS u
CROSS APPLY
(
    SELECT
        p.*
    FROM dbo.Posts AS p
    WHERE p.PostTypeId IN (1, 2)
    AND   p.OwnerUserId = u.Id
    AND   p.Score >= 1

    UNION ALL

    SELECT
        p.*
    FROM dbo.Posts AS p
    WHERE p.PostTypeId > 2
    AND   p.OwnerUserId = u.AccountId
    AND   p.Score >= 1
) AS p
GROUP BY
    u.Id,
    u.DisplayName
ORDER BY
    s DESC;
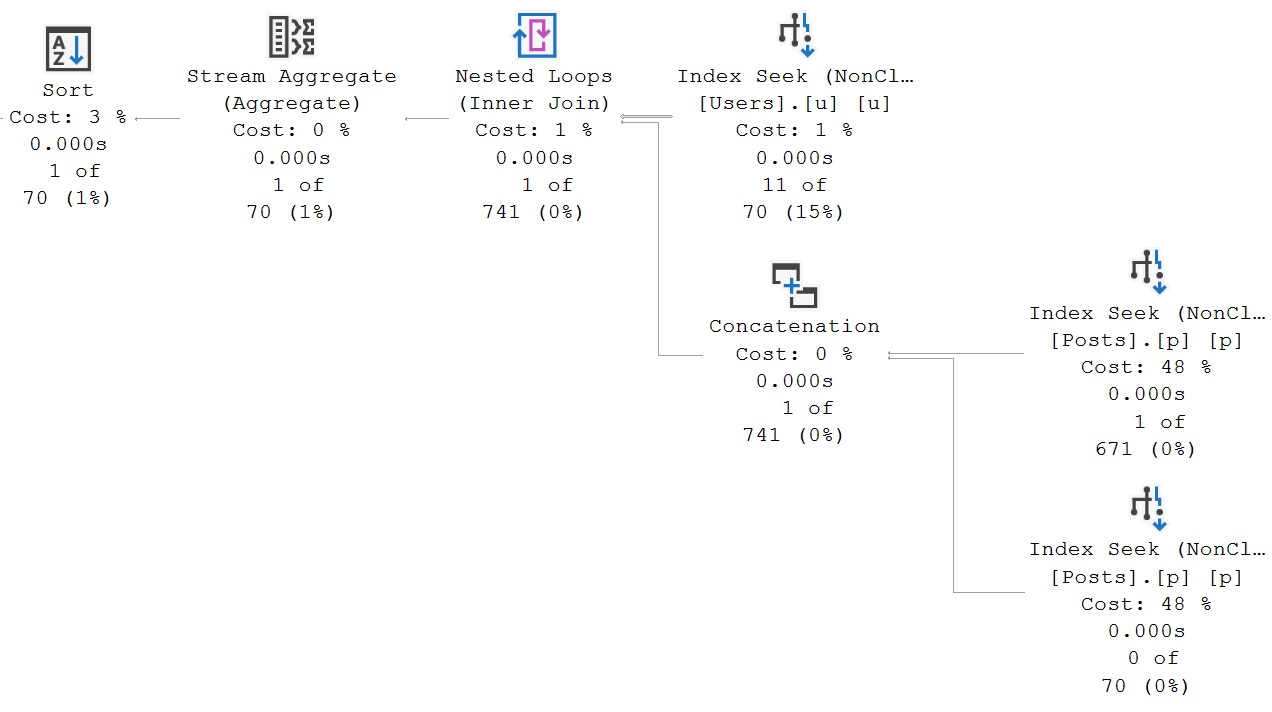
And of course, when you do better, SQL Server does better. And when SQL Server does better, everyone’s happy.
Why don’t you want to be happy?
A Shorter Note
At the beginning of the post, I also mentioned a different type of query, using OR to safeguard optional parameters from NULL values.
While I’m not going to delve into that here, because I’d like to do an entire post in this series on dynamic SQL, I’d like to add a single quick note: Don’t be afraid of OPTION(RECOMPILE).
It’s a huge problem solver for so many different types of queries having so many different kinds of problems:
- Parameter sensitivity
- Local variables
- Optional parameters
If you’re ever unsure about query performance, and you’re not quite sure what’s wrong with it, you can do a whole lot worse than seeing if this at least gets you a different execution plan.
While it’s not perfect or practical as a long term solution for some situations, don’t dismiss it as a tool of exploration when you’re working on a problem query.
I’ve apparently tipped my hat a bit that dynamic SQL is a future subject for this series. After that, I’m not sure what else might come up. If there’s anything you’d like to see that you haven’t seen so far, leave a comment.
Thanks for reading!
Going Further
If this is the kind of SQL Server stuff you love learning about, you’ll love my training. I’m offering a 75% discount to my blog readers if you click from here. I’m also available for consulting if you just don’t have time for that, and need to solve database performance problems quickly. You can also get a quick, low cost health check with no phone time required.
