Things SQL Server vNext Should Address: Make Dynamic SQL Easily Traceable

An Attempt


One tricky thing about working with dynamic SQL is that it’s rather unaccountable. You have a stored procedure, you build up a string, you execute it, and no one wants to claim responsibility.

Like a secret agent, or an ugly baby.

It would be nice if sp_executesql had an additional parameter to assign an object id to the code block so that when you’re looking at the plan cache or Query Store, you know immediately where the query came from.

Here’s an example.

A Contempt


Let’s use this as an example:

CREATE OR ALTER PROCEDURE dbo.dynamo
AS
SET NOCOUNT, XACT_ABORT ON;
BEGIN

    DECLARE
        @sql nvarchar(MAX) = N'';
    
    SELECT TOP (1)
        b.*
    FROM dbo.Badges AS b
    WHERE b.UserId = 22656
    ORDER BY b.Date DESC

    SELECT
        @sql = N'    
    /*dbo.dynamo*/
    SELECT
        c = COUNT_BIG(*)
    FROM dbo.Users AS u
    JOIN dbo.Posts AS p
        ON p.OwnerUserId = u.Id;    
        ';
    
    EXEC sys.sp_executesql
        @sql;
    
END;
GO

This is, by all accounts, Properly Written Dynamic SQL™

I know, this doesn’t need to be dynamic SQL, but I don’t need a great example of that to show what I mean. The first query is there to get the proc to show up anywhere, and the dynamic SQL is there to show you that… dynamic SQL doesn’t show up as associated with the proc that called it.

If we execute the proc, and then look for the details of it in Query Store, all we get back it the first query.

EXEC dbo.dynamo;
GO 

EXEC sp_QuickieStore
    @database_name = 'StackOverflow2013',
    @procedure_schema = 'dbo',
    @procedure_name = 'dynamo';
GO
twenty minutes

It sure would be nice to know that this proc executed a whole other query.

A Temp


There’s no great workaround for this, but you can at least get a hint that something else happened if you dump the dynamic SQL results into a temp table.

CREATE OR ALTER PROCEDURE dbo.dynamo_insert
AS
SET NOCOUNT, XACT_ABORT ON;
BEGIN

    DECLARE
        @sql nvarchar(MAX) = N'';

    CREATE TABLE
        #results
    (
        c bigint
    );
    
    SELECT TOP (1)
        b.*
    FROM dbo.Badges AS b
    WHERE b.UserId = 22656
    ORDER BY b.Date DESC

    SELECT
        @sql = N'    
    /*dbo.dynamo*/
    SELECT
        c = COUNT_BIG(*)
    FROM dbo.Users AS u
    JOIN dbo.Posts AS p
        ON p.OwnerUserId = u.Id;    
        ';
    
    INSERT
        #results WITH(TABLOCK)
    (
        c
    )    
    EXEC sys.sp_executesql
        @sql;

    SELECT
        r.*
    FROM #results AS r
    
END;
GO

This still sucks though, because we don’t know what the dynamic portion of the query did.

one catch

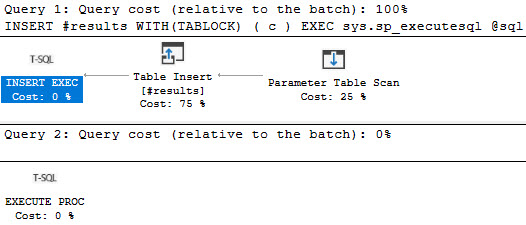
The query plan looks like this, with no real details or metrics:
break room

A Fix


It would be super if sp_executesql took an additional parameter in the context of a stored procedure that could be assigned to a @@PROCID.

EXEC sys.sp_executesql
    @sql,
    @object_id = @@PROCID;

This would avoid all the headless dynamic SQL horsemen running around, and make it easier to locate procedure statements by searching for the procedure that executes them, rather than having to search a bunch of SQL text for a commented proc name.

Sure, it’s fine if you stumble across dynamic SQL with a comment pointing to the procedure that runs it, but I hardly see anyone doing that.

Thanks for reading!

Going Further


If this is the kind of SQL Server stuff you love learning about, you’ll love my training. I’m offering a 75% discount to my blog readers if you click from here. I’m also available for consulting if you just don’t have time for that and need to solve performance problems quickly.
Wait Stats During Exchange Spills In SQL Server Parallel Query Plans

Inorganic


Lots of people say these are rare — and perhaps they are becoming more so — but I still see them with some frequency. That’s not a terribly strong indictment of SQL Server, but that’s not the point of this blog or of my work.

Exchange spills are particularly interesting, and I’ve written about them a couple times:

For each query we run, we’re gonna execute the query, and then this query to look at session level wait stats.

SELECT
    desws.*
FROM sys.dm_exec_session_wait_stats AS desws
WHERE desws.session_id = @@SPID
ORDER BY desws.wait_time_ms DESC;

Turns Out


The first thing to understand here is that the memory grant itself doesn’t matter. That’s why there’s no hint for it on this query, as there have been in the others.

WITH 
    precheck AS 
(
    SELECT
        u.Id, 
        p.Id AS PostId,
        p.AcceptedAnswerId,
        n = 
            ROW_NUMBER() OVER
            (
                ORDER BY
            	    u.Id
            )
    FROM dbo.Users AS u
    JOIN dbo.Posts AS p
        ON p.OwnerUserId = u.Id
    WHERE  u.CreationDate > '20110825' 
    AND    u.Reputation > 100 
    AND    p.PostTypeId = 1
)
SELECT 
    u.*, 
    p.*
FROM precheck p
JOIN dbo.Users AS u
    ON p.Id = u.Id
WHERE ISNULL(p.n, u.Id) = 0
ORDER BY u.Id, u.Reputation
OPTION(USE HINT('ENABLE_PARALLEL_PLAN_PREFERENCE'), MERGE JOIN);

We do need to ask for a parallel merge join, because parallel merge joins were a mistake and should not have optimizer support.

Thanks for watching.

Back Brain


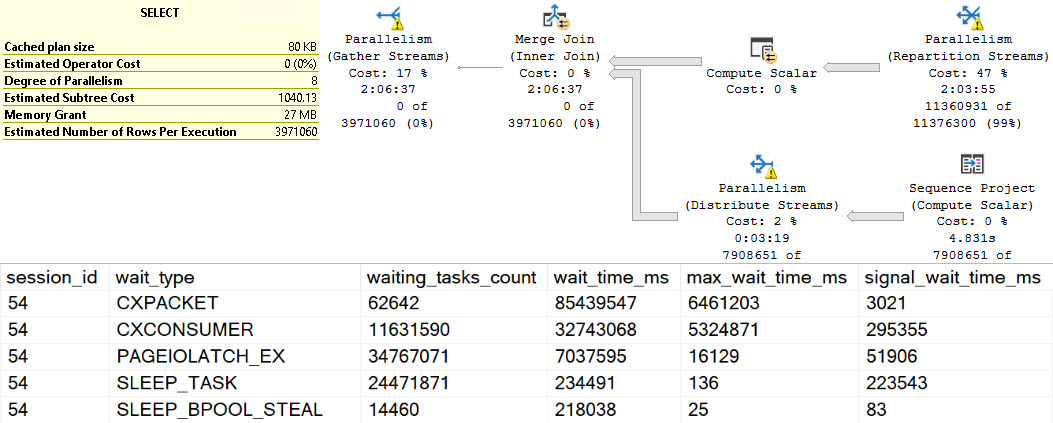
The waits here are interesting. At the top, we have perhaps high expected waits on parallelism, because the spills are encountered at parallel exchanges.

SQL Server Query Plan
ouch

There are quite high waits on PAGEIOLATCH_EX, SLEEP_TASK, and SLEEP_BPOOL_STEAL rounding out the top five. This is quite interesting, because I’ve never explicitly thought of PAGEIOLATCH_EX waits in the context of exchange spills. Normally, I think of them when queries read pages from disk into memory for modification.

Going down the line, SLEEP_TASK is familiar from our time spent with hash spills, but SLEEP_BPOOL_STEAL is so far undocumented anywhere.

One can make some inferences based on the name about what it might be doing, but… It could also be a bit of a catch-all wait, like other waits that can be generated by spills.

From Me


Going further, the other interesting waits encountered here look like so:

SQL Server Query Plan
fields

If I had a Magic Eight Ball out right now, it’d probably just go into convulsions. Perhaps SLEEP_TASK (shown one above) is another clear sign of a different kind of spill, but there’s so much else going on here it’s hard to tell for certain which waits this query generated were from the spill, and which were from other portions of the query executing regularly.

Points for hitting PREEMPTIVE waits, though.

To You


You weren’t mis-reading when you saw the query plan. This really did execute for over two hours. I tried to get another exchange spill into the mix by changing the query slightly, but all I got was a very cranky Repartition Streams.

WITH 
    precheck AS 
(
    SELECT
        u.Id, 
        p.Id AS PostId,
        p.AcceptedAnswerId,
        p.Body, --New
        n = 
            ROW_NUMBER() OVER
            (
                ORDER BY
            	    u.Id
            )
    FROM dbo.Users AS u
    JOIN dbo.Posts AS p WITH(INDEX = p)
        ON p.OwnerUserId = u.Id
    WHERE  u.CreationDate > '20110825' 
    AND    u.Reputation > 100 
    AND    p.PostTypeId = 1
)
SELECT 
    u.*, 
    p.*
FROM precheck p
JOIN dbo.Users AS u
    ON p.Id = u.Id
WHERE ISNULL(p.n, u.Id) = 0
ORDER BY u.Id, u.Reputation
OPTION(USE HINT('ENABLE_PARALLEL_PLAN_PREFERENCE'), MERGE JOIN);

And it ran for an extra 45 or so minutes, too.

SQL Server Query Plan
discard


Ugly Baby


The results for this second query wait stats wise are just an amplified version of the original, of course.

SQL Server Wait Stats
gun tricks

Obviously dragging the Body column around had a rather profound influence on things.

Whole And Wet


These waits are perhaps less obvious than other spills, though one could make reasonable assumptions about SLEEP_TASK waits here as well.

I’d be concerned about any query emitting high amounts of it, or any server with high amounts of it compared to uptime.

It seems unfortunate that there’s no wait directly tied to hash spills, but perhaps when we’re all living in some quantum batch mode reality in the cloud it won’t matter at all.

Thanks for reading!

Going Further


If this is the kind of SQL Server stuff you love learning about, you’ll love my training. I’m offering a 75% discount to my blog readers if you click from here. I’m also available for consulting if you just don’t have time for that and need to solve performance problems quickly.

Wait Stats During Hash Spills In SQL Server Query Plans

Jam Job


Hash spills are, as we’ll see, sometimes identified by a different wait than sort spills. In small quantities, spills are often not worth bothering with. But when they pile up, they can really cause some severe performance issues.

In this post, I want to show that both Hash Aggregates and Joins can cause the same wait type, along with some evidence that strings make things worse.

In all the queries, I’m going to be using the MAX_GRANT_PERCENT hint to set the memory grant ridiculously low, to make the waits I care about stick out.

For each query we run, we’re gonna execute the query, and then this query to look at session level wait stats.

SELECT
    desws.*
FROM sys.dm_exec_session_wait_stats AS desws
WHERE desws.session_id = @@SPID
ORDER BY desws.wait_time_ms DESC;

Merch Pants


First up, a highly doctored hash aggregate:

SELECT   
    c.CreationDate, 
    c.PostId, 
    c.Score, 
    c.UserId
FROM dbo.Comments AS c
GROUP BY 
    c.CreationDate, 
    c.PostId, 
    c.Score, 
    c.UserId
HAVING COUNT_BIG(*) > 2147483647 
OPTION(HASH GROUP, QUERYRULEOFF GenLGAgg, MAX_GRANT_PERCENT = 0.0);

But the important thing here is that there are no strings involved.

SQL Server Query Plan
clean

The spill goes on for about two minutes and twenty seconds, in row mode, at DOP 8.

That sure is bad, but in the words of Sticky Fingaz: Bu-bu-bu-but wait it gets worse.

Foolproof Plan


Let’s pull out another highly doctored hash aggregate, this time with our friend the Text column.

SELECT   
    c.CreationDate, 
    c.PostId, 
    c.Score, 
    c.Text, 
    c.UserId
FROM dbo.Comments AS c
GROUP BY 
    c.CreationDate, 
    c.PostId, 
    c.Score, 
    c.Text, 
    c.UserId
HAVING COUNT_BIG(*) > 2147483647 
OPTION(HASH GROUP, QUERYRULEOFF GenLGAgg, MAX_GRANT_PERCENT = 0.0);

We see more of our friend SLEEP_TASK. Again, many other things may add to this wait, but holy hoowee, this is hard to ignore.

SQL Server Query Plan
intro

That’s a solid — heck, let’s just call it 18 minutes — of spill time. That’s just plain upsetting.

Filthy.

And Join


Causing the same problem where a Hash Join is in play will exhibit the same wait.

SELECT 
    c.*
FROM dbo.Votes AS v
LEFT JOIN dbo.Comments AS c
    ON v.PostId = c.PostId
WHERE ISNULL(v.UserId, c.UserId) > 2147483647
OPTION(MAX_GRANT_PERCENT = 0.0);
SQL Server Query Plan
jacket, no shirt

Now we get stuck spilling for about 21 minutes, which is also awkward and uncomfortable.

Funkel


We’ve looked at sort spills being the cause of IO_COMPLETION waits, and hash spills being the cause of SLEEP_TASK waits.

Again, if you see a lot of these waits on your servers, you may want to check out the query here to find plans in the cache that are selects that cause writes, for reasons explained in the linked post.

Tomorrow we’ll wake up bright and early to look at which waits crop up during exchange spills.

Thanks for reading!

Going Further


If this is the kind of SQL Server stuff you love learning about, you’ll love my training. I’m offering a 75% discount to my blog readers if you click from here. I’m also available for consulting if you just don’t have time for that and need to solve performance problems quickly.
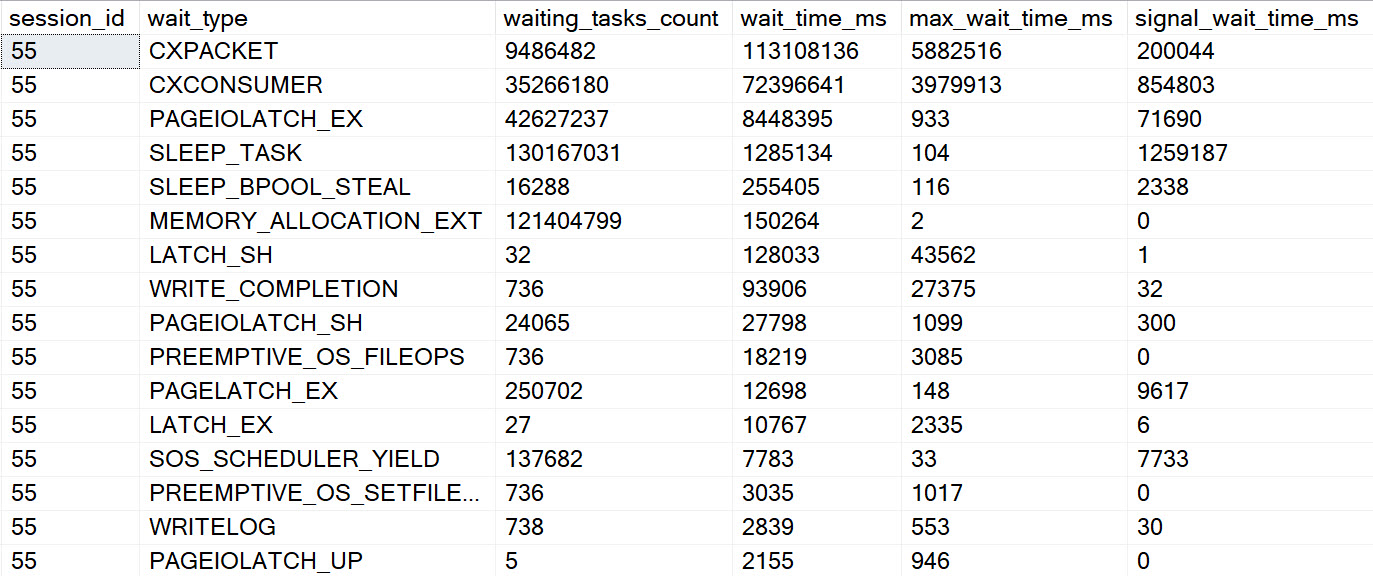
Wait Stats During Sort Spills In SQL Server Query Plans

Over Under


Over the next few days, I’m going to look at the wait stats that show up during different types of spills of different sizes. For no reason whatsoever, I’m going to start with sort spills. I’ll also cover hash and exchange spills, in case you were wondering just how long you’d have to sit here reading about them.

The point is not that spills are the sole things that cause these waits, it’s just to give you some things to potentially watch out for if you see these waits piling up and can’t pin down where they’re coming from.

In all the queries, I’m going to be using the MAX_GRANT_PERCENT hint to set the memory grant ridiculously low to make the waits I care about stick out.

For each query we run, we’re gonna execute the query, and then this query to look at session level wait stats.

SELECT
    desws.*
FROM sys.dm_exec_session_wait_stats AS desws
WHERE desws.session_id = @@SPID
ORDER BY desws.wait_time_ms DESC;

No Strings Attached


Strings are horrible. The bigger they are, they worse they are. Nearly every time I see oversized string columns, I see them causing problems.

File that under obvious foreshadowing while we look at a sort that doesn’t involve any strings.

SELECT 
    c.Id, 
    c.CreationDate, 
    c.PostId, 
    c.Score, 
    c.UserId
FROM 
(
    SELECT 
        c.Id, 
        c.CreationDate, 
        c.PostId, 
        c.Score, 
        c.UserId,
        n = 
            ROW_NUMBER() OVER 
            ( 
                ORDER BY 
                    c.PostId DESC 
            )
    FROM dbo.Comments AS c
) AS c
WHERE c.n = 0
OPTION(MAX_GRANT_PERCENT = 0.0);

This query executes at DOP 8 in row mode, and the primary wait that racks up is IO_COMPLETION.

SQL Server Query Plan
big hands

Strings Attached


Remember when I told you to file that thing up there under another thing? Here’s why.

In this query, we’re also going to select the Text column from the Comments table , which is an nvarchar(700).

SELECT 
    c.Id, 
    c.CreationDate, 
    c.PostId, 
    c.Score, 
    c.Text, --New
    c.UserId
FROM 
(
    SELECT 
        c.Id, 
        c.CreationDate, 
        c.PostId, 
        c.Score, 
        c.Text, --New
        c.UserId,
        n = 
            ROW_NUMBER() OVER 
            ( 
                ORDER BY 
                    c.PostId DESC 
            )
    FROM dbo.Comments AS c
) AS c
WHERE c.n = 0
OPTION(MAX_GRANT_PERCENT = 0.0);

In this case, things get way worse. If you’re surprised, you should try reading blog posts; particularly this one.

SQL Server Query Plan
a-heh-hem

Rather than ~16 seconds of spilling, we end up with a bit over four minutes of spilling. This is as the Mayans foretold, but the 2012 calendar was drunk and got the last two digits backwards.

Incomplete


Again, there are many potential causes of this wait, but on servers where I see them really piling up and ending up in top waits, there tends to be a dearth of memory and a lot of queries spilling to disk during sorts.

If you see this wait piling up, you may want to check out the query here to look for select queries that cause writes, which can indicate spills (among other things).

Thanks for reading!

Going Further


If this is the kind of SQL Server stuff you love learning about, you’ll love my training. I’m offering a 75% discount to my blog readers if you click from here. I’m also available for consulting if you just don’t have time for that and need to solve performance problems quickly.

Spinning Disk Mentality In SQL Server: Why You Don’t Need To Defragment Indexes Or Change Fill Factor

Pervasive


I often have to talk clients down from odd ledges. At this point, there’s about 20 years of advice about SQL Server out there, and for various reasons received wisdom often gets migrated en masse, whether it’s still applicable or not.

Outdated trace flags and settings are pretty common, and don’t get me started on coding practices.

But I get it — that stuff came along with advice that still makes sense — like parallelism and memory settings, separating off tempdb, etc.

Unfortunately, it often leads people to the “it used to be fast so it should always be fast” trap based on what used to work, rather than what makes sense currently. Or even what the current problem is.

And to avoid making any meaningful changes, they often double down on bad ideas and flail around with nonsensical ones.

Surprise and Dismay


Some advice made a lot of sense when you had servers on old spinning disks, and 32bit software with 2-3GB of RAM available for user space tasks.

You just couldn’t cache much data, and every time those disk heads had to pick up and spin about, things got creaky. Modern storage tends to avoid such dilemmas, but people still treat it like a record player that might skip if they rub a little too much funk on their Roger Rabbit.

Things like changing fill factor and constant index maintenance just aren’t the problem solvers they used to be, back when I/O — especially the random variety — was quite a nuisance to accomplish. SSD, Flash, and RAM just don’t have those moving pieces for you to concern yourself with.

I’m not saying there’s not a time a place to make those changes, but I am saying that the ROI on them is much lower than it used to be.

Pick On


Not surprisingly, I see people doing quite irresponsible things without measuring any metric particular to the what setting(s) they’re changing. The only expected outcome seems to be nods of approval if it “seems faster” or “got a little better”.

This process also seems to avoid determining what actual problems are, and focusing on a bit of advice from one of three blog posts by an author from 2009 where none of the pictures load and the code formatting is just italicized text.

And hey, look, if that’s your fetish, cool. There’s certainly some invaluable gems out there that Microsoft has managed to not delete yet, or migrate for the eleventeenth time and break every link in existence by tacking a GUID to the end of it.

The conversation usually goes something like:

lung

“Why is fill factor 60 on every index?”

“To cut down on page splits.”

“Did you have a lot of those?”

“I don’t know, xxVanWilderFan420xx said they were bad and we should avoid them.”

Well, okay then.

I suppose cargo culting around things that don’t work at least makes you look busy.

After all, you can just copy and paste that italicized code and F5 your way to nowhere.

And Chew


I’m probably guilty of this too, with things I don’t quite understand or I’m not knowledgeable about.

A while back I had an issue with Windows BSODs constantly, and all the advice I could find came from posts on NVIDIA forums (dated 2012, of course) that suggested rebuilding the ESET database and doing a clean install of the drivers.

Did I try it? You bet I did.

Did I try it more than once? You’re on a roll if you said yes.

But all it did was prolong fixing the real problem, which turned out to be some RAM that had gone bad.

Thanks for reading!

Going Further


If this is the kind of SQL Server stuff you love learning about, you’ll love my training. I’m offering a 75% discount to my blog readers if you click from here. I’m also available for consulting if you just don’t have time for that and need to solve performance problems quickly.

Some Stack Exchange Questions I’ve Answered Recently

Good Citizen


When I have spare time, I answer questions over at the Database Administrators Stack Exchange site.

Here are some recent ones that I’ve found interesting:

If you like this style of Q&A, I’d highly suggest signing up and contributing. It’s a great way to share and learn.

Thanks for reading!

Going Further


If this is the kind of SQL Server stuff you love learning about, you’ll love my training. I’m offering a 75% discount to my blog readers if you click from here. I’m also available for consulting if you just don’t have time for that and need to solve performance problems quickly.

SARGability Week: Wrap Up

One Metric Week


This went on a bit longer than I thought it would, but to someone who tries to blog five days a week, that’s a good thing.

While this isn’t the most glamorous subject in the world, it seems it’s still a necessary one to write about. I don’t quite know how to feel about that, as I’ve read and written about it many times over the past 10 or so years.

Thanks for reading!

Going Further


If this is the kind of SQL Server stuff you love learning about, you’ll love my training. I’m offering a 75% discount to my blog readers if you click from here. I’m also available for consulting if you just don’t have time for that and need to solve performance problems quickly.

SARGability Week: Why Implicit Conversions Aren’t SARGable

President Precedence


Data types are one of those core things you need to get right. Whether it’s matching types between join columns, or between parameters and predicates, not doing so can really squash application performance in quite similar ways to writing non-SARGable predicates.

That’s because — wait for it — a lot of the stuff we’ve talked about over the last week that can happen with poorly written predicates can happen with poorly matched data types, too.

The main thing to remember, is that aside from max datatypes, what matters most in a situation with implicit conversion is that it doesn’t take place on a column. If it happens on a parameter or variable it’s far less of an issue, but it can still cause oddities in query plans, and with cardinality estimation.

Speak And Spell


Most of the problems I see with implicit conversion is with other datatypes being compared to nchar/nvarchar types, but not always.

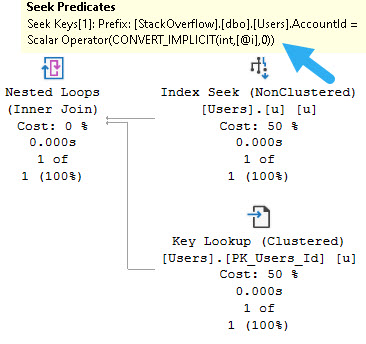
For example, this query results in an index seek despite a variable declared as nvarchar(11).

DECLARE 
    @i nvarchar(11) = N'22656';

SELECT
   u.*
FROM dbo.Users AS u
WHERE u.AccountId = @i;
GO 

Note that the convert_implicit function is applied to the variable, and not the AccountId column.

SQL Server Query Plan
cameo

Cahn


To show an example of when implicit conversions act the same way was non-SARGable predicates, let’s make a crappy copy of some columns from the Users table.

DROP TABLE IF EXISTS
    dbo.UsersBad;

SELECT u.Id,
       ISNULL
       (
           CONVERT
           (
               varchar(40), 
               u.DisplayName
           ), 
           ''
       ) AS DisplayName,
       ISNULL
       (
           CONVERT
           (
               nvarchar(11), 
               u.Reputation
           ), 
           ''
       ) AS Reputation
INTO dbo.UsersBad
FROM dbo.Users AS u;

ALTER TABLE dbo.UsersBad 
    ADD CONSTRAINT PK_UsersBad_Id 
        PRIMARY KEY CLUSTERED (Id);

CREATE INDEX ur ON dbo.UsersBad(Reputation);
CREATE INDEX ud ON dbo.UsersBad(DisplayName);

Here, we’re converting DisplayName from nvarchar, and Reputation from an int. We’re also creating some indexes that will be rendered nearly useless by implicit conversions.

CREATE OR ALTER PROCEDURE 
    dbo.BadUsersQuery
(
    @DisplayName nvarchar(40),
    @Reputation  int
)
AS
BEGIN

    SELECT 
        u.DisplayName
    FROM dbo.UsersBad AS u
    WHERE u.DisplayName = @DisplayName;

    SELECT
        Reputation = 
            MAX(u.Reputation)
    FROM dbo.UsersBad AS u
    WHERE u.Reputation = @Reputation;

END;
GO 

EXEC dbo.BadUsersQuery 
    @DisplayName = N'Eggs McLaren',
    @Reputation = 1787;

Imaging


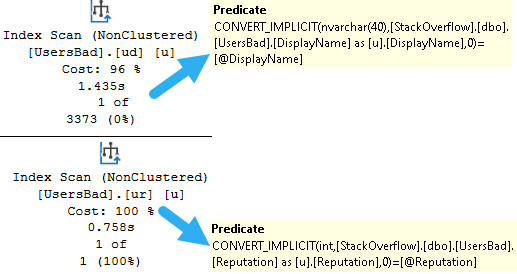
For both of these, the convert_implicit winds up on the column rather than on the parameter.

SQL Server Query Plan
whew

And that’s what makes for the type of implicit conversion that causes most performance problems I see.

This is a relatively small table, so the hit isn’t too bad, but comparatively it’s much worse, like in all the other examples of SARGability we’ve seen lately.

Aware


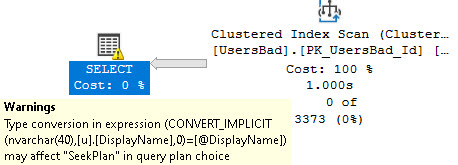
I think most people who do performance tuning regularly are quite aware of this problem. There’s even a query plan warning about it, for those who don’t.

It’s definitely a good problem to solve, but it often leads to finding other problems. For example, we get the seek predicate warning regardless of if there’s an index we can seek to. If I drop all the indexes off of the UsersBad table and run a query like this, we still get a warning:

DECLARE
    @DisplayName nvarchar(40);

SELECT 
    u.DisplayName
FROM dbo.UsersBad AS u
WHERE u.DisplayName = @DisplayName;
SQL Server Query Plan
well no

It’s also worth noting that getting rid of the implicit conversion — much like fixing other non-SARGable predicates — may reveal missing index requests that weren’t there before.

DECLARE
    @DisplayName nvarchar(40) = N'Eggs McLaren';

SELECT 
    u.*
FROM dbo.UsersBad AS u
WHERE u.DisplayName = @DisplayName;
GO 

DECLARE
    @DisplayName varchar(40) = 'Eggs McLaren';

SELECT 
    u.*
FROM dbo.UsersBad AS u
WHERE u.DisplayName = @DisplayName;
GO
SQL Server Query Plan
relief

Haunch


Solving implicit conversion issues is just as important (and often easier) than solving other issues with SARGable predicates, and just as important.

Even though it’s one of the first performance problems people learn about, I still see it out there enough to write about it. I think a lot of the reason that it still crops up is because ORMs leave developers detached from the queries, and they don’t see how parameter types end up getting inferred when not strongly typed.

Anyway, that’s it for this series. Tomorrow’s post will be a wrap up with links.

Thanks for reading!

Going Further


If this is the kind of SQL Server stuff you love learning about, you’ll love my training. I’m offering a 75% discount to my blog readers if you click from here. I’m also available for consulting if you just don’t have time for that and need to solve performance problems quickly.

SARGability Week: Using Indexed Views To Make Predicates SARGable

Boniface


There are some things that, in the course of normal query writing, just can’t be SARGablized. For example, generating and filtering on a windowing function, a having clause, or any other runtime expression listed here.

There are some interesting ways to use indexed views to our advantage for some of those things. While windowing functions and having clauses can’t be directly in an indexed view, we can give an indexed view a good definition to support them.

I Don’t Care For It


Starting with these indexes to help things along, they don’t really do as much as we’d hope.

CREATE INDEX c
ON dbo.Comments (PostId);

CREATE INDEX v
ON dbo.Votes (PostId);

CREATE INDEX p
ON dbo.Posts (Id, OwnerUserId, Score);

This query has to process a ton of rows, and no matter what we set the having expression to, the entire result set has to be generated before it can be applied. We could set it to > 0 or > infinity and it would take the same amount of time to have a working set to apply it to.

SELECT 
    p.OwnerUserId,
    TotalScore = 
        SUM(ISNULL(p.Score * 1., 0.)),
    records = 
        COUNT_BIG(*)
FROM dbo.Posts AS p
JOIN  dbo.Comments AS c
    ON c.PostId = p.Id
JOIN dbo.Votes AS v
    ON v.PostId = p.Id
GROUP BY 
    p.OwnerUserId
HAVING 
    SUM(ISNULL(p.Score * 1., 0.)) > 5000000.
ORDER BY
    TotalScore DESC;

Limited Liability


I know that having clause looks funny there, but it’s not my fault. The sum of Score ends up being a really big integer, and overflows the regular sized integers unless you explicitly convert it to a bigint or implicitly convert it to something floaty. The isnull is there because the column is NULLable, which is unacceptable to an indexed view.

So, here we are, forced to write something weird to conform.

Sizzling. Sparkling.

SQL Server Query Plan
grumble

Ignoring the woefully misaligned and misleading operator times, we can see in the query plan that again(!) a late Filter operator is applied that aligns with the predicate in our having clause.

Sarging Ahead


Let’s work some magic, here.

CREATE VIEW 
    dbo.BunchaCrap
WITH 
    SCHEMABINDING
AS
SELECT 
    p.OwnerUserId,
    TotalScore = 
        SUM(ISNULL(p.Score * 1., 0.)),
    records = 
        COUNT_BIG(*)
FROM dbo.Posts AS p
JOIN  dbo.Comments AS c
    ON c.PostId = p.Id
JOIN dbo.Votes AS v
    ON v.PostId = p.Id
GROUP BY 
    p.OwnerUserId;
GO 

CREATE UNIQUE CLUSTERED INDEX bc ON dbo.BunchaCrap(OwnerUserId);

This gives us an indexed view with the TotalScore expression materialized, which means we can search on it directly now without all the 50 some-odd seconds of nonsense leading up to it.

At The Mall


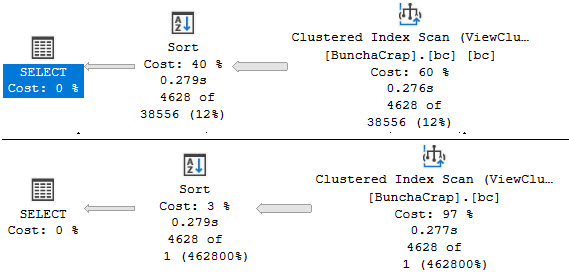
Our options now are either to query the indexed view directly with a noexpand hint, or to run the query as initially designed and rely on expression matching to pick up on things.

SELECT 
    bc.*
FROM dbo.BunchaCrap AS bc WITH (NOEXPAND)
WHERE bc.TotalScore > 5000000.
ORDER BY bc.TotalScore DESC;

In either case, we’ll get this query plan now:

SQL Server Query Plan
mutt and jeff

Which looks a whole heck of a lot nicer.

Tomorrow, we’ll look at how implicit conversion can look a lot like non-SARGable predicates.

Thanks for reading!

Going Further


If this is the kind of SQL Server stuff you love learning about, you’ll love my training. I’m offering a 75% discount to my blog readers if you click from here. I’m also available for consulting if you just don’t have time for that and need to solve performance problems quickly.

SARGability Week: Rewriting Scalar User Defined Functions To Make Them SARGable

Cheap Replica


The bottom line on scalar UDFs is that they’re poison pills for performance.

They’re bad enough in the select list, but they get even worse if they appear in join or where clause portions of the query.

The example query we’re going to use doesn’t even go out and touch other tables, which can certainly make things worse. It does all its processing “in memory”.

CREATE FUNCTION dbo.nonsargable(@d datetime)
RETURNS bit
WITH SCHEMABINDING,
     RETURNS NULL ON NULL INPUT
AS 
BEGIN

RETURN
(
    SELECT 
        CASE 
            WHEN DATEDIFF
                 (
                     DAY, 
                     @d, 
                     GETDATE()
                 ) > 30
            THEN 1
            ELSE 0
        END
);

END;
GO

Much Merch


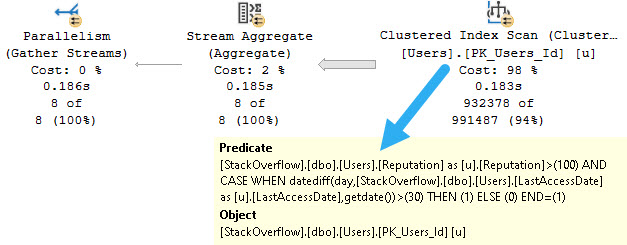
When we run this query, the plan is a messmare.

SELECT
    c = COUNT_BIG(*)
FROM dbo.Users AS u
WHERE u.Reputation > 100
AND   dbo.nonsargable(u.LastAccessDate) = 1;
SQL Server Query Plan
that again

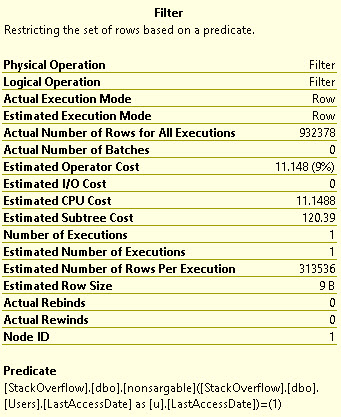
The Filter operator is a familiar face at this point.

SQL Server Query Plan
mask up

The function has to run once per row that leaves the Users table, and the predicate has to be calculated and evaluated later at the filter operation.

Twisty


If we look in dm_exec_function_stats, we can see just how many times, and how much CPU the function used when we ran just this one query:

look out below

If you pay extra special attention, you’ll noticed that the execution_count here exactly matches the number of rows that pass through the Filter operator above.

The way to fix this is to  rewrite the function as an inline table valued function.

CREATE FUNCTION dbo.nonsargable_inline(@d datetime)
RETURNS TABLE
WITH SCHEMABINDING
AS 
RETURN

    SELECT 
        b = 
        CASE 
            WHEN DATEDIFF
                 (
                     DAY, 
                     @d, 
                     GETDATE()
                 ) > 30
            THEN 1
            ELSE 0
        END;

GO

Now we don’t have all those scalar problems.

Save The Wheels


We have to call our function a little bit differently, but that’s far less of a big deal.

SELECT
    c = COUNT_BIG(*)
FROM dbo.Users AS u
WHERE u.Reputation > 100
AND   (
          SELECT
              * 
          FROM dbo.nonsargable_inline(u.LastAccessDate)
       ) = 1;

And our query can go parallel, and take way less than 10 seconds.

SQL Server Query Plan
drones

While the predicate isn’t exactly ideal, in this case I’ll deal with it, and maybe even add some better indexes if I need to. At 183 milliseconds, I don’t need to do that right now.

Save The Feels


Scalar UDFs are still the downfall of many queries, and because this one has getdate in it, it can’t be inlined automatically in SQL Server 2019.

With simple enough functions, rewrites to inline table valued functions are easy enough. The more nonsense you put into the body of a function, the harder quick fixes get. I’ve spent days rewriting some that ran into the thousands of lines, and it’s not a pretty process.

Tomorrow we’re going to look at how indexed views can help you solve SARGability issues.

Thanks for reading!

Going Further


If this is the kind of SQL Server stuff you love learning about, you’ll love my training. I’m offering a 75% discount to my blog readers if you click from here. I’m also available for consulting if you just don’t have time for that and need to solve performance problems quickly.