Why You Should Attend PASS Data Summit This Year

Promo Video


I couldn’t have said it better myself. Registration is here.

Going Further


If this is the kind of SQL Server stuff you love learning about, you’ll love my training. I’m offering a 75% discount to my blog readers if you click from here. I’m also available for consulting if you just don’t have time for that, and need to solve database performance problems quickly. You can also get a quick, low cost health check with no phone time required.

A Little About Windowing Functions And Joins In SQL Server

Do Best


Going Further


If this is the kind of SQL Server stuff you love learning about, you’ll love my training. I’m offering a 75% discount to my blog readers if you click from here. I’m also available for consulting if you just don’t have time for that, and need to solve database performance problems quickly. You can also get a quick, low cost health check with no phone time required.

T-SQL Tuesday: 164, The Feelings Roundup #tsqltuesday

Headline News


For this most recent T-SQL Tuesday, I challenged bloggers (using the term challenge weakly here) to think of the last time code they saw made them feel a feeling.

I wasn’t terribly specific about what kind of feelings were in play, and so I kind of expected some negative ones to creep in. Most of the results were overwhelmingly positive.

This challenge made me realize that code, like people, comes in all shapes and sizes. And that code, like music, has quite a wide audience. Some folks get down with the Bieber, and others need a full symphony to locate their jollies.

I’m not judging here, just making a casual observation. Just don’t wear a t-shirt of the language to the conference, and we’re still cool.

Anyway, on the roundup!

Comment Section


I’m curating these from the comment section of my post, in order. Here at Darling Data, we strive for fairness in all things.

Extended Viewing


If you wrote a post that didn’t ping back to me, or you didn’t leave a comment with the link, please let me know so I can add it here.

Thanks for reading!

Going Further


If this is the kind of SQL Server stuff you love learning about, you’ll love my training. I’m offering a 75% discount to my blog readers if you click from here. I’m also available for consulting if you just don’t have time for that, and need to solve database performance problems quickly. You can also get a quick, low cost health check with no phone time required.

Introducing sp_HealthParser: Digging Deep Into The System Health Extended Event Session

Boredom and XML


Get the code here!

I recently found myself in the midst of a client issue that lead me to need a bunch of corroborating data from the system health extended event session.

There’s hardly any good documentation on it, and even fewer well-written queries or resources for parsing data out of it.

So now I’m making it easy for you, because I care about you more that Microsoft does.

If you need further proof of that, just look at the Query Store or Extended Events GUI.

Now look at sp_QuickieStore and sp_HumanEvents.

Who loves you, baby? I do.

Activated Development


Since this is currently in beta, it’s missing a lot of the bells and whistles that my other stored procedures have.

Right now, it just pulls all of the useful performance data out that I can get at:

  • Queries with significant waits
  • Top waits by count
  • Top waits by duration
  • Potential IO issues
  • CPU usage details
  • Memory usage details
  • Critical system health issues
  • CPU intensive queries
  • An incredibly nerfed blocked process report
  • Query plans for blocked queries

I know that there’s gobs of data around errors and security and all that jazz, but that stuff is often irrelevant to what I’m trying to coax out of a SQL Server.

In the future, I’ll be doing what I can to make sure I’m pulling all of the performance-related event data that I can, and trying to add some analysis and additional filtering to each section.

If you have any feedback, please open issues on GitHub.

Get the code here!

Going Further


If this is the kind of SQL Server stuff you love learning about, you’ll love my training. I’m offering a 75% discount to my blog readers if you click from here. I’m also available for consulting if you just don’t have time for that, and need to solve database performance problems quickly. You can also get a quick, low cost health check with no phone time required.

sp_HumanEventsBlockViewer: Update Roundup!

Busy Bee


I’ve been spending a lot of time lately working on my free scripts. And, I know, I’ve been recording videos about them, but some folks out there like to read things.

In this post, I’m going to talk about a couple cool changes to sp_HumanEventsBlockViewer, a procedure I wrote to analyze the blocked process report via Extended Events, and wish I had given a snazzier name to.

You see, when I wrote it, I pictured it as a utility script for sp_HumanEvents, which will set up the blocked process report and an extended event. But it turns out I use it a lot more on its own.

Go figure.

Well, you live and your learn. Sometimes.

Plans!


It used to be that there was a column in the output with SQL handles pulled from the blocked process report, and you could take those SQL handles and run Your Favorite Plan Cache Script to (maybe) find the plans for those queries.

That’s clunky, as a wise man once said. Now, there’s an additional result set with all of the available cached plans related to the blocked/blocking queries.

It will look something like this, and there are many related query execution metrics also returned. It just doesn’t make a good screenshot to capture them all.

metrical system

Priorities!


The findings results section used to only be sorted by the check ID. Through the magic of window functions and aggregates, I’m now also sorting the results by which database/objects/whatever had the highest amount of blocking.

It should look something like this:

get to it

The code that handles this is pretty cool, and it’s not something I’ve seen many people do. It’s an aggregate inside of a windowing function, that does something like this:

SELECT TOP (10)
    p.OwnerUserId,
    n = ROW_NUMBER() OVER
        (
            ORDER BY 
                COUNT_BIG(*) DESC
        )
FROM dbo.Posts AS p
GROUP BY
    p.OwnerUserId;

In a normal query, you could just sort by COUNT_BIG(*) DESC to order results, but when you’re putting results into a table to return later, the sorting won’t be preserved.

Assigning a row number to the aggregates means I can sort by check number, and then the row number within each check, to put the worst offenders up at the top.

Thanks for reading!

Going Further


If this is the kind of SQL Server stuff you love learning about, you’ll love my training. I’m offering a 75% discount to my blog readers if you click from here. I’m also available for consulting if you just don’t have time for that, and need to solve database performance problems quickly. You can also get a quick, low cost health check with no phone time required.

sp_PressureDetector: Update Roundup

Busy Bee


I’ve been spending a lot of time lately working on my free scripts. And, I know, I’ve been recording videos about them, but some folks out there like to read things.

In this post, I’ll be talking about some additions and changes to sp_PressureDetector, my script to quickly detect server bottlenecks like CPU, memory, disk, locking, and more. Well, maybe not more. I think that’s all of them.

Disk Metrics


I added  high-level disk metrics similar to what’s available in other popular scripts to mine. Why? Sometimes it’s worth looking at, to prove you should add more memory to a server so you’re less reliant on disk.

Especially in the cloud, where everything is an absolute hellscape of garbage performance that’s really expensive.

By default, I’ll show you results where either read or write latency is over 100ms, but you can change that with the following parameter:

EXEC dbo.sp_PressureDetector
    @minimum_disk_latency_ms = 5;
diskenstein

Results may vary. Mine look like this.

CPU Time


This only works for SQL Server Enterprise Edition right now, because it uses a DMV related to Resource Governor.

In the wait stats output, you’ll see how many hours of CPU time queries have consumed since server startup. I know, someone could clear out the Resource Governor stuff, but I’m willing to embrace that as an incredible rarity.

yay!

I’m also aware of the fact that I could get similar information from sys.dm_os_schedulers, but that’s only available in SQL Server 2016+, and I sometimes have to support older versions.

On the fence a bit about doing some checks, but right now it’s like…

  • Are we on Enterprise Edition? Use the Resource Governor thing
  • Are we on Standard Edition? Is it 2016 or better? Use the other thing
  • If not, then what?

I wrote a similar bit of code into sp_BlitzFirst, and the fallback is to sum all the CPU time from queries in the plan cache, but that’s awfully iffy. Most plan caches I see, all the plans are less than 24 hours old.

If I figure something else out, I’ll work on it, but for now I’m sticking with this.

New Columns


Down in the CPU details section, there are some new columns that detail things like

torso

These are useful, especially during THREADPOOL demos, ha ha ha.

Thanks for reading!

Going Further


If this is the kind of SQL Server stuff you love learning about, you’ll love my training. I’m offering a 75% discount to my blog readers if you click from here. I’m also available for consulting if you just don’t have time for that, and need to solve database performance problems quickly. You can also get a quick, low cost health check with no phone time required.
sp_QuickieStore: Update Roundup

Busy Bee


I’ve been spending a lot of time lately working on my free scripts. And, I know, I’ve been recording videos about them, but some folks out there like to read things.

Why haven’t I been writing lately? I haven’t felt like it. I’ve been enjoying getting my video recording set up worked out, even though one anonymous user hates that I clear my throat sometimes.

I can assure you, anonymous user, it would be far more unpleasant to listen to me talk with a bunch of allergy in my face. Tis the season, and all that.

Anyway, the next few posts are going to detail what I’ve been working on. This one is about sp_QuickieStore, which is my stored procedure to get and search through Query Store data.

All Of’Em


The first thing on the list that I want to talk about is the ability to cycle through all databases that have Query Store enabled.

If you have a lot of databases with it turned on, it can be a real hassle to go through them all looking for doodads to diddle.

Now you can just do this:

EXEC sp_QuickieStore 
    @get_all_databases = 1;

And through the magic of cursors, it’ll get all your worst queries in one go.

AdProc


The next thing is the ability to filter to a specific type of query, either ad hoc, or owned by a module.

Why? Well, sometimes I work on vendor systems where the user queries are submitted via ORM-type things, and more complicated background/overnight tasks are owned by stored procedures.

I also work on some systems where folks write stored procedures to touch vendor tables, and they want to focus on those because they can’t touch the vendor code.

For that, we can do this:

/*ad hoc*/
EXEC sp_QuickieStore 
    @query_type = 'a';

/*module*/
EXEC sp_QuickieStore 
    @query_type = 'literally any other letter in the alphabet';

I know this looks silly, but there’s no great way to differentiate what kind of module owns the code for non-ad hoc queries. View? Function? Procedure? Whatever.

If you care about only ad hoc queries, put an ‘a’ in there. If you care about code owned by modules, put anything else in there. That’s all it’s checking for, anyway.

Time Light Zone


This was a tough one to do, and it’s something that not even the Query Store GUI does correctly when searching through data.

/*time zone*/
EXEC sp_QuickieStore 
    @timezone = 'Eastern Standard Time';

/*time zone*/
EXEC sp_QuickieStore 
    @timezone = 'Eastern Standard Time',
    @start_date = '20230707 09:00 -04:00';

The first command will show you first and last execution times in whatever valid time zone you choose, which can be used to override the default behavior of displaying them in your server’s local time.

That’s cool and all, but now when you search through Query Store data based on start or end dates, I’ll convert your search to UTC time, which Query Store stores data in.

In the background, I find the difference in minutes between your local time and UTC, and manipulate your start and end dates to match.

Thanks for reading!

Going Further


If this is the kind of SQL Server stuff you love learning about, you’ll love my training. I’m offering a 75% discount to my blog readers if you click from here. I’m also available for consulting if you just don’t have time for that, and need to solve database performance problems quickly. You can also get a quick, low cost health check with no phone time required.

sp_HumanEventsBlockViewer: Now With 100% More Query Plans And Prioritized Results!

sp_HumanEventsBlockViewer: Now With 100% More Query Plans And Prioritized Results!


Going Further


If this is the kind of SQL Server stuff you love learning about, you’ll love my training. I’m offering a 75% discount to my blog readers if you click from here. I’m also available for consulting if you just don’t have time for that, and need to solve database performance problems quickly. You can also get a quick, low cost health check with no phone time required.

sp_QuickieStore: Time Zones, Time Zones, Time Zones

sp_QuickieStore: Time Zones, Time Zones, Time Zones


Going Further


If this is the kind of SQL Server stuff you love learning about, you’ll love my training. I’m offering a 75% discount to my blog readers if you click from here. I’m also available for consulting if you just don’t have time for that, and need to solve database performance problems quickly. You can also get a quick, low cost health check with no phone time required.

SQL Server: The Broken fn_xe_file_target_read_file Function

Extended Eventually


SQL Server has had the fn_xe_file_target_read_file function for a while, but starting with SQL Server 2017, a column called timestamp_utc was added to the output.

Somewhat generally, it would be easier to filter event data out using this column… if it worked correctly. The alternative is to interrogate the underlying extended event XML timestamp data.

That’s… not fun.

But if you write your query like this:

SELECT
    xml.wait_info
FROM
(
SELECT
    wait_info =
        TRY_CAST(fx.event_data AS xml)
FROM sys.fn_xe_file_target_read_file(N'system_health*.xel', NULL, NULL, NULL) AS fx
WHERE fx.object_name = N'wait_info'
AND   fx.timestamp_utc >= DATEADD(DAY, -1, SYSUTCDATETIME())
) AS xml
CROSS APPLY xml.wait_info.nodes('/event') AS e(x);

It will return no rows. Not ever. But at least the predicate is pushed down to a reasonable place: when you touch the file.

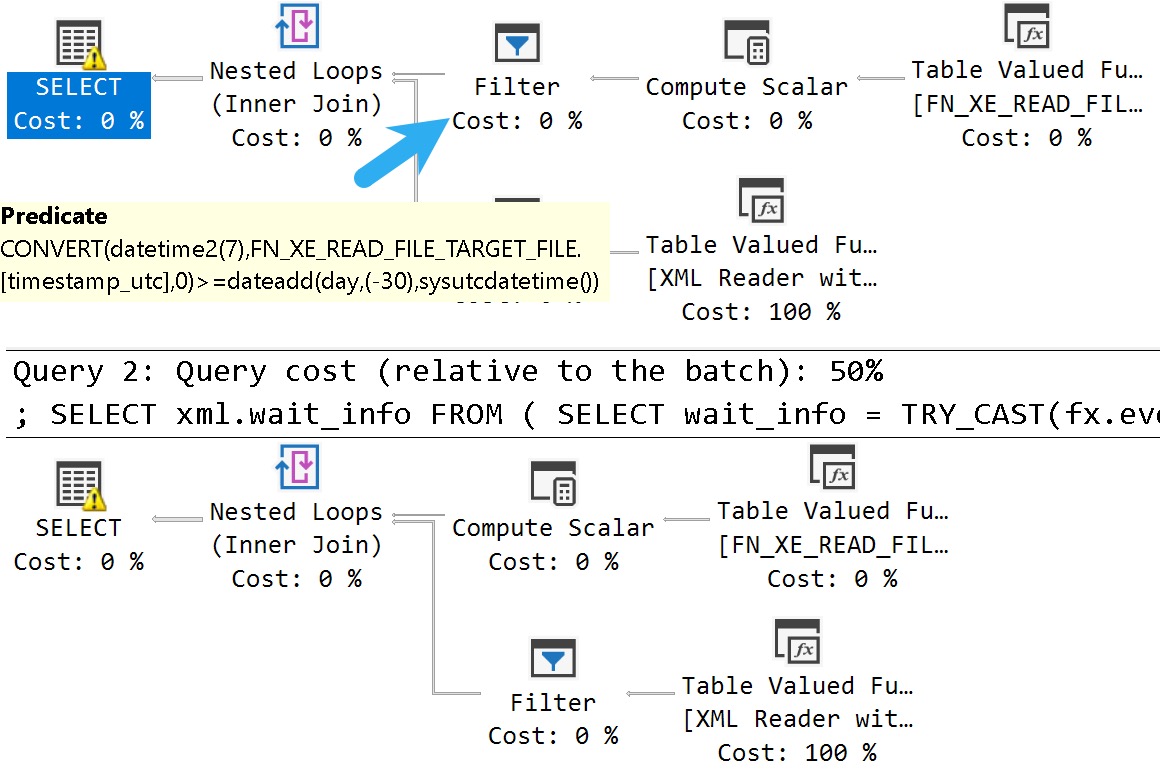
But if you write your query like this, it’ll work, at a cost:

SELECT
    xml.wait_info
FROM
(
SELECT
    wait_info =
        TRY_CAST(fx.event_data AS xml)
FROM sys.fn_xe_file_target_read_file(N'system_health*.xel', NULL, NULL, NULL) AS fx
WHERE fx.object_name = N'wait_info'
AND   CONVERT(datetime2(7), fx.timestamp_utc) >= DATEADD(DAY, -1, SYSUTCDATETIME())
) AS xml
CROSS APPLY xml.wait_info.nodes('/event') AS e(x);

The cost is an additional filter operator in the plan, which causes the entire file to be read and then filtered.

For large on-disk XML storage files, that can be really painful to deal with. It’s especially ugly because there’s no parallel read for these files.

There’s an open issue about this here that you should go and upvote.

Going Further


If this is the kind of SQL Server stuff you love learning about, you’ll love my training. I’m offering a 75% discount to my blog readers if you click from here. I’m also available for consulting if you just don’t have time for that, and need to solve database performance problems quickly. You can also get a quick, low cost health check with no phone time required.