Outlaw Buttons
Yesterday, we started with a query, and wanted to add an index to make it faster. Remember, indexes help queries find and relate data by putting it in order.
In the weird old days, we might use SET STATISTICS TIME, IO ON; to measure a query. If you’re still using old (unsupported) versions of SQL Server, I understand if you have to continue to use those.
For those of us living in the present (and near past), we can get the detail we need from actual execution plans.
Look, you’re probably getting those anyway if you’re trying to tune a query with any seriousness. You might as well make the most of them.
Something New
When most people look at execution plans, they neglect one of the most important parts: operator properties.
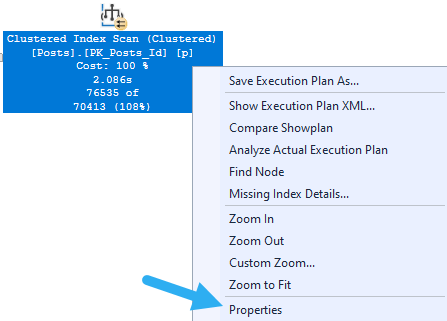
Once you got a plan in front of you, you can either highlight an operator and hit F4, or right click on one and choose “Properties”. A little window pane should appear over to the right in SSMS, and it’ll have a whole bunch of useful information in it that doesn’t show up in the tool tips you get when you hover over operators.

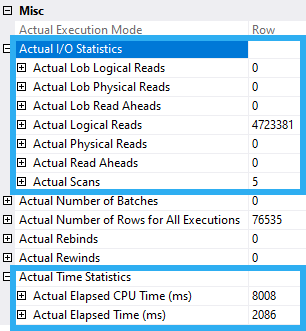
What you can see over there in detail is information about reads and operator time.

Interpreting Stuff
Logical reads is the number of 8KB pages the query read through. I used to put a lot of stock in tuning queries to do fewer reads, but I’ve run into too many situations where a faster query did more reads. I no longer consider it to be a great indicator of performance being better.
If logical reads incidentally go down, great. If not, whatever.
The reason this is better to get from execution plans is because if you use the SET STATISTICS command, it only tells you reads at the table level, not at the index level. If you have more complicated query plans that use multiple indexes from the same table, you can’t really tell which did what. Getting it from the query plan is easier to interpret.
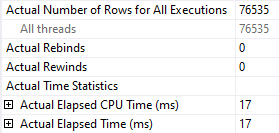
Down the bottom is some more useful information about CPU and elapsed time. I know what you’re thinking: that’s incredible, I can see how long each operator runs for. And that’s true; you can. But it’s a little more complicated depending on what kind of plan you’re looking at.
- If the plan is all row mode operators, time is cumulative going from right to left
- If the plan is all batch mode, time is per operator
- If the plan is a mix, then the time will also be mixed
It’s a little confusing, I know. But that confusion is going to become more common as you nice people start using SQL Server 2019 and seeing Batch Mode On Rowstore. Otherwise, you’ll really only see Batch Mode when columnstore is involved.
If you use this feature enough, you’ll undoubtedly run into rowmode query plans where the times are inconsistent, especially around parallel exchanges. Don’t take it personally — accounting for parallel thread and operator times is difficult. Things will most often even out as you read through the plan.
For more detail on timing stuff, check out my videos here and here on it.
For Real Though
Let’s look at our query with and without an index.
CREATE INDEX CreationDate ON dbo.Posts(CreationDate);

SELECT p.CreationDate,
       COUNT_BIG(*) AS records
FROM dbo.Posts AS p
WHERE p.CreationDate >= '20131225'
GROUP BY p.CreationDate;
It’s pretty easy to see what got better by looking at the execution plans.

With an index on CreationDate, we avoid the clustered index scan and the need to go parallel to compensate for not having an opportune index.
We can seek easily to the dates we care about, because they’re ordered in a way that makes it easy to find them.

Okay, Great
Now we know how to figure out if we did something right when adding an index.
Tomorrow we’ll look at ways you can write your queries that might interfere with indexes being used efficiently.
Thanks for reading!
Going Further
If this is the kind of SQL Server stuff you love learning about, you’ll love my training. I’m offering a 75% discount to my blog readers if you click from here. I’m also available for consulting if you just don’t have time for that and need to solve performance problems quickly.
Thanks for deconfusing…
Thats very cool. I’ve been staring at execution plans for ages, and had no idea I could view the extra properties.
Great Observation! I like it Mr. Erik!!