Work It
Memory is S-Tier crucial for most workloads to run reliably fast. It’s where SQL Server caches data pages, and it’s what it gives to queries to process Sorts and Hashes (among other things, but these are most common).
Without it, those two things, and many other caches, would be forced to live on disk. Horrible, slow disk. Talk about a good way to make databases less popular, eh?
With no offense to the SAN administrators of the world, I consider it my sworn duty to have databases avoid your domain as much as possible.
In this post, we’ll talk about how to figure out if your SQL Server needs more memory, and if there’s anything you can do to make better use of memory at the same time.
After all, you could be doing just fine.
(You’re probably not.)
Tale Of The Wait Stats
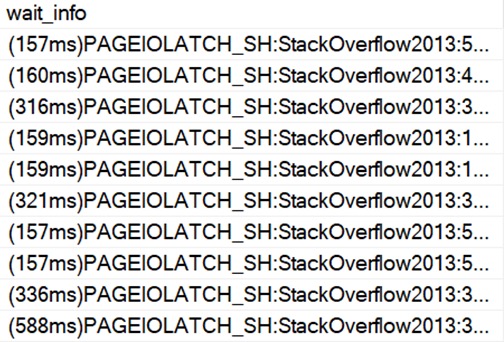
You can look at wait stats related to memory and query performance by running sp_PressureDetector.
It’ll give you some details about wait stats that relate to CPU and memory pressure. You wanna pay attention to the memory and disk waits, here. I had to squish it a little, but if you’re unfamiliar you can use the “description” column to better understand which ones to pay attention to.
Some important metrics to note here:
- How do wait times relate to server uptime?
- How long on average do we wait on each of these?
This won’t tell the whole story, of course, but it is a reasonable data point to start with. If your workload isn’t a 24×7 slog, though, you might need to spend more time analyzing waits for queries as they run.
In this example, it’s my local SQL instance, so it hasn’t been doing much work since I restarted it. Sometimes, you gotta look at what queries that are currently running are waiting on.
For that, go grab sp_WhoIsActive. If you see queries constantly waiting on stuff like this, it might be a sign you need more memory, because you have to keep going out to disk to get what queries need to use.

It could also be a sign of other things, like queries and indexes that need tuning, but if it’s sustained like this then that’s not entirely likely.
It’s much more likely a memory deficiency, but it’s up to you to investigate further on your system.
How Is SQL Server Using Memory Now?
Current memory utilization can be a good way to find out if other things are using memory and taking valuable space away from your buffer pool.
A lot of folks out there don’t realize how many different things SQL Server has to share memory across.
And, hey, yeah, sp_PressureDetector will show you that, too. Here’s a “normal” run:
SQL Server’s buffer pool is uninfringed upon by other consumers! Great. But sometimes queries ask for memory grants, and that’s where things can get perilous.

You may sometimes see Ye Olde First Memory Bank Of Motherboard loan out a swath to one or more queries:

The difference here? The buffer pool is reduced by ~9GB to accommodate a query memory grant.
sp_PressureDetector will show you the queries doing that, too, along with query plans.

It’ll also show you memory available in resource pools for granting out to queries. On this server, Max Server Memory is set to 50GB.
If you’re shocked that SQL Server is willing to give out 37GB of that to query memory grants, you haven’t been hanging around SQL Server long enough.
And you wonder why I worry about memory!
Does SQL Server Need More Memory?
If your queries are constantly waiting on:
- Reading pages from disk (PAGEIOLATCH_…)
- Query memory grants (RESOURCE_SEMAPHORE)
- Compiling query plans (RESOURCE_SEMAPHORE_QUERY_COMPILE)
Then there’s a pretty good chance that it does, especially if data just plain outpaces memory by a good margin (like 3:1 or 4:1 or more).
You also have some options for making better use of your current memory, too.
- Check critical queries for indexing opportunities (there may not always be a missing index request, but seasoned query tuners can spot ones the optimizer doesn’t)
- Apply PAGE compression to existing row store indexes to make them smaller on disk and in memory
- Check the plan cache for queries asking for large memory grants, but not using all of what’s granted to them
You can check the plan cache using a query like this. It’ll look for queries that ask for over 5GB of memory, and don’t use over 1GB of it.
WITH
    unused AS
(
    SELECT TOP (100)
        oldest_plan =
            MIN(deqs.creation_time) OVER(),
        newest_plan =
            MAX(deqs.creation_time) OVER(),
        deqs.statement_start_offset,
        deqs.statement_end_offset,
        deqs.plan_handle,
        deqs.execution_count,
        deqs.max_grant_kb,
        deqs.max_used_grant_kb,
        unused_grant =
            deqs.max_grant_kb - deqs.max_used_grant_kb,
        deqs.min_spills,
        deqs.max_spills
    FROM sys.dm_exec_query_stats AS deqs
    WHERE (deqs.max_grant_kb - deqs.max_used_grant_kb) > 1024.
    AND   deqs.max_grant_kb > 5242880.
    ORDER BY unused_grant DESC
)
SELECT
    plan_cache_age_hours =
        DATEDIFF
        (
            HOUR,
            u.oldest_plan,
            u.newest_plan
        ),
    query_text =
        (
            SELECT [processing-instruction(query)] =
                SUBSTRING
                (
                    dest.text,
                    ( u.statement_start_offset / 2 ) + 1,
                    (
                        (
                            CASE u.statement_end_offset
                                 WHEN -1
                                 THEN DATALENGTH(dest.text)
                                 ELSE u.statement_end_offset
                            END - u.statement_start_offset
                        ) / 2
                    ) + 1
                )
                FOR XML PATH(''),
                    TYPE
        ),
    deqp.query_plan,
    u.execution_count,
    u.max_grant_kb,
    u.max_used_grant_kb,
    u.min_spills,
    u.max_spills,
    u.unused_grant
FROM unused AS u
OUTER APPLY sys.dm_exec_sql_text(u.plan_handle) AS dest
OUTER APPLY sys.dm_exec_query_plan(u.plan_handle) AS deqp
ORDER BY u.unused_grant DESC
OPTION (RECOMPILE, MAXDOP 1);
This will get you the top (up to!) 100 plans in the cache that have an unused memory grant, ordered by the largest difference between grant and usage.
What you wanna pay attention to here:
- How old the plan cache is: if it’s not very old, you’re not getting the full picture
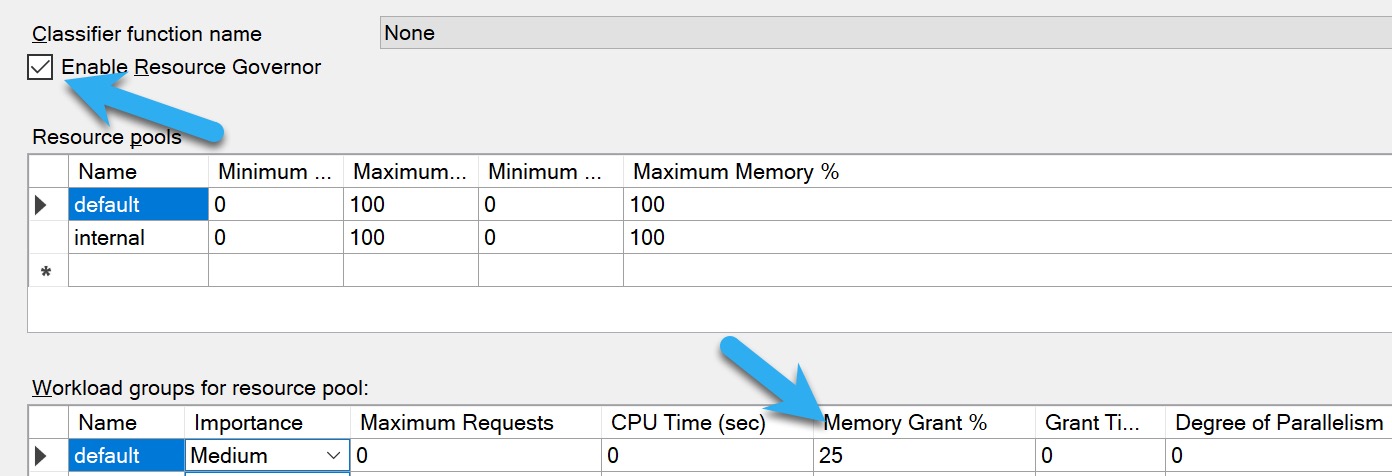
- How big the memory grants are: by default, the max is ~25% of max server memory
Controlling Memory Grants
If you’re looking for ways to control memory grants that doesn’t involved a bunch of query and index tuning, you have a few options:
- Resource Governor: Enterprise Edition only, and usually applies to the whole workload
- MIN_GRANT_PERCENT and MAX_GRANT_PERCENT query hints: You usually wanna use both to set a proper memory grant, just setting an upper level isn’t always helpful
- Batch Mode Memory Grant Feedback: Requires Batch Mode/Columnstore, only helps queries between executions, usually takes a few tries to get right
For Resource Governor, you’ll wanna do some analysis using the query in the previous section to see what a generally safe upper limit for memory grants is. The more memory you have, and the higher your max server memory is, the more insane 25% is.

Again, just be cautious here. If you change this setting based on a not-very-old plan cache, you’re not gonna have a clear pictures of which queries use memory, and how much they use. If you’re wondering why I’m not telling you to use Query Store for this, it’s because it only logs how much memory queries used, not how much they asked for. It’s pretty ridiculous.
After you make a change like this, or start using those query hints, you’ll wanna do some additional analysis to figure out if queries are spilling to disk. You can change the query above to something like this to look at those:
WITH
    unused AS
(
    SELECT TOP (100)
        oldest_plan =
            MIN(deqs.creation_time) OVER(),
        newest_plan =
            MAX(deqs.creation_time) OVER(),
        deqs.statement_start_offset,
        deqs.statement_end_offset,
        deqs.plan_handle,
        deqs.execution_count,
        deqs.max_grant_kb,
        deqs.max_used_grant_kb,
        unused_grant =
            deqs.max_grant_kb - deqs.max_used_grant_kb,
        deqs.min_spills,
        deqs.max_spills
    FROM sys.dm_exec_query_stats AS deqs
    WHERE deqs.min_spills > (128. * 1024.)
    ORDER BY deqs.max_spills DESC
)
SELECT
    plan_cache_age_hours =
        DATEDIFF
        (
            HOUR,
            u.oldest_plan,
            u.newest_plan
        ),
    query_text =
        (
            SELECT [processing-instruction(query)] =
                SUBSTRING
                (
                    dest.text,
                    ( u.statement_start_offset / 2 ) + 1,
                    (
                        (
                            CASE u.statement_end_offset
                                 WHEN -1
                                 THEN DATALENGTH(dest.text)
                                 ELSE u.statement_end_offset
                            END - u.statement_start_offset
                        ) / 2
                    ) + 1
                )
                FOR XML PATH(''),
                    TYPE
        ),
    deqp.query_plan,
    u.execution_count,
    u.max_grant_kb,
    u.max_used_grant_kb,
    u.min_spills,
    u.max_spills,
    u.unused_grant
FROM unused AS u
OUTER APPLY sys.dm_exec_sql_text(u.plan_handle) AS dest
OUTER APPLY sys.dm_exec_query_plan(u.plan_handle) AS deqp
ORDER BY u.max_spills DESC
OPTION (RECOMPILE, MAXDOP 1);
Small spills aren’t a big deal here, but you’ll definitely wanna pay attention to larger ones. This is set to find ones that are over 1GB, which is still pretty small, but could be meaningful.
If you notice a lot more queries spilling in a substantial way, you may have capped the high end of query memory grants too low.
Recap
Memory is something that I see people struggle to right-size, forecast, and understand the physics of in SQL Server. The worst part is that hardly anything in this post applies to Standard Edition, which is basically dead to me.
- You can’t use Resource Governor
- Batch Mode is nearly useless
- The cap for the buffer pool is 128GB, but you can use memory over that for other stuff
The main things to keep an eye on are:
- Wait stats overall, and for running queries
- Large unused memory grants in the plan cache
- Size of data compared to size of memory
If you need help with this sort of thing, hit the link below to drop me a line about consulting.
Thanks for reading!
Going Further
If this is the kind of SQL Server stuff you love learning about, you’ll love my training. I’m offering a 75% discount to my blog readers if you click from here. I’m also available for consulting if you just don’t have time for that and need to solve performance problems quickly.

I am using SQL server 2017 and for some reason, min_spills and max_spills do not exist in sys.dm_exec_query_stats
Do you know where we can find these columns?
Interesting question, Sal. If you check out the documentation, you’ll see this note for both of those columns:
They came along with CU3, which was released in early 2018, meaning your server hasn’t been patched or rebooted in over four years.
You should probably check on that.
Thanks!
This is great, Erik. Thank you!!
thank you! glad you’re enjoying it!
I love your work Erik. I mainly come here for the droll humour, but the squirrelly stuff is pretty cool too. 😉
Thanks, Pete! I mostly write about SQL as a vehicle for droll humor. Seems a target-rich environment.
“It’ll look for queries that ask for over 5GB of memory, and don’t use over 1GB of it.”
“(deqs.max_grant_kb – deqs.max_used_grant_kb) > 1024. AND deqs.max_grant_kb > 5120.”
I think you mean MB, not GB.
No, I definitely meant GB, I just pasted the tester version of the script in the post.
Fixed though, thanks!