Rabbit, Rabbit
I know, you’re sitting there and you’re staring at this post thinking “but I use Plan Explorer”.
I use it too, sometimes. The problem is that when I’m with a client, they don’t always have it.
More locally, I think there are some things SSMS visualizes better than Plan Explorer.
One example is rows on parallel threads. Another example is the operator times that started showing up a while back in SSMS 18, which aren’t there at all yet.
There’s some other stuff, but this isn’t what the post is about.
Complaint Department
A lot of the complaints people have about query plans in SSMS are with what’s in front of them.
It reminds me of a Futurama episode.
It’s one of the like, 2 episodes I remember. I think a dog dies or something in the other one.
Anyway, the redhead one from the staring meme moves in with the drunk robot one and thinks the apartment is a closet but then opens a door and reveals a big apartment with a great view at the end of the commercial delivery time.

And I get it. There’s a real lack of attention paid to UX in query plans.
It’s not quite as bad as Extended Events, but it’s there.
BUUUUUUUUUUUUUUUUUUTT…
Button Pusher
I read a lot of posts about query plans, and I rarely see people bring up the properties tab.
And I get it. The F4 button is right next to the F5 button. If you hit the wrong one, you might ruin everything.
But hear me out, dear reader. I care about you. I want your query plan reading experience to be better.
Hit F4.
Look at what you can get, just from the SELECT operator:

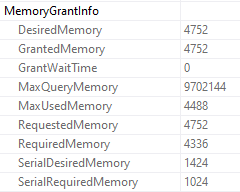
Ooey, gooey, memory grant info.

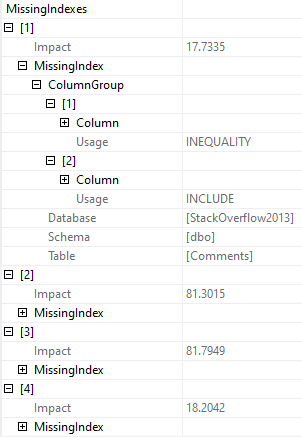
If there’s more than one missing index, you can see all of them.
Now, yeah, this sucks because you can’t script them out. Assembling them from here is pretty crappy.
But at least it’s not just the first one that may or may not be the best one.

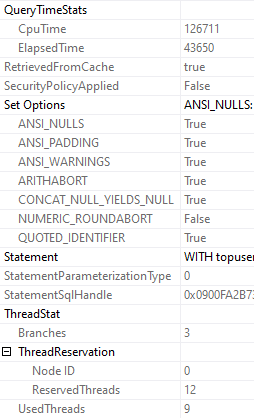
You can see the CPU and elapsed time. Since we’re on the select operator, we get the full plan’s timing.
If you get the properties on individual operators, you can see the timing for (most) specific operators.
One part that I love is ThreadStat, which tells you how many concurrent parallel branches, and how many threads your query reserved and used.

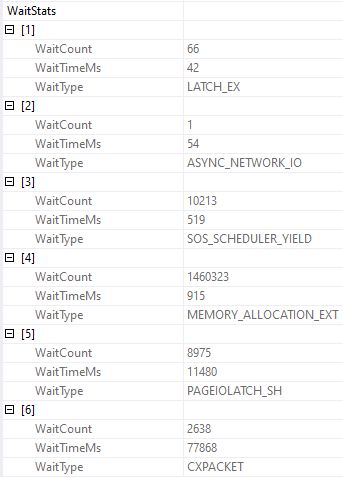
You can also get wait stats, if you’re into that sort of thing.
And, yeah, this part leaves some data out. You won’t see CXCONSUMER here, or LCK_ waits, which is frustrating.
Nopebooks
Since query plans are what I primarily care about, I’m sticking with SSMS.
And when I look at query plans, I’m hitting F4.
Trust me. If you start poking around in there, you’ll be amazed at what you can find.

Thanks for reading!
Going Further
If this is the kind of SQL Server stuff you love learning about, you’ll love my training. I’m offering a 75% discount to my blog readers if you click from here. I’m also available for consulting if you just don’t have time for that and need to solve performance problems quickly.
One thought on “Reading A Query Plan? Hit F4 To See All The Important Details.”
Comments are closed.