Number One Record
You’ve got a stored procedure that runs slowly, but the problem is that it’s… long. It’s really hard to tell which part is slow, sometimes.
With shorter procedures you can probably just collect actual execution plans and slam F5 like a tall glass of gin at 6am.
But you don’t wanna do that with the larger procedures, for a few practical reasons:
- Lots of little queries run quickly, and we don’t care about those
- Navigating through lots of plans in SSMS is tedious
- There’s no differentiation when other procedures, etc. are invoked
- You introduce a lot of overhead retrieving and rendering all those plans
- The full query text might not be captured, which is a limitation in many places
Let’s save the day with sp_HumanEvents, my stored procedure that makes using Extended Events really easy.
Wanna Ride
There are a lot of issues you can run into with Extended Events. They’re rather unpleasant, and there’s almost zero guidance from Microsoft about usage.
Wouldn’t it be nice to just hit F5?
Once you have a window open with your procedure ready to run, take note of the session id that it’s using, and tailor this command for your situation:
EXEC sp_HumanEvents
    @event_type = 'query',
    @query_duration_ms = 1000,
    @session_id = N'58',
    @keep_alive = 1;
Let’s break down what this does:
- The events we want to focus on are for executed queries
- We only care about queries that run for more than one second
- We’re going to focus in on the session id for the query window we’re tuning in
- We want the session to stay running so we can watch and re-watch after we make changes
I know it looks a little funny that @session_id is a string, but that’s because there are some sampling capabilities if you want to look at a workload instead of a single procedure without overwhelming a server by collecting everything.
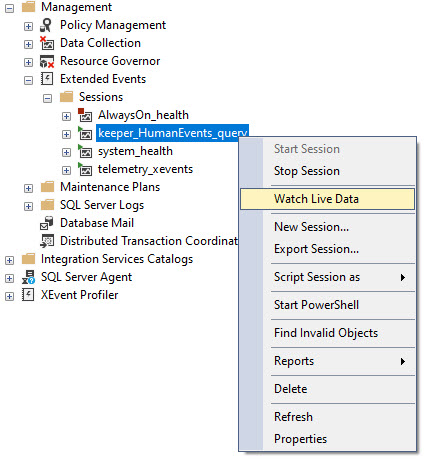
Once that’s done, you’ll have a new Extended Event session like this, and you’ll wanna watch live data from it:

Watch Out Now
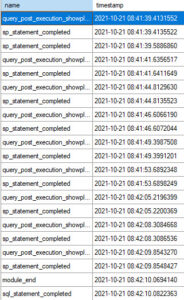
Once you’ve got that window open and you run your procedure, you’ll see any queries that meet the duration criteria, and you should see something that looks like this.

The procedure that I’m looking at in here is sp_BlitzCache, because it’s a good example of a procedure with a lot of queries in it, where only some of them (like the XML parsing) might get slowed down.
Some notes on the output:
- The statement doesn’t get collected with the query plan (more on that in a second)
- INSERT…EXEC shows up as two statements (lines 2 and 3 over there)
You only see these two columns at first, but you can go through and add in any other columns that you find useful from each specific session type.
Two Point Two
The output can be a little confusing at first. Generally the pattern is query plan, then statement associated with it.
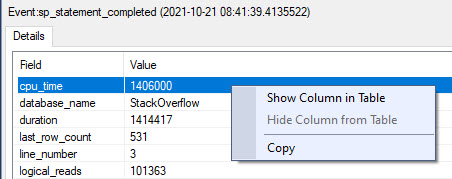
If you click on each event, you can choose different elements from it to show in the main result window.

Here’s how I usually set things up to find what I wanna go after:

I like to grab CPU, duration, information about requested, granted, and used memory, and the statement.
Not every element is available in every event. Where things are NULL, that’s where they’re not available. I wish there were a general extended event that captured everything I need in one go, but that doesn’t seem to exist.
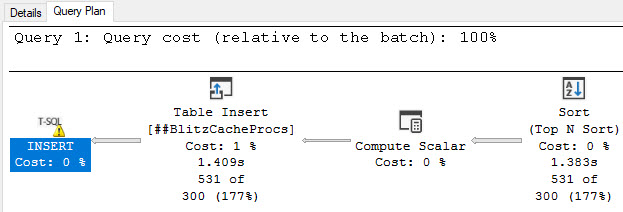
One last point on the output is that if you click on the query_post_execution_showplan lines, the query plan is available in the second result set:

Crossover
Before you ask, the lightweight profiling events are useless. They’re so nerfed and collect so little helpful detail that you might as well be looking at a cached plan or Query Store plan.
Lightweight, baby 🙄
To that point, I don’t recommend running something like this across a whole workload. Though Extended Events are purported to have far less observer overhead than Profiler, I’ve seen even heavily-filtered sessions like this slow workloads down quite a bit.
That goes for other traces and forms of monitoring as well. Don’t think this is a special case.
Anyway, this is how I work when I’m trying to tune things for clients. Hopefully you find it useful as well.
Grab sp_HumanEvents and lemme know how it goes on GitHub.
Thanks for reading.
Going Further
If this is the kind of SQL Server stuff you love learning about, you’ll love my training. I’m offering a 75% discount to my blog readers if you click from here. I’m also available for consulting if you just don’t have time for that and need to solve performance problems quickly.
I stopped to say that first url at https://erikdarling.com/sp_humanevents/ links to master branch, not main. Moar branches, moar problemos!
Great procedure btw, used it, liked it!
Besides actual execution plan, I just wonder sp_HumanEvents provides anything else that Query Store does not offer, or situations that it is more convenient than Query Store.
You’re wondering about a script that’s free to download and run? Buddy…