Troubleshooting RESOURCE_SEMAPHORE_QUERY_COMPILE Waits In SQL Server

Unfortunate


RESOURCE_SEMAPHORE_QUERY_COMPILE happens, in a nutshell, when SQL Server has allocated all the memory it’s willing to give out to compile query plans of a certain size and, throttles itself by making other queries wait to compile. For more details, head over here.

Now, this of course gets easier if you’re using Query Store. You can get heaps of information about query compilation from query_store_query. For everyone else, you’re left dipping into the plan cache to try to find queries with “high” compile memory. That can be hit or miss, of course.

But if it’s something you really find yourself needing to track down, here’s one way to do it:

WITH XMLNAMESPACES('http://schemas.microsoft.com/sqlserver/2004/07/showplan' AS p)
SELECT TOP (10) 
    x.compile_time_ms,
    x.compile_cpu_ms,
    x.compile_memory_kb,
    x.max_compile_memory_kb,
    x.is_memory_exceeded,
    x.query_plan
FROM
(
    SELECT
        c.x.value('@CompileTime', 'BIGINT') AS compile_time_ms,
        c.x.value('@CompileCPU', 'BIGINT') AS compile_cpu_ms,
        c.x.value('@CompileMemory', 'BIGINT') AS compile_memory_kb,
        c.x.value('(//p:OptimizerHardwareDependentProperties/@MaxCompileMemory)[1]', 'BIGINT') AS max_compile_memory_kb,
        c.x.exist('//p:StmtSimple/@StatementOptmEarlyAbortReason[.="MemoryLimitExceeded"]') AS is_memory_exceeded,
        deqp.query_plan
    FROM sys.dm_exec_cached_plans AS decp
    CROSS APPLY sys.dm_exec_query_plan(decp.plan_handle) AS deqp
    CROSS APPLY deqp.query_plan.nodes('/p:ShowPlanXML/p:BatchSequence/p:Batch/p:Statements/p:StmtSimple/p:QueryPlan') AS c(x)
    WHERE c.x.exist('@CompileMemory[. > 5120]') = 1
) AS x
ORDER BY x.compile_memory_kb DESC;

This query is filtering for plans with compile memory over 5MB. I set the bar pretty low there, but feel free to raise it up.

If you want to look at gateway info, and you’re on SQL Server 2016 or newer, you can use this DMV:

SELECT *
FROM sys.dm_exec_query_optimizer_memory_gateways AS deqomg
WHERE deqomg.pool_id > 1;

Scoping It Out


It only makes sense to run that query if you’re hitting RESOURCE_SEMAPHORE_QUERY_COMPILE wait with some frequency.

If you are, you just may be lucky enough to find the culprit, if your plan cache has been around long enough.

Thanks for reading!

Going Further


If this is the kind of SQL Server stuff you love learning about, you’ll love my training. I’m offering a 75% discount to my blog readers if you click from here. I’m also available for consulting if you just don’t have time for that and need to solve performance problems quickly.

Join Me At Data Platform Summit 2020!

The Road From Nowhere


This year, I’m teaching an 8 hour online workshop at Data Platform Summit, and I’d love it if you joined me.

Here’s what I’ll be teaching:

Class Title: The Beginner’s Guide To Advanced Performance Tuning

Abstract: You’re new to SQL Server, and your job more and more is to fix performance problems, but you don’t know where to start.

You’ve been looking at queries, and query plans, and puzzling over indexes for a year or two, but it’s still not making a lot of sense.

Beyond that, you’re not even sure how to measure if your changes are working or even the right thing to do.

In this full day performance tuning extravaganza, you’ll learn about all the most common anti-patterns in T-SQL querying and indexing, and how to spot them using execution plans. You’ll also leave knowing why they cause the problems that they do, and how you can solve them quickly and painlessly.

If you want to gain the knowledge and confidence to tune queries so they’ll never be slow again, this is the training you need.

Date: Dec 7 & 8.

Time: 12 PM to 04 PM EST (View in your timezone)

Tickets: Tickets here!

Going Further


If this is the kind of SQL Server stuff you love learning about, you’ll love my training. I’m offering a 75% discount to my blog readers if you click from here. I’m also available for consulting if you just don’t have time for that and need to solve performance problems quickly.

Please Stop Ignoring CXCONSUMER Waits In SQL Server

I’m Begging You, Here


Ever since SSMS started collecting wait stats in query plans, I’ve been mad about a couple things that get filtered out:

  • Lock waits
  • CXCONSUMER waits

Lock waits are particularly annoying. Imagine (I know, this might be difficult) that you have a friend who is puzzled by why a query is sometimes slow.

They send you an actual plan for when it’s fast, and an actual plan for when it’s slow. You compare them in every which way, and everything except duration is identical.

It’d be a whole lot easier to answer them if LCK waits were collected, but hey. Let’s just make them jump through another hoop to figure out what’s going on.

CXCONSUMER has a similar problem — and here’s the thing — if people are going through the trouble of collecting this information, give’em what they ask for. Don’t just give them what you think is a good idea.

Highly Affected People


Let’s look at a query where parallelism all gets skewed to one thread.

SELECT u.Id, 
       u.DisplayName, 
       u.Reputation, 
       u.CreationDate, 
       ca.*
FROM dbo.Users AS u
OUTER APPLY
    (
        SELECT *, 
        DENSE_RANK() 
              OVER( PARTITION BY vs.Id 
                    ORDER BY vs.Id DESC ) AS whatever
        FROM dbo.VotesSkewed AS vs
        WHERE vs.UserId = u.Id
        AND   vs.VoteTypeId BETWEEN 1 AND 4
    ) AS ca
WHERE ca.whatever = 0;

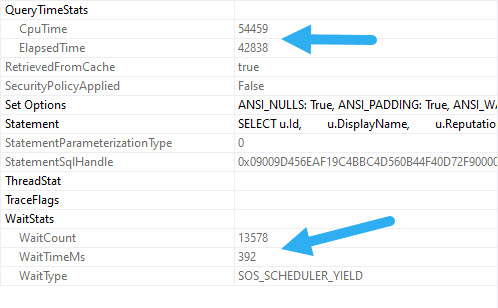
It runs for 42 seconds!

SQL Server Query Plan
slowpoke

But the only wait collected is SOS_SCHEDULER_YIELD. For 392 ms.

SQL Server Query Plan
o okay

Different Angle


If we watch the server’s wait stats while the query runs, we see a totally different story.

EXEC sp_BlitzFirst @Seconds = 50, @ExpertMode = 1;
SQL Server Query plan
uh huh

We had four waits on CXCONSUMER that all lasted nearly 11 seconds. Which of course happens because all the rows end up on one thread.

SQL Server Query Plan
bumpin

Sure, that’s easy enough to spot if you go looking, but having CXCONSUMER waits collected would make it a whole lot easier to know what to look for.

That is surely a significant enough wait to include. And don’t tell me it’s not actionable, because I spend a good chunk of time fixing problems like this.

Thanks for reading!

Going Further


If this is the kind of SQL Server stuff you love learning about, you’ll love my training. I’m offering a 75% discount to my blog readers if you click from here. I’m also available for consulting if you just don’t have time for that and need to solve performance problems quickly.

Reasons Your Query Is Slow Right Now: Blocking, Blocking, Blocking

Lockzilla


Blocking sucks. SQL Server should have used an optimistic isolation level by default.

Sure, writers would still block each other, but think of all the time people could have saved not explaining NOLOCK hints.

  • Yes, they still take locks
  • Yes, it’s the same as READ UNCOMMITTED
  • Yes, sometimes they make queries faster without blocking

Wait, what?

Moving Right Along


There are some interesting things to say about blocking, I suppose, aside from that it sucks.

For instance, it can look really weird when there’s parallelism. And read queries can block write queries.

There, I’ve said interesting things about blocking. It still sucks.

But how do you diagnose it?

First, close Activity Monitor.

Doctor, Doctor


My favorite tool for diagnosing blocking is sp_WhoIsActive, and I’m going to show you three different ways to look at it.

The safest way

EXEC sp_WhoIsActive @get_task_info = 2, @get_additional_info = 1;

This isn’t the way most people do it, but it is the least impactful.

You get back the normal set of results:

sp_WhoIsActive
peachy

Cool, you can see queries, lock waits, and blocking sessions. But a short scroll to the right also brings you to this additional_info clickable column:

sp_WhoIsActive
oily water

It’s not so helpful for the query doing the blocking, but it’ll tell you what the queries being blocked are stuck on.

The usual way

EXEC sp_WhoIsActive @get_locks = 1;

This is the way I normally demo looking for blocking with it, because it is more useful to see what the blocking query is doing.

But I’ve also had it be slow. Really, really slow.

That can happen when there is JUST SO MUCH BLOCKING that it takes a long time to enumerate all of it.

But you’ll get back this lovely sort of detail:

sp_WhoIsActive
say it loud

Page locks. 102. Great.

The smart way

EXEC sp_WhoIsActive @find_block_leaders = 1, @sort_order = '[blocked_session_count] DESC';

It’s not always obvious by runtime which session is causing blocking, so you can use this command to find blocking chains, and order output by who’s doing the most blocking.

sp_WhoIsActive
troubleshot

Fixins


When you need to troubleshoot live blocking, these are the ways I usually check in on things with sp_WhoIsActive. It’s hard to beat.

Of course, long term, a monitoring tool, or logging the blocked process report to a table can help you when you’re not there hitting F5 live and in-person.

We’ve peeled back a couple scenarios where oddball things can slow a server down. Tomorrow we’ll look at a new one!

What’ll it be?

Your guess is not as good as mine.

Thanks for reading!

Going Further


If this is the kind of SQL Server stuff you love learning about, you’ll love my training. I’m offering a 75% discount to my blog readers if you click from here. I’m also available for consulting if you just don’t have time for that and need to solve performance problems quickly.

Reasons Your Query Is Slow Right Now: Your SQL Server Is Overloaded

Oh Baby Another Series


Don’t you love lists? I love lists. They’re so nice and tidy, like a RegEx. Just the other night I was thinking how nice it’d be to write a RegeEx to detect RegEx patterns.

I didn’t sleep.

Anyway, SQL Server. Things. Things running slowly. What’s up with that?

In these posts, I’ll walk through some common scenarios, and how to look for them.

It might even be in the EXACT SAME VERY ORDER I LOOK FOR THEM!

Put your money away.

Reason 1: The Server Is Overloaded


If you go to open a new tab in SSMS and you hear a creaking sound, it might be time to revisit some of your hardware choices.

But that’s a problem for future you. Your problem is right now.

  • How to check it: sp_PressureDetector
  • What to look for: Stuck queries, Resource Usage, Wait Stats

By default, it’ll look at both CPU and Memory counters. If you don’t know what’s going on, just hit F5.

EXEC dbo.sp_PressureDetector;

If you’re hitting memory limits, things will look like this:


SQL Server Query Results
are you ready?

Some queries will have requested memory, but it won’t have been granted.

SQL Server Query Results
payday

Waiting queries will be stuck in a queue, waiting on RESOURCE_SEMAPHORE.

SQL Server Query Results
we’re having a good time

A significant amount of memory will have been granted out, and available memory will be on the lower side. You’ll also probably see the waiter_count column

If you’re hitting CPU limits, things will look like this:


SQL Server Query Results
negative creep

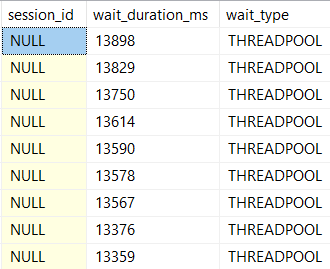
Available threads might be a negative, or very low number. Requests may be waiting on threads, and the number will pretty closely match the number of rows that are…

SQL Server Query Results
bum

Waiting in the pool.

SQL Server Query Results
she works hard for the money

This’ll also show you queries that are running, and which ones are using the most threads.

Can You Fix It Quickly?


Maybe, maybe not. If you’re allowed to kill off queries, you might be able to right the ship now. If not, you’re stuck waiting for queries to finish and give back their resources.

Longer term, you have a long checklist to go through, including asking tough questions about hardware, settings memory and parallelism settings, and your queries and indexes. This script will give you a lot of information about what’s going on. It’s up to you to figure out why.

If you need help with this sort of thing, drop me a line.

Thanks for reading!

Going Further


If this is the kind of SQL Server stuff you love learning about, you’ll love my training. I’m offering a 75% discount to my blog readers if you click from here. I’m also available for consulting if you just don’t have time for that and need to solve performance problems quickly.

Starting SQL: Query Plan Round Up

Put On


There are lots of things that can be fine in one query plan, and horrible in another.

Likewise, a query plan might be great for one set of parameters, and terrible for another. That’s called parameter sniffing, and that’s what we’re going to talk about next week.

What I want you to take away from the last couple weeks of posts is some of the improvements that have come into query plans over the years, and some of the shortcomings that still exist.

Despite the shortcomings, query plans offer an important view into things. When viewed alongside metrics in other DMVs, the text of the query, indexes that are available, and any parameters passed to the query, you can get a fairly complete view of things.

Major Pain


Of course, you can’t get rabbit-holed on this stuff. As much detail as gets captured in actual plans and in the other sources I mentioned, they don’t tell you about important things like blocking or resource contention.

You can infer this a bit by looking at waits on the server, or by comparing CPU to duration.

If you see lots of LCK, THREADPOOL, or RESOURCE_SEMAPHORE waits, it might not be an issue of tuning a single query.

Likewise, if you see a lot of PAGEIOLATCH_xx waits, you may need to look at your RAM to data ratio (among other things).

We’re at the point now where we’re ready to dive into a tougher subject, and start answering questions like “why did my query suddenly get slower?”

Thanks for reading!

Going Further


If this is the kind of SQL Server stuff you love learning about, you’ll love my training. I’m offering a 75% discount to my blog readers if you click from here. I’m also available for consulting if you just don’t have time for that and need to solve performance problems quickly.

Starting SQL: Compensating For Disk Waits In SQL Server

Repairer Of Reputations


CPU waits are relatively easy to figure out once you wrap your head around the settings that contribute to them, and the queries that cause them. There’s a pretty direct correlation between parallelism, thread usage, and CPU usage.

Compensating for disk waits is a bit of a different game, because there’s a bit to consider from a few different angles. But first, let’s distinguish a little bit.

Waits that commonly crop up when you’re waiting on disk:

  • PAGEIOLATCH_**
  • WRITELOG

When people hear they’re waiting a lot on disk, their first inclination might be that they need faster disks. For WRITELOG waits, that can definitely be a factor. For PAGEIOLATCH waits, it probably shouldn’t be your first move.

Relatively Speaking


When SQL Server hits PAGEIOLATCH waits, it’s to signal operations needing to read pages from disk into memory. If you just rebooted, this is inevitable. You start with a totally cold buffer cache.

But if you have enough memory, you’re not likely to see queries consistently waiting on it. Why? Because if data you need is already in memory, that’s where you go get it from. Why go to disk if you don’t have to? It’s icky out there.

If you really want to compensate for this wait, you’re going to need to think about a few things, like

  • How much memory you have, and how much memory you’re allowed (non-Enterprise versions have limits)
  • How much data you have, and how many indexes you have

Let’s say end user queries are consistently waiting on reading from disk. It doesn’t matter much if the wait is fast or slow, what matters is that the data isn’t in memory. Sure, it matters more if the waits are slow, but the first question is memory.

  • Do you have enough?
  • Can you add more?
  • Would what you have be enough if you had fewer indexes? (Unused/Duplicative)
  • Would what you have be enough if you had less data? (Purging/Archving)

Judgement Night


The reason getting memory right is so crucial is because of how much it’s responsible for.

Aside from caching all those thoughtfully crafted data pages, queries need it to sort and hash data, and there are all sorts of other lower level caches that rely on it. The plan cache is probably the most obvious.

Once you realize that memory is a shared resource, you treat it a whole lot differently. Especially if you know just how much memory some things can take.

To learn more, check out my videos:

Costing


Yeah, memory is cheap. Unless you need so much that your next step is going to Enterprise Edition.

But there’s an intermediate step in the mix that not many people talk about. You can have 2-3 Standard Edition boxes with data split out, and have it potentially be more cost effective than jumping to Enterprise Edition.

This is a better fit for applications/servers that use multiple databases, of course, but I’ve seen people do it with archival data too.

Of course, there are some disk things that you should fix. Like if you’re on a SAN and using <8Gb networking, or if you’re using a VM and not using PVSCSI disks.

The point though, is that if you have room to add memory, you should do that before fiddling with disks. It just plain goes further, because you’re not just helping queries read data into memory faster. You’re caching more pages overall, and you have more memory available for query memory grants (and other caching activities).

Faster disks also won’t do anything to help the waits we’ll talk about tomorrow, that can for sure be a sign that SQL Server doesn’t have adequate memory.

Thanks for reading!

Going Further


If this is the kind of SQL Server stuff you love learning about, you’ll love my training. I’m offering a 75% discount to my blog readers if you click from here. I’m also available for consulting if you just don’t have time for that and need to solve performance problems quickly.

Starting SQL: Compensating For CPU Waits In SQL Server

Fast Car


Some waits relate, but nearly all waits can be compensated for.

It’s all pulling levers, really. The Great And Powerful Oz has nothing on SQL Server.

More to the point, you can end up in quite a tangle with wait stats. I see people get bogged down in one or two metrics that they read are they worst thing you can ever see on a SQL Server, only to have them be totally unrelated to the problem at hand.

Go figure, the internet misled someone. At some point, this post will probably be misleading too. It might even be misleading right now.

Let’s talk about how to compensate for the common waits we talked about yesterday.

CXPACKET and CXCONSUMER


The fastest answer here is to check your settings. If these are at the defaults, you’re messing up. There’s a lot of competing points of view about how to set parallelism settings in SQL Server. The thing is, any of it can be wrong.

I don’t want to write this and have you think what I say is set in concrete. I want you to understand that I’m giving you a starting point, and it’s going to be up to you to figure out where to go from here.

MAXDOP (Max Degree Of Parallelism)

This is a fun one, because of the number of misconceptions around it. Here’s the way I go about it.

  • If you have one NUMA node with <= 8 cores, you can probably leave it alone, though sometimes I’ll set it to 4 on a server with 8 cores (like my laptop, ha ha ha) if the server is in tough shape
  • If you have one NUMA node with > 8 cores, set it to 8
  • If you have more than one NUMA node with <= 8 cores, set it to the number of cores in a NUMA node
  • If you have more than one NUMA node with > 8 cores, set it to 8

Will this work perfectly for everyone? No, but it’s a better starting place than 0. There are even some maintenance tasks that you might want to run with higher or lower MAXDOP, but that’s way beyond anything I want to get into here.

Plus, there’s all sorts of oddball CPU configurations that you can see, either because your VM admin has a permanent vape cloud around their head, or because some newer CPUs have non-traditional core counts that don’t follow the power of 2 increases (2, 4, 8, 16, 32, 64…) that CPUs have generally used.

If you leave MAXDOP set to 0, parallel queries can team up and really saturate your CPUs, especially if you don’t change…

CTFP (Cost Threshold For Parallelism)

The default for this is 5. This does not mean seconds. It meant seconds on one computer in the late 90s, but not anymore. I’d link to the post that talked about that one computer, but Microsoft nuked the blog it was on. Thanks, Microsoft.

It’s probably important for you not to have to think about all those old blogs when you’re concentrating so hard on quality CUs and documentation.

For everyone now, they’re sort of like Monopoly money. They don’t mean anything relative to your hardware. It’s not like weight, where you weigh different amounts based on the amount of gravity in your environment. These costs are only meaningful to the optimizer in coming up with plan choices.

Thing is, it’s really easy for a query to cost more than 5 of these whatevers. What’s important to understand up front is how this number is used.

When the optimizer gets a query that it needs to come up with an execution plan for, the first thing it comes up with is a serial execution plan. If the cost of that serial plan is over the CTFP threshold, the optimizer will consider parallel plans (assuming nothing is preventing a parallel plan from being formed, like scalar functions, etc).

If the cost of the parallel plan is cheaper than the cost of the serial plan then SQL Server will go with that one. I’m gonna put this in bold, because it’s a question I answer all the time: The cost of a parallel plan does not have to be higher than CTFP.

Setting Cost Threshold For Parallelism

Well, okay then. This seems important to set correctly. If you have to start somewhere, 50 is a nice number. Do you have to leave it there? No, but just like MAXDOP, it’s a setting you’ll wanna tweak after some observations.

Most importantly, if critical queries got slower after making changes. If they did, we need to figure out if it’s because they either stopped going parallel, or stopped having a higher available degree of parallelism available to them.

Some people will tell you to look at the query costs in your plan cache to figure out what to set this to, but there are some really big problems with that advice: your plan cache could be really unstable, your plan cache could not have plans that are a good representation of your workload, and query plans lie.

Most of that goes for Query Store, too. Even though it theoretically has more history, it’s up to you to sift through everything in there to find the queries you care about trying to get MAXDOP right for.

Sure, it’s nice if those CX waits go down when you make changes, since that’s what the settings we talked about most closely control. But there’s a more important wait that changing these can help limit, too.

THREADPOOL


This is a wait you generally only want to see in demos done by professionals.

Why? Because it means SQL Server ran out of worker threads to give to queries so that they can run. It’s a really bad situation, because you might have a hard time figuring out what’s wrong.

  • You might not be able to connect to your SQL Server
  • Your monitoring tool might not be able to connect to your SQL Server

On top of that, your applications might not be able to connect, and even RDP connections might fail. You can mitigate some amount of THREADPOOL incidents by MAXDOP and CTFP correctly. Fewer queries going parallel, and perhaps going parallel to a lesser degree can reduce the number of worker threads that a workload consumes.

But just doing that can’t fix everything. If you just plain have a higher degree of concurrency than your hardware can handle, or if queries are stacking up because of issues with blocking, you still run the risk of this happening. You might need to add hardware or do significant query and index tuning to fix the problem completely.

And no, setting MAXDOP to 1 isn’t a viable solution.

Thanks for reading!

Going Further


If this is the kind of SQL Server stuff you love learning about, you’ll love my training. I’m offering a 75% discount to my blog readers if you click from here. I’m also available for consulting if you just don’t have time for that and need to solve performance problems quickly.

Starting SQL: How Different Wait Types Relate To Each Other In SQL Server

Going For Distance


There are waits, and then there are waits. If you know, you know, you know?

If you don’t know, here’s the deal: there are some waits that are gonna happen, and you’re not gonna be able to do much about them.

In this post, I’d rather introduce you to waits that you should pay attention to and can fix, and how they relate.

This isn’t meant to cover every single scenario, but it’s a good starting place. For example, with cloud and VM workloads being more common than ever, you may need to look at different settings or configurations outside of SQL Server.

This also goes for those of you using SANs, where everything from the networking to the controllers to the disk arrays can potentially be a bottleneck.

If one looks hard enough, one may find inefficiencies anywhere.

Going For Speed


The waits I generally feel are common enough and fixable enough are below.

There are plenty of less common waits with perfectly fine solutions, but let’s get you started with the ones that tend to drift up towards the top of all those magical scripts you find strewn about the internet.

  • CXPACKET/CXCONSUMER: Parallelism
  • LCK_*: Locking
  • PAGEIOLATCH_*: Reading pages from disk
  • RESOURCE_SEMAPHORE: Running out of memory to grant queries
  • THREADPOOL: Running out of worker threads

Of course, these waits can be closely related, can’t they?

  • Many concurrent parallel queries can lead to running out of worker threads
  • A common way to have many parallel queries stack up is to have them get blocked
  • Granting lots of memory to queries can mean less room for the buffer pool and more reading from disk

Of course, it’s really when these waits happen that matters, isn’t it? If there’s no end-user impact, who cares?

Always Be Checking


For the billionth time, if you have servers you care about performance for, get a monitoring tool.

If your boss won’t spring for one, try a free one. Or if you’re feeling really saucy, download a free trial of a paid tool.

Once you know which waits are happening when users might care, you stand a better chance at being able to start fixing things.

But I don’t want you to think you always need wait stats to tune things. Often, waits for a single query don’t matter. Waits really matter when you want to judge a workload.

Of course, there are exceptions. If every 2nd or 3rd time you run a query, it spends 20 seconds reading pages from disk, but the rest of the time it takes 2 seconds, it’s probably not the query (assuming everything in the plan is identical).

Tomorrow we’ll dig into CPU related waits, and how to address those.

Thanks for reading!

Going Further


If this is the kind of SQL Server stuff you love learning about, you’ll love my training. I’m offering a 75% discount to my blog readers if you click from here. I’m also available for consulting if you just don’t have time for that and need to solve performance problems quickly.

Starting SQL: Measuring Wait Stats In SQL Server

Done Started Something


If you talk to anyone who bills by the hour for SQL Server, one of the first things they’ll ask you is what your wait stats are.

It’s not a bad question; it kills some time, and it lets them gauge how engaged you are with your server.

  • Waits can sometimes indicate a severe bottleneck
  • Waits can also be “high” on a server that has perfectly acceptable throughput

There are also some problems with wait stats, and performance counters in general: there’s no direct correlation between the counters and the queries that caused them.

Sure, Query Store in 2017+ tracks high level wait stats for queries, but I don’t run into a lot of people using Query Store still.

The other trouble with performance counters is that they just aggregate over time, with no partitioning either by database or time.

Brooklyn Basement


Some things to keep in mind when you’re looking at wait stats:

  • How they compare to server uptime
  • How many times the wait occurred
  • How long each occurrence took to complete on average

If your script or monitoring tool doesn’t report this stuff, it’s leaving some really important stuff out of the picture.

The relationship to server up-time is important, because if all you have to work off of is percentages, you have no idea if your server is constantly grinding on these waits, or if they only happened for a few minutes.

As a thought experiment: say 100% of your waits are on PAGEIOLATCH_SH, and you have 2 hours total of those waits.

How does your opinion of those waits change if the server has been up for:

  • 1 hour
  • 4 hours
  • 24 hours
  • 96 hours

Typically, the longer a server has been up, and the less concentrated waits become, the less of a focal point they should be. There’s no magic ratio here, but for me, the closer wait times are to up time, the more I may want to look at them.

Longs and Shorts


Yes, there can be a mix of these, but there’s still two basic ways that wait stats rack up.

  • Lots of waits that happen pretty quickly
  • Fewer waits that last a long time

Obviously, the source of those waits will impact how much we care about them. Here are some common examples:

  • You wait often on storage, but the waits are short (say <10 ms)
  • You don’t wait often on locks, but the waits are long (say > 10,000 ms)

It’s pretty trivial to look at your wait stats

I’m not gonna reinvent any wheels here, but I will reiterate a couple things:

  • You can see which queries are generating waits while  they’re running, but…
  • If you’re not constantly logging that, it disappears on you
  • Once waits are completed, they are faceless and blameless
  • Waits in general can be far less valuable when workloads are inconsistent

Attentione!


Tomorrow, I’ll talk through some of the most common waits, and first-line ways to start solving them.

They may not solve every single problem, but they’re generally a good place to start.

Thanks for reading!

Going Further


If this is the kind of SQL Server stuff you love learning about, you’ll love my training. I’m offering a 75% discount to my blog readers if you click from here. I’m also available for consulting if you just don’t have time for that and need to solve performance problems quickly.