Stop Looking At SQL Server Wait Stats Without Looking At Server Uptime

Economy Of Waits


There’s a joke about two economists walking down the street.

One of them asks the other how they’re doing.

The punchline is that their response is “compared to what?”

It’s not the best joke, and it’s something to keep in mind when you’re measuring anything, but SQL Server specifically.

This isn’t a post about collecting baselines, though it’s a relevant concept.

Scenery, Yo


One of the best ways to find bottlenecks in SQL Server is to look at wait stats.

Lots of scripts and monitoring tools will show you top waits, percentages, signal waits, and even percentages of signal waits.

Oh baby, those datapoints.

But there’s frequently a missing axis: compared to what?

Weakly Links


Let’s say you’ve got 604,800 seconds of CX packet waits.

Let’s also say they’re 95% of your total server wait stats.

How does your opinion of that number change if your server has been up for:

  • One Day (86,400 seconds)
  • One Week (604,800 seconds)
  • One Month (2,592,000 seconds)
  • One Year (31,536,000 seconds)

Obviously, if your server has been up for a day, you might wanna pay more attention to that metric.

If your server has been up for two weeks, it becomes less of an issue.

Seven Year Abs


I’ll give you another example: OH MY GOD YOU ATE 20,000 CALORIES.

  • In a day, that might be cause for concern
  • In a week, you’re about average
  • In a month, you might need medical attention
  • In a year, well, you’re probably more calorically important to worms

Compared to what is a pretty important measure.

Forced Perspective


I get it. Someone can clear out wait stats, and judging uptime can be unreliable, and more difficult up in the cloud.

Looking at wait stats without knowing the period of time they were collected over isn’t terribly helpful.

I’d opened an issue to at least separate wait stats by database, though Microsoft doesn’t seem to be too into my idea.

Thanks for reading!

Going Further


If this is the kind of SQL Server stuff you love learning about, you’ll love my training. I’m offering a 75% discount to my blog readers if you click from here. I’m also available for consulting if you just don’t have time for that and need to solve performance problems quickly.

Building SQL Server Tools vs Building SQL Server Knowledge

Time Served


I’m gonna be honest with you: I’m not gonna build another First Responder Kit.

It’s established, it’s open source, and it’s badass. I poured a ton of work into it over the years, and starting from scratch seems like a bad use of my time.

I totally encourage you to help continue to build it. I learned a ton working on that stuff, and it was an incredibly valuable and rewarding experience.

I am going to build tooling that I think would be useful but that isn’t covered in there, for things like:

Any Tool Can See


Using any tool that returns a given set of information about wait stats, query plans, indexes, or whatever about SQL Server will show you roughly the same problems.

Roughly. Some better than others. Some I have no idea. Some not so much.

The point is, I can teach you to find problems with the tool you’re using, or help you find a tool that does.

I can also teach you how to solve them.

Nothing New But The Name


My thing over here is coaching. Helping you become better at whatever it is you wanna do.

Every tool is a wrapper for what’s inside SQL Server. Tools are interchangeable, mostly.

Knowing how use and interpret them in a meaningful way is not.

Thanks for reading!

Going Further


If this is the kind of SQL Server stuff you love learning about, you’ll love my training. I’m offering a 75% discount to my blog readers if you click from here. I’m also available for consulting if you just don’t have time for that and need to solve performance problems quickly.

Video: How The Right Indexes Help SQL Server Make Better Use Of Memory

Sphinx For The Mahogany


All the helper objects for the below demos are available on my GitHub repo.

Going Further


If this is the kind of SQL Server stuff you love learning about, you’ll love my training. I’m offering a 75% discount to my blog readers if you click from here. I’m also available for consulting if you just don’t have time for that and need to solve performance problems quickly.

Demoman!


USE StackOverflow2010;
SET NOCOUNT ON;
GO 

/*
--Basic index info
SELECT *
FROM dbo.WhatsUpIndexes AS wui
WHERE wui.table_name = 'Users'
OPTION ( RECOMPILE );
GO   

--What's in the buffer pool?
SELECT *
FROM dbo.WhatsUpMemory AS wum
WHERE wum.object_name = 'Users'
OPTION ( RECOMPILE );
GO 
*/

--CREATE INDEX ix_whatever ON dbo.Users (Reputation);
GO 

SELECT *
FROM dbo.WhatsUpIndexes AS wui
WHERE wui.table_name = 'Users'
OPTION ( RECOMPILE );
GO            


DBCC DROPCLEANBUFFERS;
CHECKPOINT;
DBCC FREEPROCCACHE;
CHECKPOINT;
GO 5


SELECT *
FROM dbo.WhatsUpMemory AS wum
WHERE wum.object_name = 'Users'
OPTION ( RECOMPILE );
GO 

    SET STATISTICS TIME, IO, XML ON;
    SET NOCOUNT OFF;

    --/*Select a count of everything*/
    SELECT COUNT(*) AS records
    FROM dbo.Users AS u
    WHERE 1 = (SELECT 1);

    --/*Select a count of one user*/
 --   SELECT COUNT(*) AS records
 --   FROM dbo.Users AS u
 --   WHERE u.Id = 22656 
	--AND 1 = (SELECT 1);


    --/*Select a count of rep > 100k*/
    --SELECT COUNT(*) AS records
    --FROM dbo.Users AS u
    --WHERE u.Reputation >= 100000
    --AND 1 = (SELECT 1);

    SET NOCOUNT ON;
    SET STATISTICS TIME, IO, XML OFF;

SELECT *
FROM dbo.WhatsUpMemory AS wum
WHERE wum.object_name = 'Users'
OPTION ( RECOMPILE );
GO 

Video: Is Setting MAXDOP and Cost Threshold for Parallelism Really Easy?

Asked and Answered


Thanks for watching!

Going Further


If this is the kind of SQL Server stuff you love learning about, you’ll love my training. I’m offering a 75% discount to my blog readers if you click from here. I’m also available for consulting if you just don’t have time for that and need to solve performance problems quickly.

Troubleshooting THREADPOOL Waits In SQL Server With A Plan Cache Query

You Come And Go


When THREADPOOL strikes, even the best monitoring tools can have a bunch of blank spots hanging around in them.

If you’re on SQL Server 2016 or better, there are some helpful columns in sys.dm_exec_query_stats.

WITH threads
    AS
     (
         SELECT   TOP (10)
                  deqs.sql_handle,
                  deqs.plan_handle,
                  deqs.total_reserved_threads,
                  deqs.last_reserved_threads,
                  deqs.min_reserved_threads,
                  deqs.max_reserved_threads,
                  deqs.total_used_threads,
                  deqs.last_used_threads,
                  deqs.min_used_threads,
                  deqs.max_used_threads,
                  deqs.execution_count
         FROM     sys.dm_exec_query_stats AS deqs
         WHERE    deqs.min_reserved_threads > 0
         ORDER BY deqs.max_reserved_threads DESC
     )
SELECT      t.execution_count,
            t.total_reserved_threads,
            t.last_reserved_threads,
            t.min_reserved_threads,
            t.max_reserved_threads,
            t.total_used_threads,
            t.last_used_threads,
            t.min_used_threads,
            t.max_used_threads,
            CASE WHEN (t.min_reserved_threads * 2) < t.max_reserved_threads 
                 THEN 'maybe'
                 ELSE 'maybe not'
            END AS [sniffy?],
            d.query_plan
FROM        threads AS t
CROSS APPLY sys.dm_exec_query_plan(plan_handle) AS d
ORDER BY    t.execution_count DESC, t.max_used_threads DESC;

On My Laptop


Which doesn’t have anything terribly interesting on it at the moment, I get this back.

SQL Server Query Results
Egg salad

I have my results weighted towards what’s executed the most, then by how many threads they wanted to reserve.

This could give you a good idea about which queries contributed to THREADPOOL problems.

Keep in mind that, regardless of how many threads the queries end up using, they’ll reserve as many as they want (unless DOP is downgraded due to CPU pressure).

If they get blocked, they hold onto those threads.

If those threads aren’t available when they start running, they’ll either wait for them to show up, or run at a lower DOP.

What Should You Do Here?


  • Take a look at the query plans: Are there any home dunk missing indexes?
  • Take a look at the query text: Is there some obvious problem, like a non-SARGable predicate that you can fix?
  • Take a look at your server: Are MAXDOP and CTFP set correctly?
  • Take a look at the predicates: Is there some bad parameter sniffing going on (check the sniffy column for swings in threads)

Thanks for reading!

Going Further


If this is the kind of SQL Server stuff you love learning about, you’ll love my training. I’m offering a 75% discount to my blog readers if you click from here. I’m also available for consulting if you just don’t have time for that and need to solve performance problems quickly.

The Metrics That Matter For SQL Server Performance Tuning

Generality vs. Specificity


If you’re stepping up to a SQL Server you’ve never seen before, you’re probably only armed with what people tell you the problem is.

Sometimes they’re right, more often they’re wrong. Even more often they’re just too vague, and it falls back to you to figure out exactly what’s “slow”.


As you start digging in, you’ll start noticing things you want to change, and building a mental case for why you want to change them:

  • Maybe the CX waits will be really high, and no one has changed MAXDOP and CTFP from defaults
  • Maybe there’s a lot of locking waits, and there’s a lot of overlapping indexes or you want to use RCSI
  • Maybe there’s a lot of PAGEIOLATCH waits and there’s not many nonclustered indexes or you don’t have enough RAM

Those are good general patterns to watch out for, and while there may be regressions in some places, you’re likely to make the server a better place overall.

Sometimes you’ll get handed a query to tune.

Or more realistically, you get handed a few-thousand line stored procedure to tune. It probably calls other stored procedures, too.

Your job, one way or another, is to reduce the length of time between hitting F5 and having it complete.

For different sets of parameters.

Things That Change


In a perfect world, you’d change one variable (this could be a setting, and index, the way a query is written, or an actual variable being passed in), and see how the metrics you care about change.

But that hardly ever happens, does it?

You’ll probably:

  • Change a few settings you’re confident about
  • Deduplicate a bunch of indexes for a table at a time
  • Adjust a bunch of things in a stored procedure as you scroll through
  • Fix some Heaps all together

Look, it’s okay. You might need to be really effective and make a lot of progress quickly. Not everyone has weeks or months to make incremental changes towards better performance.

But you need to be aware of which metrics you’re hoping to improve when you make a change, and you need to be sure that the changes you make can actually make it wiggle.

For a query, it’s likely just a mix of elapsed time, CPU time, and memory grants. In a way, that’s a lot easier.

For a whole server, you need to understand the problems, and how SQL Server surfaces them.

Thanks for reading!

Going Further


If this is the kind of SQL Server stuff you love learning about, you’ll love my training. I’m offering a 75% discount to my blog readers if you click from here. I’m also available for consulting if you just don’t have time for that and need to solve performance problems quickly.

Is The SQL Server Really Slower Than It Used To Be?

Economy Of Words


When someone says that something is slower than it was before, whether it’s a query, a whole SQL Server, a website, or an app screen, it’s almost never while the perceived slowness is happening, nor is it reproducible (especially when a consultant is watching).

There are some basic things you need to have historical record of if you wanna figure it out:

  • What queries were running
  • What queries were waiting on
  • What was different from last time those queries ran

Microsoft has taken some steps to help us figure this out with Query Store, but really only for SQL Server 2017, when aggregated wait stats were added to the family of Query Store views.

But if you’re like most people, you’re not on SQL Server 2017, and even further into that segment, you don’t have Query Store enabled.

I think there’s more Microsoft could do to improve data that’s collected, but right now it’s just a collection of votes.

Right now, the GUI is so limited in what you can search for that I wrote a sp_QuickieStore to make working with the data easier.

Compared To What?


If you’re on older versions of SQL Server, including those about to be taken off life support, what are your options?

For Free!

For Money!

There’s a whole landscape of SQL Server monitoring tools out there, as well as things people get confused with SQL Server monitoring tools.

Ultimately, the best monitoring tool for you is one you:

  • Will actually use
  • Will enable you to find problems
  • Will enable you to solve problems

Getting overwhelmed with meaningless metrics (there were how many logouts per second?!), standalone charts that don’t allow you to correlate system activity to resource usage (save as image?!), or long lists of queries that may or may not run when anyone cares (yes, CHECKDB did a lot of reads, thanks) doesn’t help anyone. If that sounds like your monitoring tool, it might be time to trade it for a carton of Gatorade.

You’ve got a glorified FitBit strapped onto your SQL Server.

Here And Now


What’s currently happening on your SQL Server is often only a symptom of what’s been happening on your SQL Server for a long time.

There are very few problems I’ve seen that are truly “sudden”, unless someone recently made an ill-advised change to the server, like dropping an important index, etc.

The longer you let things like aging hardware, growing data, and ignoring query and index problems go, the worse things get.

Monitoring your server is a good first step, but it’s still up to you to address the problems, and address the right problems.

Thanks for reading!

Going Further


If this is the kind of SQL Server stuff you love learning about, you’ll love my training. I’m offering a 75% discount to my blog readers if you click from here. I’m also available for consulting if you just don’t have time for that and need to solve performance problems quickly.

The Resource Governor MAXDOP Setting Can Lead to Poor Plan Choices In SQL Server

Resource Governor can be used to enforce a hard cap on query MAXDOP, unlike the sp_configure setting. However, query plan compilation does not take such a MAXDOP limit into account. As a result, limiting MAXDOP through Resource Governor can lead to unexpected degradations in performance due to suboptimal query plan choices.

Create Your Tables


We start with the not often seen here three table demo. I’d rather not explain how I came up with this sample data, so I’m not going to. I did my testing on a server with max server memory set to 10000 MB. The following tables take about half a minute to create and populate and only take up about 1.5 GB of space:

DROP TABLE IF EXISTS dbo.SMALL;
CREATE TABLE dbo.SMALL (ID_U NUMERIC(18, 0));

INSERT INTO dbo.SMALL WITH (TABLOCK)
SELECT TOP (100) 5 * ROW_NUMBER()
	OVER (ORDER BY (SELECT NULL))
FROM master..spt_values t1
CROSS JOIN master..spt_values t2
OPTION (MAXDOP 1);

DROP TABLE IF EXISTS dbo.MEDIUM;
CREATE TABLE dbo.MEDIUM (ID_A NUMERIC(18, 0));

INSERT INTO dbo.MEDIUM WITH (TABLOCK)
SELECT TOP (600000) ROW_NUMBER()
	OVER (ORDER BY (SELECT NULL))
FROM master..spt_values t1
CROSS JOIN master..spt_values t2
CROSS JOIN master..spt_values t3
OPTION (MAXDOP 1);

DROP TABLE IF EXISTS dbo.LARGE;
CREATE TABLE dbo.LARGE (
	ID_A NUMERIC(18, 0),
	ID_U NUMERIC(18, 0),
	FILLER VARCHAR(100)
);

INSERT INTO dbo.LARGE WITH (TABLOCK)
SELECT 2 * ( RN / 4), RN % 500, REPLICATE('Z', 100)
FROM
(
	SELECT TOP (8000000) ROW_NUMBER()
		OVER (ORDER BY (SELECT NULL)) RN
	FROM master..spt_values t1
	CROSS JOIN master..spt_values t2
	CROSS JOIN master..spt_values t3
) q
OPTION (MAXDOP 1)

CREATE INDEX IA ON LARGE (ID_A);
CREATE INDEX IU ON LARGE (ID_U);

The Long-Awaited Demo


I thought up the theory behind this demo on a car ride back from a SQL Saturday, but wasn’t able to immediately figure out a way to get the query plan that I wanted. I ended up finally seeing it in a totally different context and am now happy to share it with you. Consider the following query:

SELECT LARGE.ID_U
FROM dbo.SMALL
INNER JOIN dbo.LARGE ON SMALL.ID_U = LARGE.ID_U
INNER JOIN dbo.MEDIUM ON LARGE.ID_A = MEDIUM.ID_A
OPTION (MAXDOP 1);

The MAXDOP 1 hints results in a serial plan with two hash joins:
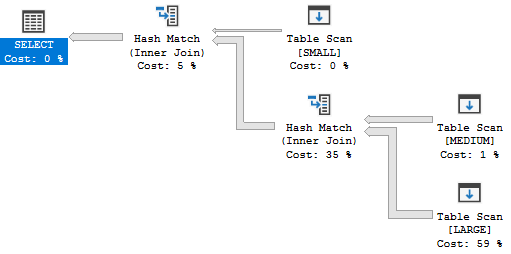
a36_MAXDOP1_plan

This is a perfectly reasonable plan given the size and structure of the tables. There are no bitmap filters because row mode bitmap filters are only supported for parallel plans. Batch mode is not considered for this query because I’m testing on SQL Server 2017 and there isn’t a columnstore index on any of the tables referenced in the query. On my machine a single query execution uses 2422 of CPU time and 2431 ms of elapsed time.

A parallel plan at MAXDOP 4 is able to run more quickly but with a much higher CPU time. A single execution of the MAXDOP 4 query uses 5875 ms of CPU time and 1617 ms of elapsed time. There are multiple bitmap filters present. I zoomed in on the most interesting part of the plan because I haven’t figured out how images work with WordPress yet:

a36_MAXDOP4_plan

Instead of doing a scan of the LARGE table, SQL Server instead chooses an index intersection plan. The cost of the additional hash join is reduced by multiple bitmap filters. There are only 2648396 and 891852 rows processed on the build and probe side instead of 8 million for each side, which is a significant gain.

Worse Than A Teen Running for Governor


Some end users really can’t be trusted with the power to run parallel plans. I thought about making a joke about an “erik” end user but I would never subject my readers to the same joke twice. After enforcing a MAXDOP of 1 at the Resource Governor level, you will probably not be shocked to learn that the query with the explicit MAXDOP 1 hint gets the same query plan as before and runs with the same amount of CPU and elapsed time.

If you skipped or forget the opening paragraph, you may be surprised to learn that the query with a MAXDOP 4 hint also gets the same query plan as before. The actual execution plan even has the parallel racing arrows. However, the query cannot execute in parallel. The parallelism and bitmap operators are skipped by the query processor and all of the rows are processed on one thread:
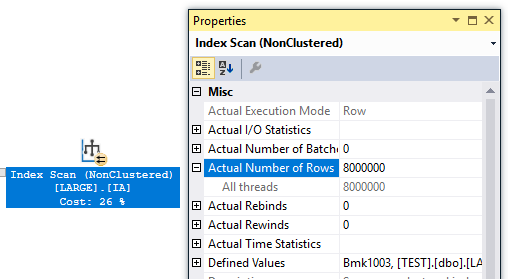
a36_MAXDOP4_with_RG

I uploaded the query plan here if you want to look at it. This type of scenario can happen even without Resource Governor. For example, a compiled parallel query may be downgraded all the way to MAXDOP 1 if it can’t get enough parallel threads.

The query performs significantly worse than before, which hopefully is not a surprise. A single execution took 12860 ms of CPU time and 13078 ms of elapsed time. Nearly all of the query’s time is spent on the hash join for the index intersection, with a tempdb spill and the processing of additional rows both playing a role. The tempdb spill occurs because SQL Server expected the build side of the hash join to be reduced to 1213170 rows. The bitmap filtering does not occur so 8 million rows were sent to the build side instead.

In this case, adding a MAXDOP 1 hint to the query will improve performance by about 5X. Larger differences in run times can be easily seen on servers with more memory than my desktop.

Final Thoughts


If you’re using using Resource Governor to limit MAXDOP to 1, consider adding explicit MAXDOP 1 hints at the query level if you truly need the best possible performance. The MAXDOP 1 hint may at first appear to be redundant, but it gives the query optimizer additional information which can result in totally different, and sometimes significantly more efficient, query plans. I expect that this problem could be avoided if query plan caching worked on a Resource Governor workload group level. Perhaps that is one of those ideas that sounds simple on paper but would be difficult for Microsoft to implement. Batch mode for row store can somewhat mitigate this problem because batch mode bitmap filters operate even under MAXDOP 1, but you can still get classic row mode bitmaps even on SQL Server 2019.

Thanks for reading!

Going Further


If this is the kind of SQL Server stuff you love learning about, you’ll love my training. I’m offering a 75% discount to my blog readers if you click from here. I’m also available for consulting if you just don’t have time for that and need to solve performance problems quickly.