Discarded
There are metrics that I care and don’t care about when I’m looking for queries to tune.
Metrics I don’t care about:
- Logical Reads
- Costs
If a query does “a lot” of reads or has a high “cost”, I generally don’t care as long as they run quickly. Doing consistent physical reads is a slightly different story, but would probably fall more under server tuning or fixing memory grants.
Metrics I do care about:
- CPU (taking parallelism into consideration)
- Duration (compared to CPU)
- Memory Grants (particularly when they’re not being fully utilized)
- Writes (especially if it’s just a select)
- Executions (mostly to track down scalar UDFs)
CPU and Duration
These two metrics get lumped together because they need to be compared in order to figure out what’s going on. First, you need to figure out what the minimum runtime of a query is that you want to tune.
In general, as query execution time gets faster, getting it to be much faster gets more difficult.
- Bringing a query from 1 second to 100 milliseconds might be a small matter
- Bringing that same query from 100 milliseconds to 1 millisecond might take more time than it’s worth
I say that because unless someone is querying SQL Server directly, smaller durations tend to be less detectable to end users. By the time they hit a button, send the request, receive the data, and have the application render it etc. they’re probably not aware of a 99 millisecond difference.
Of course, not everything is end-user centric. Other internal operations, especially any loop processing, might benefit greatly from reductions on the smaller side of things.
- If duration and CPU are acceptable, leave it alone
- If either is unacceptable, tune the darn thing
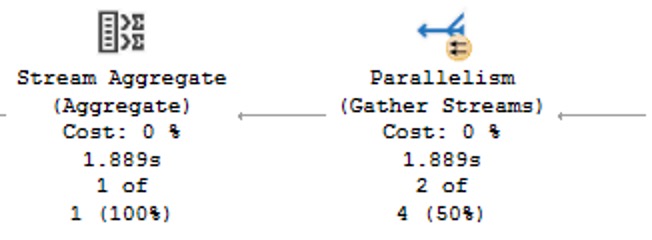
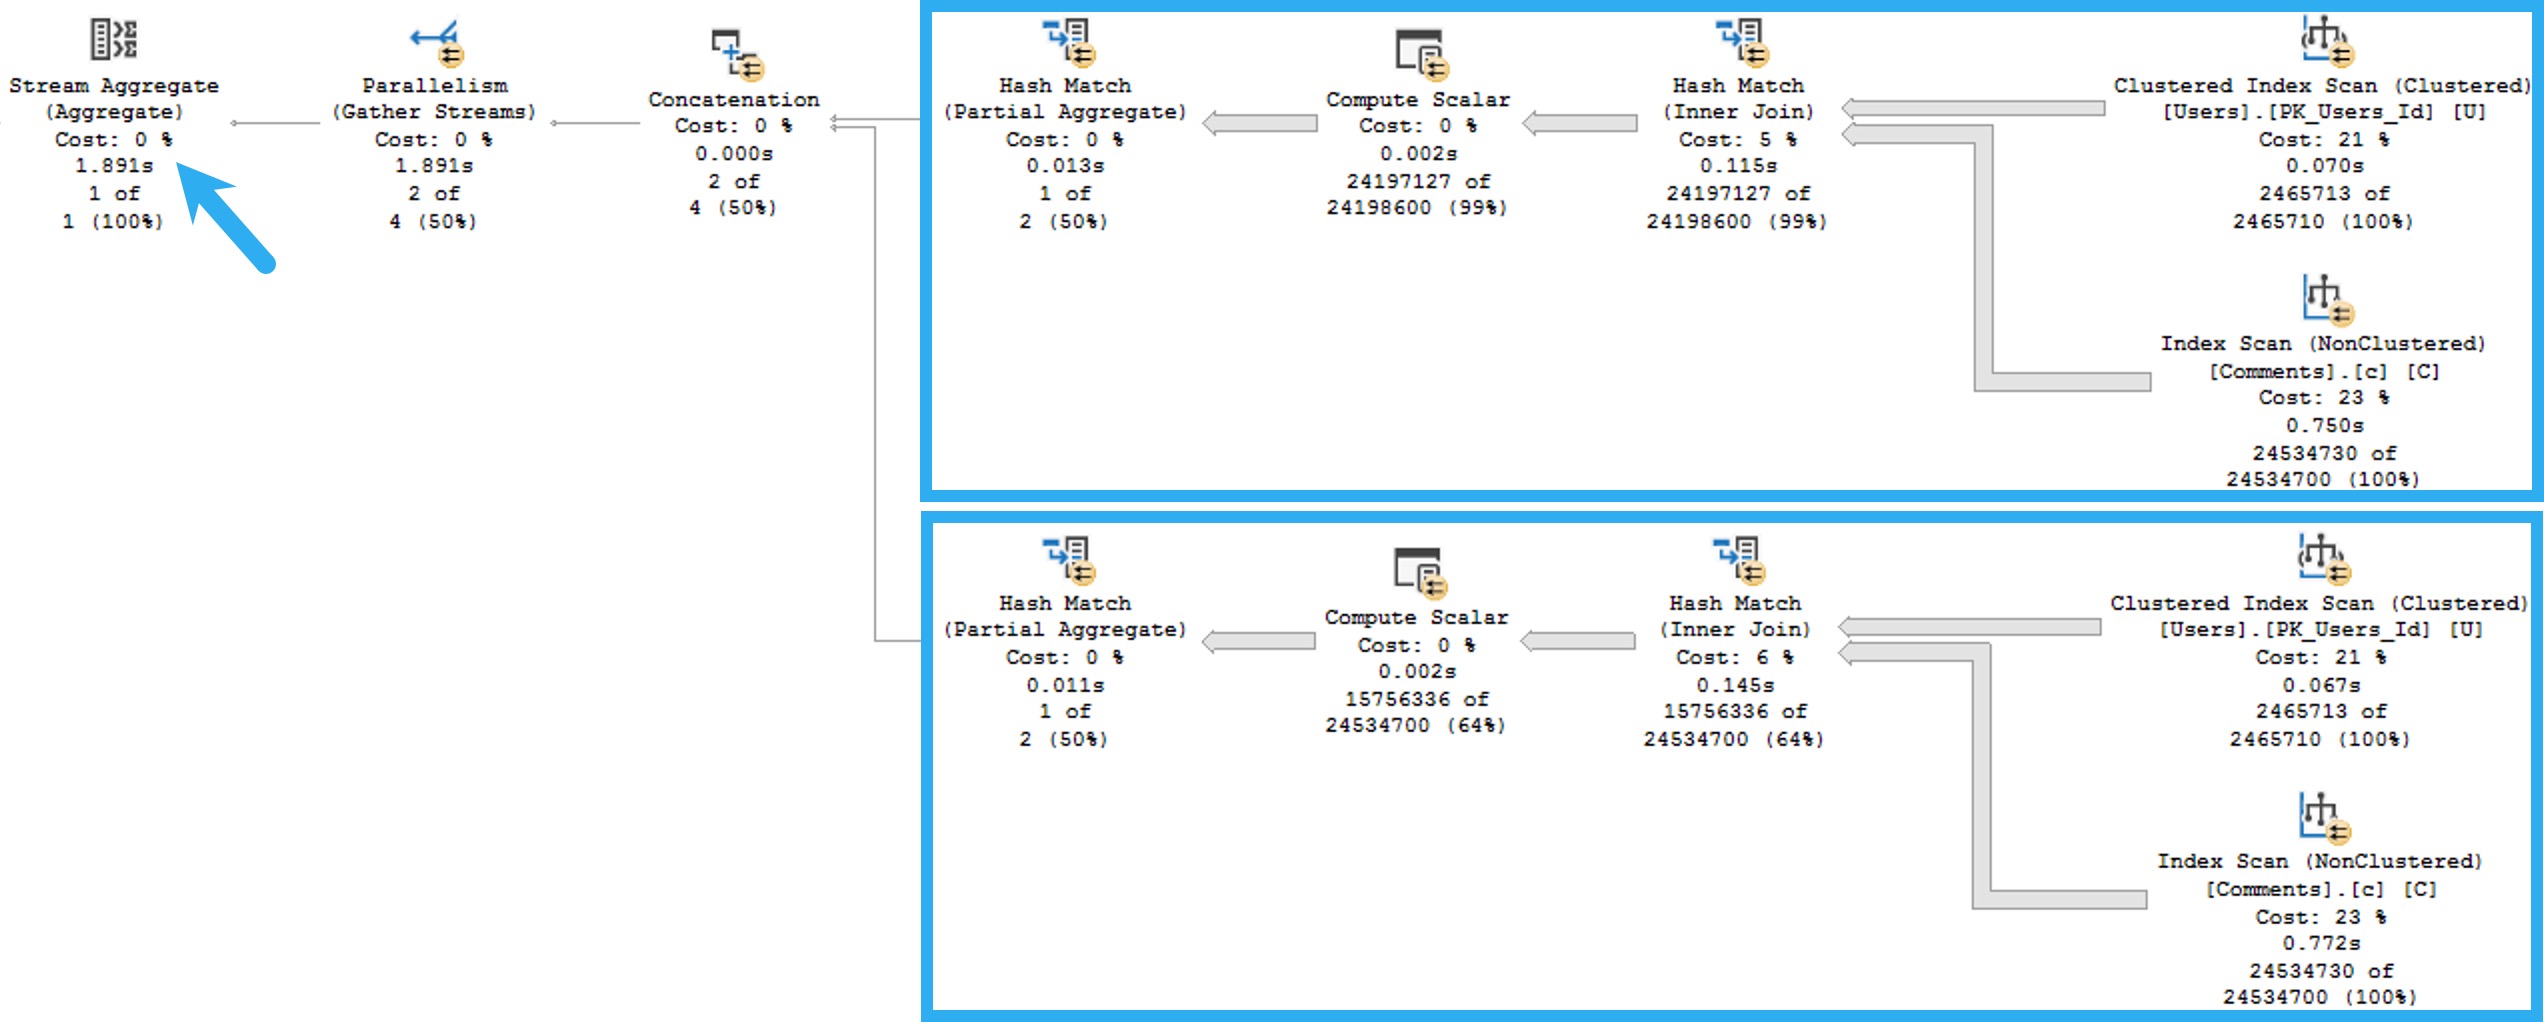
- If CPU is much higher than duration, you have a parallel plan, and tuning is optional
- If duration is much higher than CPU, you have blocking or another contention issue, and the query you’re looking at probably isn’t the problem
- If duration and CPU are roughly equivalent, you either have a functional serial plan or a really crappy parallel plan
I give these the highest priority because reducing these is what makes queries faster, and reduces the surface area (execution time) of a query where something crappy might happen, like blocking, or deadlocks, or other resource contention.
Memory Grants
Using these as a tuning metric can have a lot of positive effects, depending on what kind of shape the system is in.
Consider a few scenarios:
- PAGEIOLATCH_XX waits are high because large memory grants steal significant buffer pool space
- RESOURCE_SEMAPHORE waits are high because queries suck up available memory space and prevent other queries from using it
- Queries are getting too low of a memory grant and spilling significantly, which can slow them down and cause tempdb contention under high concurrency
Fixing memory grant issues can take many forms:
- Getting better cardinality estimates for better overall grant estimates
- Indexing to influence operator choices away from memory consumers
- Using more appropriate string lengths to reduce memory grants
- Fixing parallel skew issues that leaves some threads with inadequate memory
- Rewriting the query to not ask for ordered data
- Rewriting the query to ask for ordered data in smaller chunks
- Rewriting the query to convert strings to better fitting byte lengths
That’s just some stuff I end up doing off the top of my head. There are probably more, but blog posts are only useful up to a certain length.
Like all other strings.
Writes and Selects
Modification queries are going to do writes. This seems intuitive and not at all shocking. If you have queries that are doing particularly large modifications, you could certainly look into tuning those, but it would be a standard exercise in query or index tuning.
Except that your index tuning adventure would most likely lead you to dropping unused and overlapping indexes to reduce the number of objects that you need to write to than to add an index.
But who knows. Boring anyway. I hear indexes tune themselves in the cloud.
When select queries do a large number of writes, then we’re talking about a much more interesting scenario.
- Spills
- Spools
- Stats updates
Of course, stats updates are likely a pretty small write, but the read portion can certainly halt plan compilation for a good but on big tables.
Spills and Spools are going to be the real target here. If it’s a spill, you may find yourself tracking back to the memory grant section up above.
Spools, though! What interesting little creatures. I wrote a longer post about them here:
Understand Your Plan: Operators That Write Data (Spools, Spools, Spools)
It has a bit of a link roundup of other posts on my site and others that talk about them, too.
But since we’re living in this now, let’s try to be present. Here’s the short story on spools that we might try to fix:
- The Spools we typically care about are Table or Index
- They can be eager or lazy
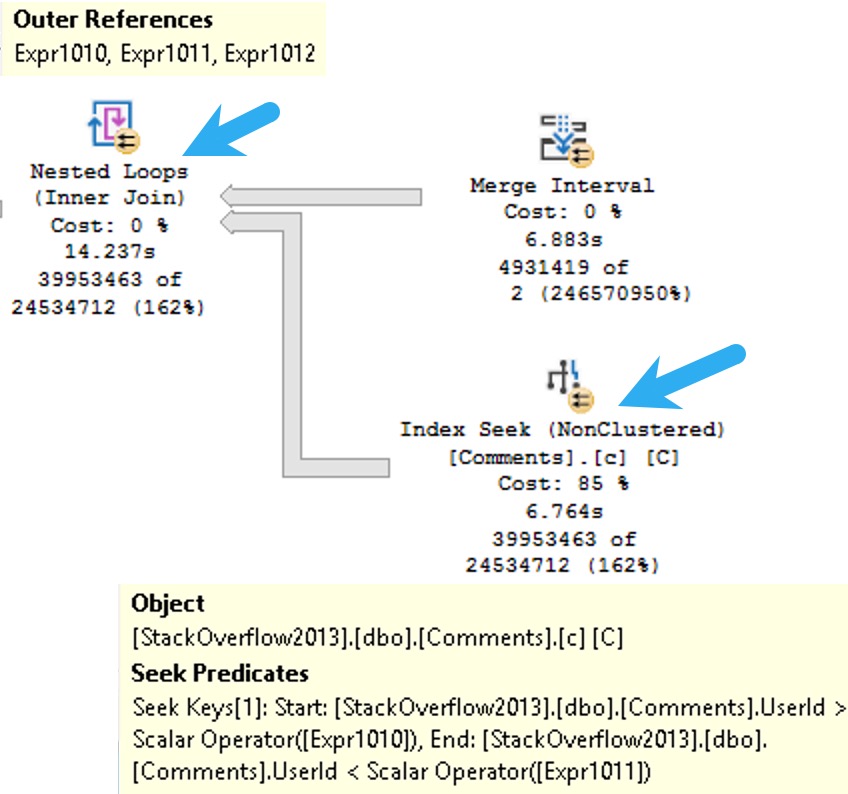
- They’ll show up on the inner side of Nested Loops
- SQL Server uses them as a temporary cache for data
- They are a good indicator that something is amok with your query or indexes
For eager index spools, the story is pretty simple around creating a better index for SQL Server to use.
For lazy table spools, you have more options:
- Give SQL Server unique data to work with
- Get the optimizer to not choose nested loops
- Use the NO_PERFORMANCE_SPOOL hint to test the query without spools
Of course, there are times where you’re better off with a spool than without. So don’t walk away feeling disheartened if that’s the case.
Executions
These are on the opposite end of the spectrum from most of the queries I go after. If a query runs enough, and fast enough, to truly rack up a high number of executions, there’s probably not a ton of tuning you could do.
Sure, sometimes there’s an index you could add or a better predicate you could write, but I’d consider it more beneficial to get the query to not run so much.
That might result in:
- Rewriting functions as inline table valued functions
- Handing the queries off to app developers for caching
To learn how I rewrite functions, check out this video
I know, you can’t rewrite every single function like this, but it’s a wonderful thing to do when you can.
Anything Other Than
Again, metrics I don’t ever look at are logical reads or costs.
- Doing reads doesn’t necessarily mean that queries are slow, or that there’s anything you can fix
- Costs are a meme metric that should be removed from query plans in favor of operator times
Well, okay, maybe not completely removed, but they shouldn’t be front and center anymore.
There are many other more reliable metrics to consider that are also far more interesting.
Thanks for reading!
Going Further
If this is the kind of SQL Server stuff you love learning about, you’ll love my training. I’m offering a 75% discount to my blog readers if you click from here. I’m also available for consulting if you just don’t have time for that and need to solve performance problems quickly.
