What Do Optimizer Timeouts Really Mean In SQL Server Query Plans?

Time Is On My Side


Whenever I’m looking over query plans with clients, their eyes get drawn towards many things that I’ve learned to ignore over the years.

It’s not that they’re never important, it’s just that, you know… There’s usually more important stuff.

One of those things is compilation timeouts. Most people think that it’s time-based, and it means that their query timed out or took a long time to compile.

Not so! It’s purely a set number of steps the optimizer will take to figure out things like:

  • Join order
  • Join/Aggregate type
  • Index usage
  • Seeks vs Scans
  • Parallelism

And probably some other stuff that I just don’t have the Friday afternoon energy to think about any more.

But anyway, the point is that it’s not a sign that your query timed out, or even that plan compilation took a long time.

The initial number of steps allowed is based on the optimizer’s assessment of statement complexity, which includes the number of joins (of course), in case you were wondering.

From there each additional stage gets a set number of steps based on the number of steps that the previous stage took.

Plan Cache Script


You can use this script to look in your plan cache for plans that the optimizer has marked as having a timeout.

WITH 
    XMLNAMESPACES
(
    DEFAULT 'http://schemas.microsoft.com/sqlserver/2004/07/showplan'
)
SELECT
    query_text = 
        SUBSTRING
        (
            st.text,
            qs.statement_start_offset / 2 + 1,
            CASE qs.statement_start_offset
                 WHEN -1 
                 THEN DATALENGTH(st.text)
                 ELSE qs.statement_end_offset
            END - qs.statement_start_offset / 2 + 1
        ),
    compile_time_ms = 
        qs.query_plan.value('(//StmtSimple/QueryPlan/@CompileTime)[1]', 'bigint'),
    compile_cpu_ms = 
        qs.query_plan.value('(//StmtSimple/QueryPlan/@CompileCPU)[1]', 'bigint'),
    compile_memory_mb = 
        qs.query_plan.value('(//StmtSimple/QueryPlan/@CompileMemory)[1]', 'bigint') / 1024.,
    qs.query_plan,
    qs.execution_count,
    qs.total_worker_time,
    qs.last_execution_time
FROM
(
    SELECT TOP (10)
        qs.plan_handle,
        qs.sql_handle,
        qs.statement_start_offset,
        qs.statement_end_offset,
        qs.last_execution_time,
        qs.execution_count,
        qs.total_worker_time,
        qp.query_plan
    FROM sys.dm_exec_query_stats AS qs
    CROSS APPLY sys.dm_exec_query_plan(qs.plan_handle) AS qp
    WHERE qp.query_plan.exist('//StmtSimple/@StatementOptmEarlyAbortReason[.="TimeOut"]') = 1
    ORDER BY
        total_worker_time / qs.execution_count DESC
) AS qs
CROSS APPLY sys.dm_exec_sql_text(qs.sql_handle) AS st;

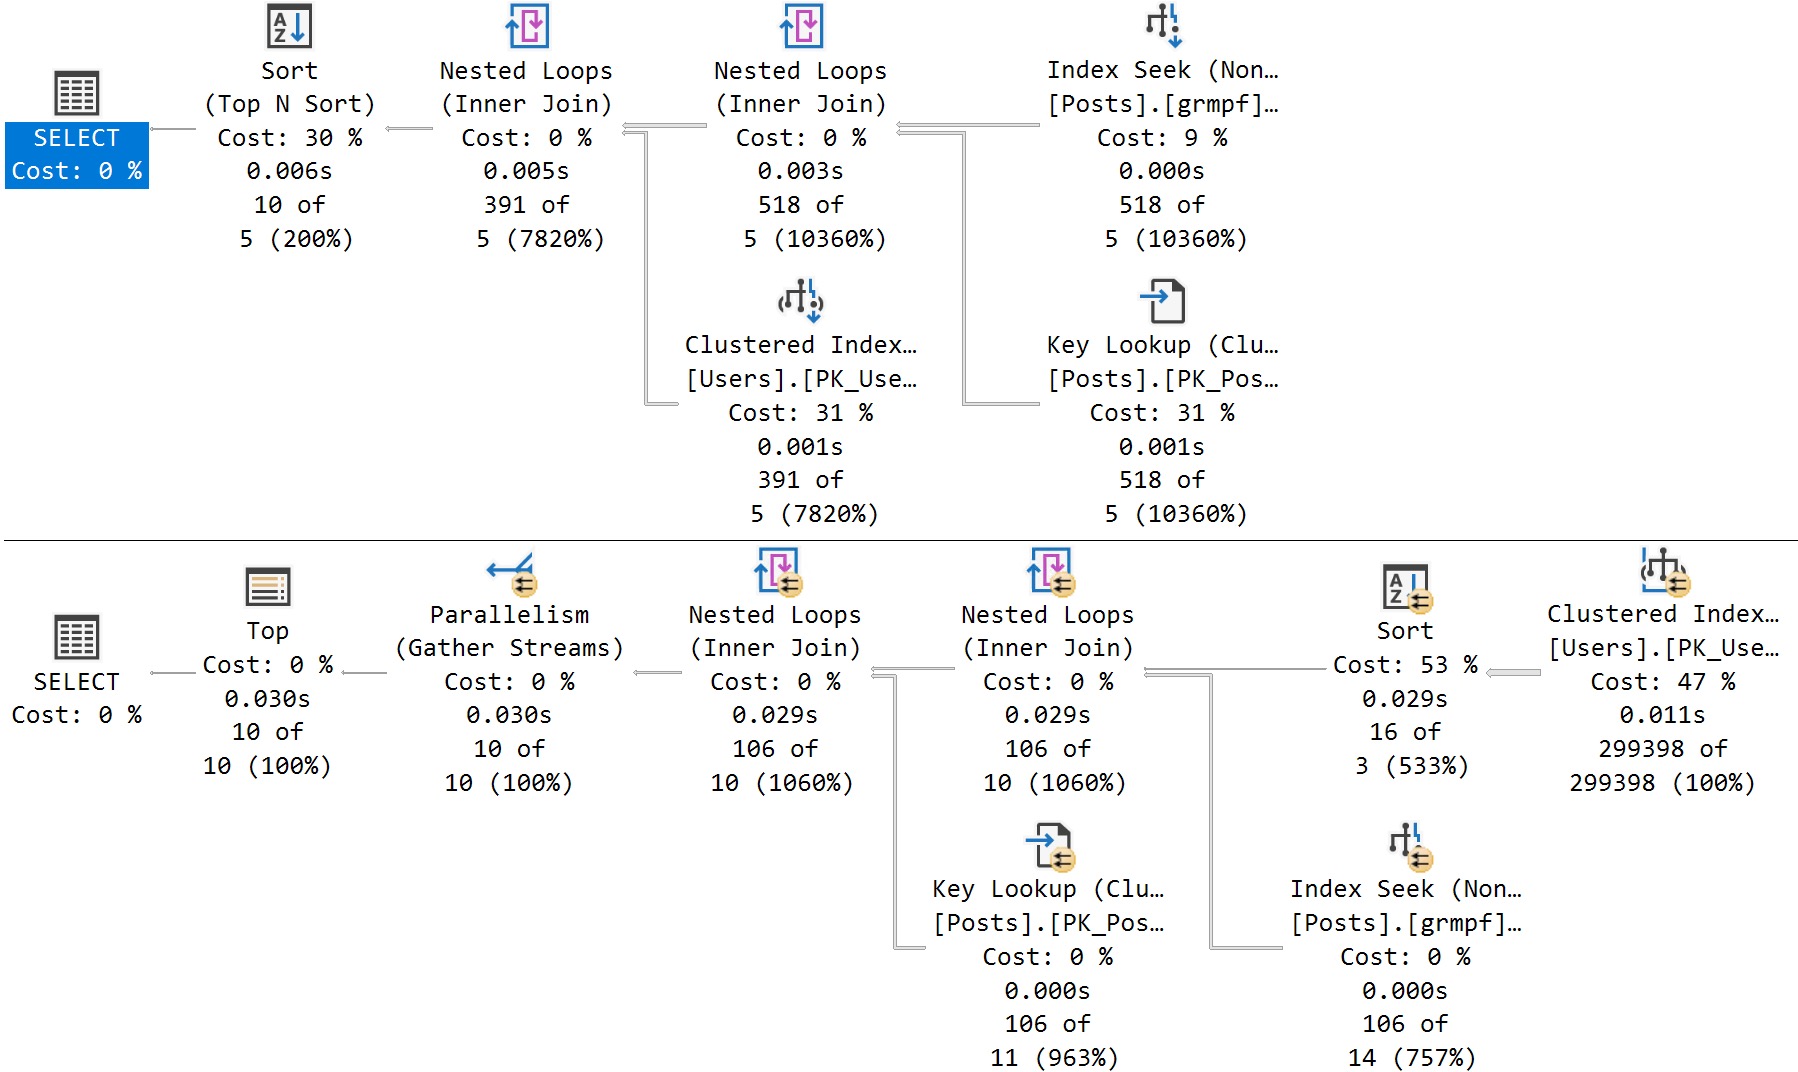
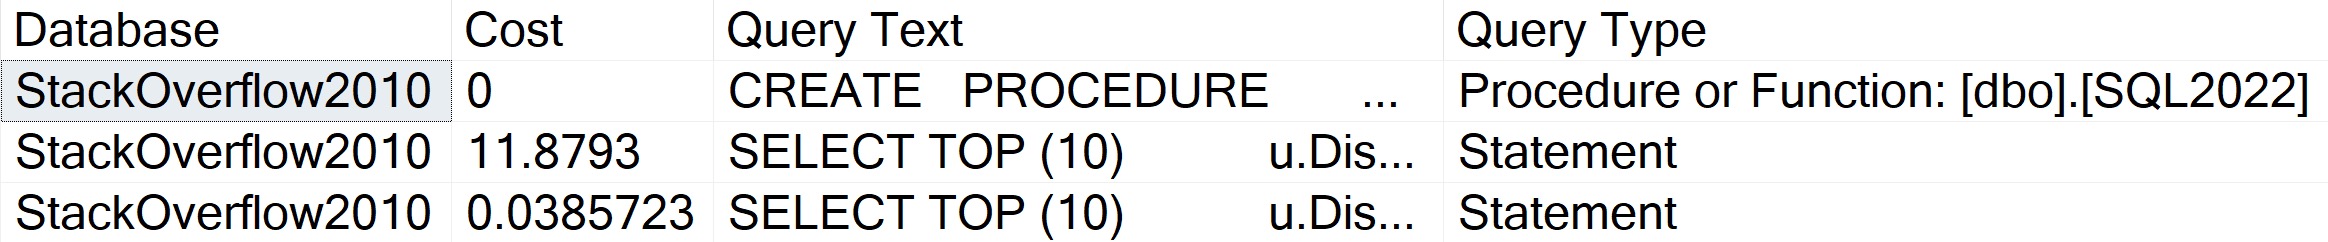
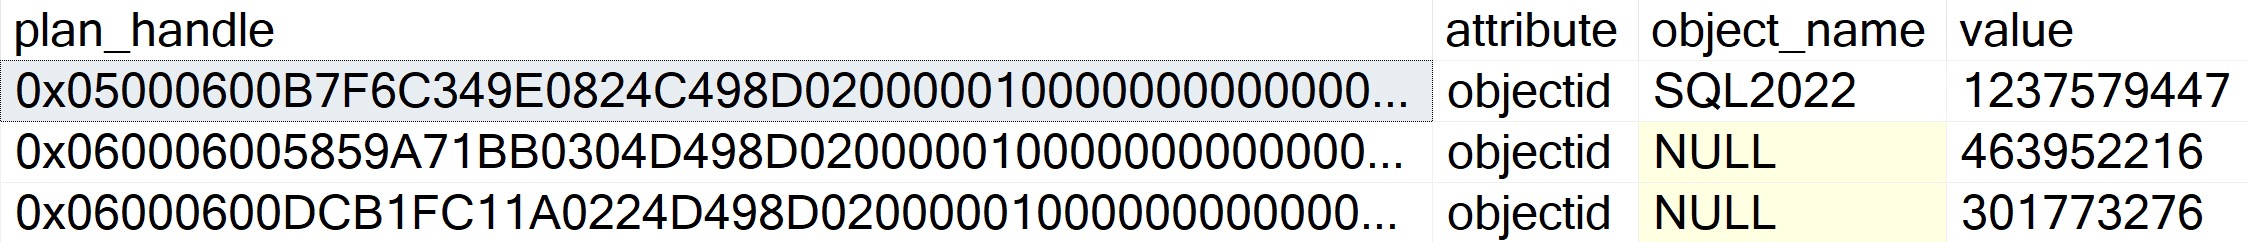
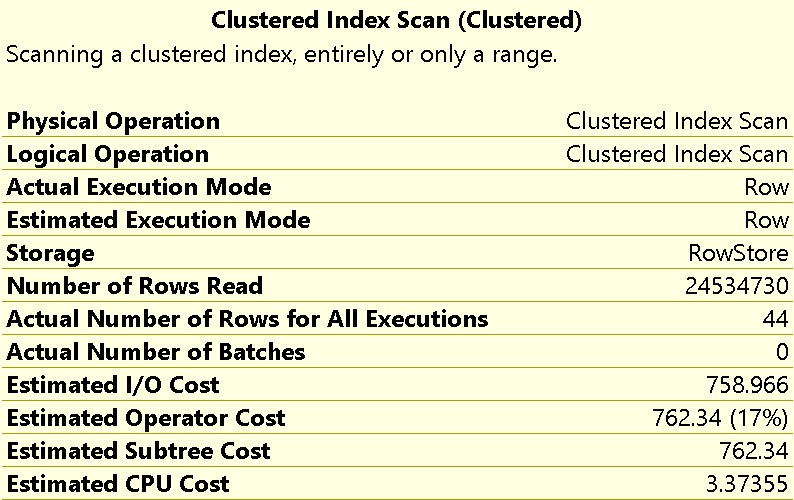
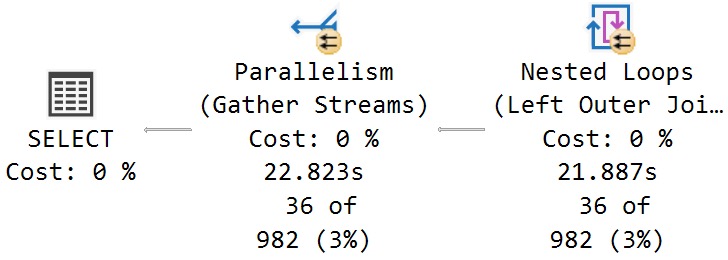
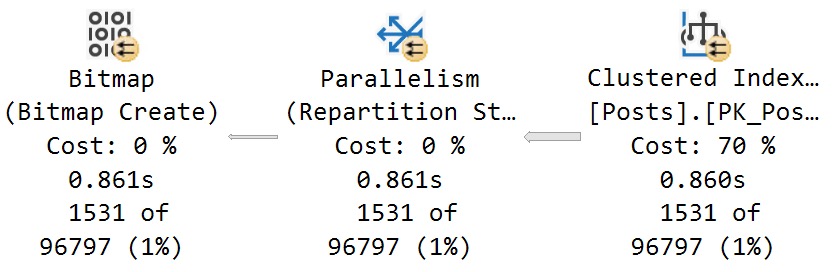
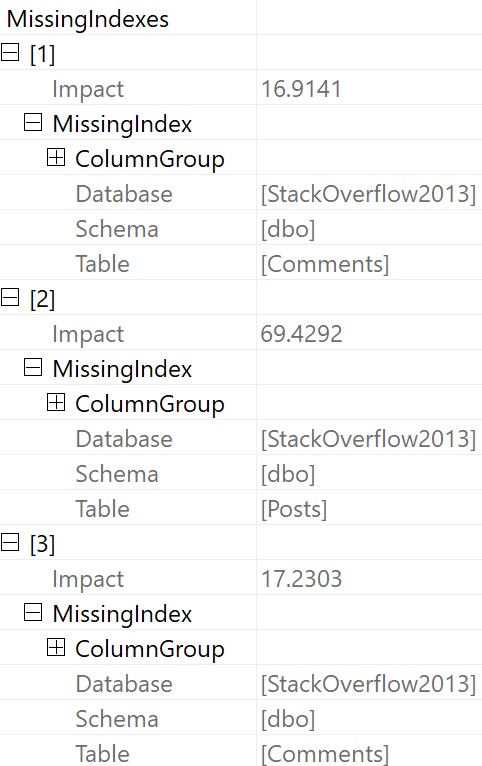
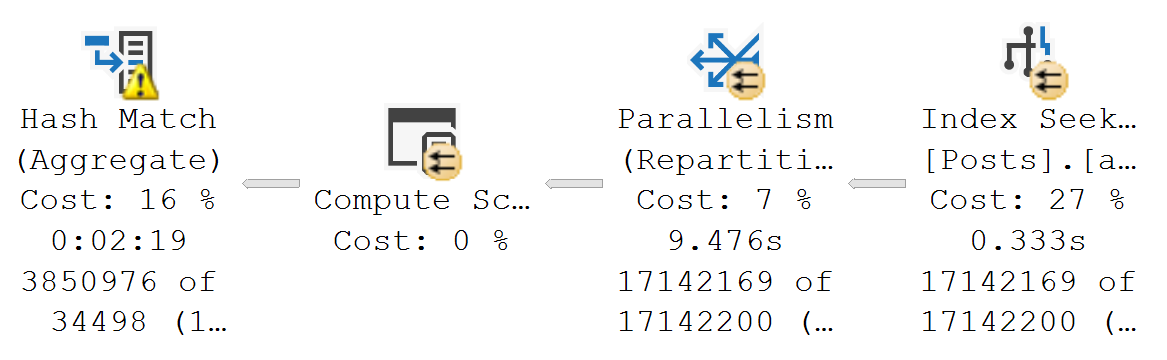
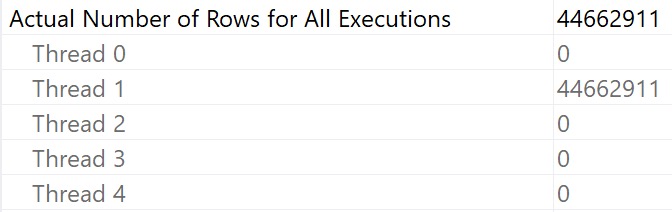
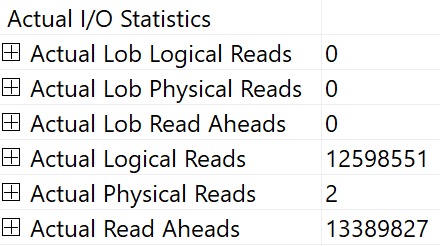
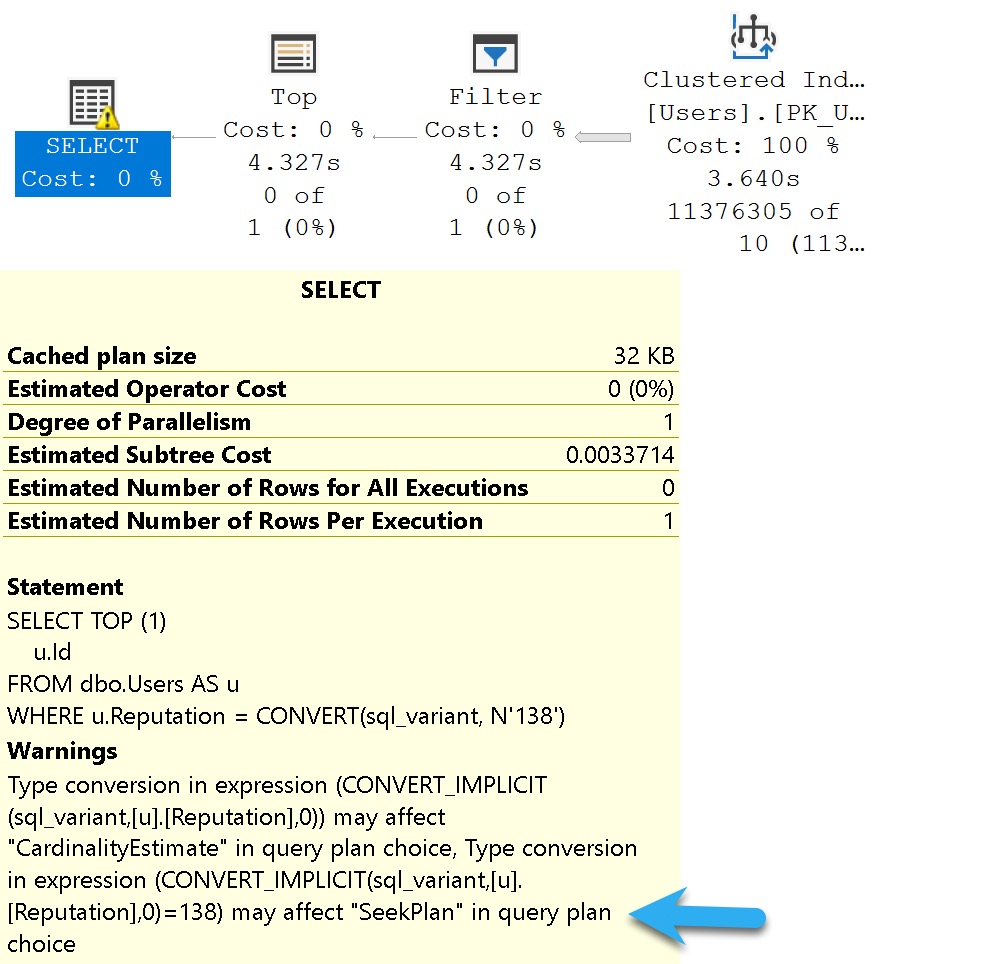
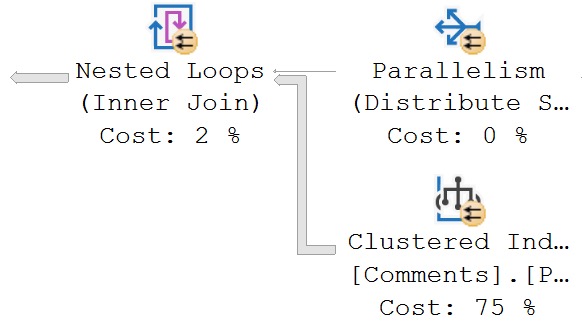
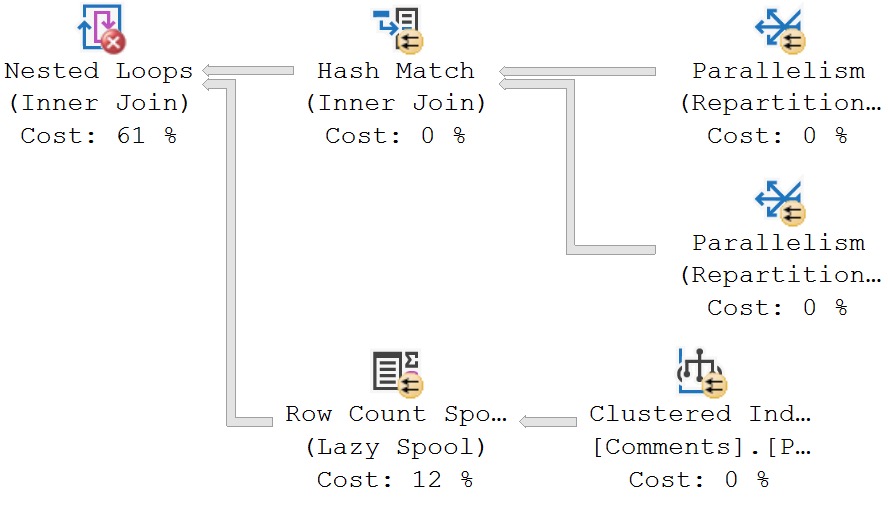
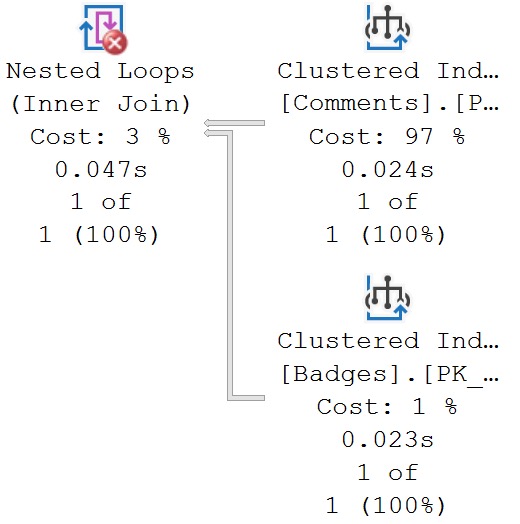
There’s not a whole lot of sense to this query other than to prove a point. Here are some abridged results from a client system:

SQL Server Query Results
amanaplanacanalpanama

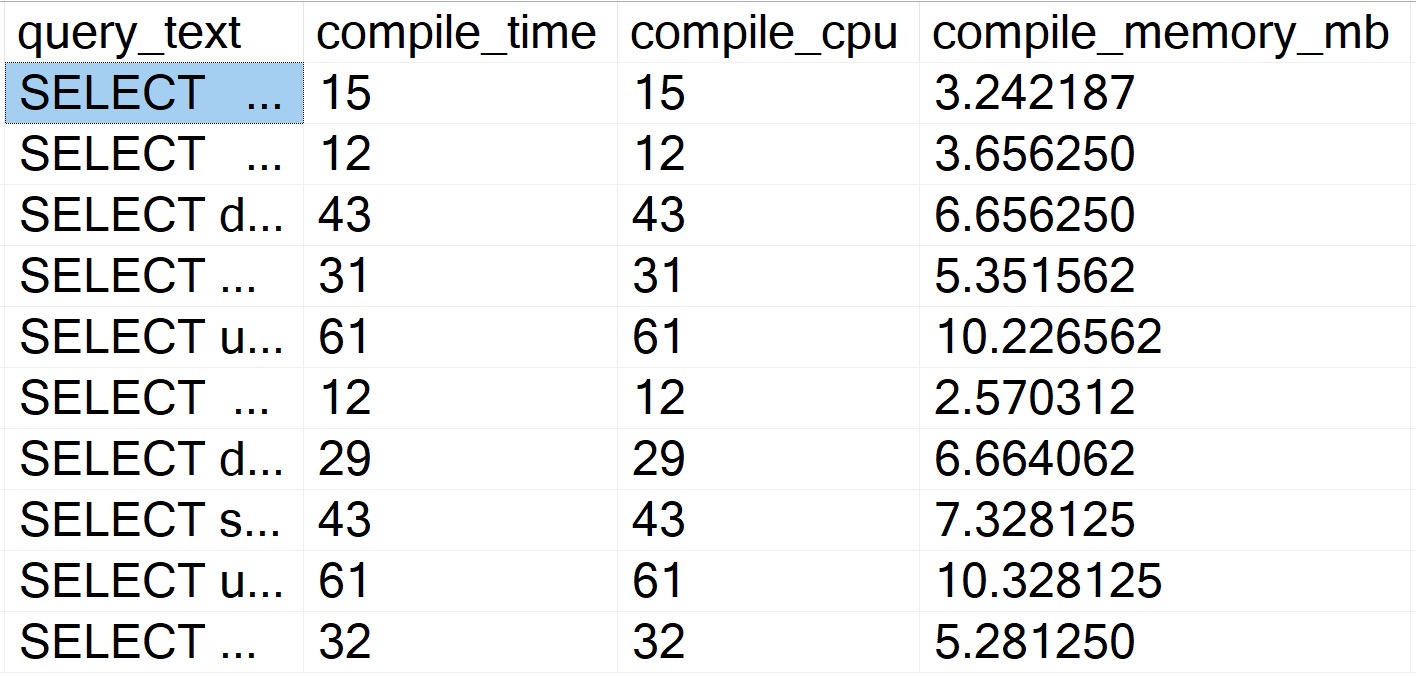
Despite all of these queries “timing out” during optimization phases, the longest compile time is 61 milliseconds.

Query Store Script


Like above, there’s not a lot of sense to this one. It is nice to be able to skip some of the additional XML shredding and go to some of the plan metadata stored in Query Store:

WITH 
    XMLNAMESPACES
(
    DEFAULT 'http://schemas.microsoft.com/sqlserver/2004/07/showplan'
),
    queries
AS
    (
        SELECT TOP (101)
            parent_object_name = 
                ISNULL
                (
                    OBJECT_NAME(qsq.object_id), 
                    'No Parent Object'
                ),
            qsqt.query_sql_text,
            query_plan = 
                TRY_CAST(qsp.query_plan AS xml),
            qsrs.last_execution_time,
            qsrs.count_executions,
            qsrs.avg_duration,
            qsrs.avg_cpu_time,
            avg_compile_duration_ms = 
                qsq.avg_compile_duration / 1000.,
            avg_compile_memory_mb = 
                qsq.avg_compile_memory_kb / 1024.,
            avg_optimize_cpu_time_ms = 
                qsq.avg_optimize_cpu_time / 1024.
        FROM sys.query_store_runtime_stats AS qsrs
        JOIN sys.query_store_plan AS qsp
            ON qsp.plan_id = qsrs.plan_id
        JOIN sys.query_store_query AS qsq
            ON qsq.query_id = qsp.query_id
        JOIN sys.query_store_query_text AS qsqt
            ON qsqt.query_text_id = qsq.query_text_id
        WHERE qsrs.last_execution_time >= DATEADD(DAY, -7, SYSDATETIME())
        AND   qsrs.avg_cpu_time >= (10 * 1000)
        AND   qsq.is_internal_query = 0
        AND   qsp.is_online_index_plan = 0
        AND   TRY_CAST(qsp.query_plan AS xml).exist('//StmtSimple/@StatementOptmEarlyAbortReason[.="TimeOut"]') = 1
        ORDER BY
            qsrs.avg_cpu_time DESC
    )
SELECT
    qs.query_sql_text,
    qs.parent_object_name,    
    qs.query_plan,
    qs.avg_compile_duration_ms,
    qs.avg_optimize_cpu_time_ms,
    qs.avg_compile_memory_mb,
    qs.count_executions,
    qs.avg_duration,
    qs.avg_cpu_time,
    qs.last_execution_time
FROM
    queries AS qs
ORDER BY
    qs.avg_cpu_time DESC
OPTION (RECOMPILE);

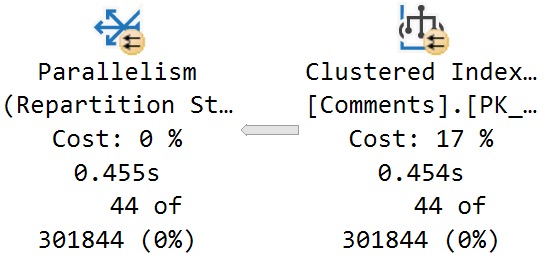
Also like above, the results bring back very short compile times.

So There


The point of this post was that you don’t need to worry about these timeouts from a plan compilation time perspective.

Of course, it may represent a plan quality issue, but that’s much harder to prove from first glances. You’d need to dig into that on your own Friday afternoon.

If you find user queries experiencing optimizer timeouts, it may solve the problem to simplify them as much as possible. Breaking long queries up into #temp tables is a popular solution for this.

Thanks for reading!

Going Further


If this is the kind of SQL Server stuff you love learning about, you’ll love my training. I’m offering a 75% discount to my blog readers if you click from here. I’m also available for consulting if you just don’t have time for that and need to solve performance problems quickly.

SQL Server 2022 Is Going To Mess Up Your Query Monitoring Scripts

At Least For Now


SQL Server 2022 has a new feature in it to help with parameter sensitive query plans.

That is great. Parameter sensitivity, sometimes just called parameter sniffing, can be a real bear to track down, reproduce, and fix.

In a lot of the client work I do, I end up using dynamic SQL like this to get things to behave:

But with this new feature, you get some of the same fixes without having to interfere with the query at all.

How It Works


You can read the full documentation here. But you don’t read the documentation, and the docs are missing some details at the moment anyway.

  • It only works on equality predicates right now
  • It only works on one predicate per query
  • It only gives you three query plan choices, based on stats buckets

There’s also some additional notes in the docs that I’m going to reproduce here, because this is where you’re gonna get tripped up, if your scripts associate statements in the case with calling stored procedures, or using object identifiers from Query Store.

For each query variant mapping to a given dispatcher:

  • The query_plan_hash is unique. This column is available in sys.dm_exec_query_stats, and other Dynamic Management Views and catalog tables.

  • The plan_handle is unique. This column is available in sys.dm_exec_query_statssys.dm_exec_sql_textsys.dm_exec_cached_plans, and in other Dynamic Management Views and Functions, and catalog tables.

  • The query_hash is common to other variants mapping to the same dispatcher, so it’s possible to determine aggregate resource usage for queries that differ only by input parameter values. This column is available in sys.dm_exec_query_statssys.query_store_query, and other Dynamic Management Views and catalog tables.

  • The sql_handle is unique due to special PSP optimization identifiers being added to the query text during compilation. This column is available in sys.dm_exec_query_statssys.dm_exec_sql_textsys.dm_exec_cached_plans, and in other Dynamic Management Views and Functions, and catalog tables. The same handle information is available in the Query Store as the last_compile_batch_sql_handle column in the sys.query_store_query catalog table.

  • The query_id is unique in the Query Store. This column is available in sys.query_store_query, and other Query Store catalog tables.

The problem is that, sort of like dynamic SQL, this makes each different plan/statement impossible to tie back to the procedure.

What I’ve Tried


Here’s a proc that is eligible for parameter sensitivity training:

CREATE OR ALTER PROCEDURE 
    dbo.SQL2022
(
    @ParentId int
)
AS
BEGIN
SET NOCOUNT, XACT_ABORT ON;

    SELECT TOP (10) 
        u.DisplayName, 
        p.*
    FROM dbo.Posts AS p
    JOIN dbo.Users AS u
        ON p.OwnerUserId = u.Id
    WHERE p.ParentId = @ParentId
    ORDER BY u.Reputation DESC;

END;
GO

Here’s the cool part! If I run this stored procedure back to back like so, I’ll get two different query plans without recompiling or writing dynamic SQL, or anything else:

EXEC dbo.SQL2022
    @ParentId = 184618;
GO 

EXEC dbo.SQL2022 
    @ParentId = 0;
GO
SQL Server Query Plan
amazing!

It happens because the queries look like this under the covers:

SELECT TOP (10) 
    u.DisplayName, 
    p.*
FROM dbo.Posts AS p
JOIN dbo.Users AS u
    ON p.OwnerUserId = u.Id
WHERE p.ParentId = @ParentId
ORDER BY u.Reputation DESC 
OPTION (PLAN PER VALUE(QueryVariantID = 1, predicate_range([StackOverflow2010].[dbo].[Posts].[ParentId] = @ParentId, 100.0, 1000000.0)))

SELECT TOP (10) 
    u.DisplayName, 
    p.*
FROM dbo.Posts AS p
JOIN dbo.Users AS u
    ON p.OwnerUserId = u.Id
WHERE p.ParentId = @ParentId
ORDER BY u.Reputation DESC 
OPTION (PLAN PER VALUE(QueryVariantID = 3, predicate_range([StackOverflow2010].[dbo].[Posts].[ParentId] = @ParentId, 100.0, 1000000.0)))

Where Things Break Down


Normally, sp_BlitzCache will go through whatever statements it picks up and associate them with the parent object:

EXEC sp_BlitzCache
    @DatabaseName = 'StackOverflow2010';

But it doesn’t do that here, it just says that they’re regular ol’ statements:

SQL Server Query Results
do i know you?

The way that it attempts to identify queries belonging to objects is like so:

RAISERROR(N'Attempting to get stored procedure name for individual statements', 0, 1) WITH NOWAIT;
UPDATE  p
SET     QueryType = QueryType + ' (parent ' +
                    + QUOTENAME(OBJECT_SCHEMA_NAME(s.object_id, s.database_id))
                    + '.'
                    + QUOTENAME(OBJECT_NAME(s.object_id, s.database_id)) + ')'
FROM    ##BlitzCacheProcs p
        JOIN sys.dm_exec_procedure_stats s ON p.SqlHandle = s.sql_handle
WHERE   QueryType = 'Statement'
AND SPID = @@SPID
OPTION (RECOMPILE);

Since SQL handles no longer match, we’re screwed. I also looked into doing something like this, but there’s nothing here!

SELECT 
    p.plan_handle, 
    pa.attribute, 
    object_name = 
        OBJECT_NAME(CONVERT(int, pa.value)),
    pa.value
FROM
(
    SELECT 0x05000600B7F6C349E0824C498D02000001000000000000000000000000000000000000000000000000000000 --Proc plan handle
    UNION ALL 
    SELECT 0x060006005859A71BB0304D498D02000001000000000000000000000000000000000000000000000000000000 --Query plan handle
    UNION ALL
    SELECT 0x06000600DCB1FC11A0224D498D02000001000000000000000000000000000000000000000000000000000000 --Query plan handle
) AS p (plan_handle)
CROSS APPLY sys.dm_exec_plan_attributes (p.plan_handle) AS pa
WHERE pa.attribute = 'objectid';

The object identifiers are all amok:

SQL Server Query Results
oops i didn’t do it again

Only the stored procedure has the correct one.

The same thing happens in Query Store, too:

EXEC sp_QuickieStore
    @debug = 1;
SQL Server Query Result
lost in translation

The object identifiers are 0 for these two queries.

One Giant Leap


This isn’t a complaint as much as it is a warning. If you’re a monitoring tool vendor, script writer, or script relier, this is gonna make things harder for you.

Perhaps it’s something that can or will be fixed in a future build, but I have no idea at all what’s going to happen with it.

Maybe we’ll have to figure out a different way to do the association, but stored procedures don’t get query hashes or query plan hashes, only the queries inside it do.

This is gonna be a tough one!

Thanks for reading!

Going Further


If this is the kind of SQL Server stuff you love learning about, you’ll love my training. I’m offering a 75% discount to my blog readers if you click from here. I’m also available for consulting if you just don’t have time for that and need to solve performance problems quickly.

What Do Missing Index Requests Really Mean In SQL Server?

Scripts Ahoy


There are a million scripts out there that will give you all of the missing index requests for a database (or even a whole server).

Some will even try to prioritize based on the metrics logged along with each request.

Right now, most of you get:

  • Uses: How many times a query compiled that could have used the index
  • Average Query Cost: A unit-less cost used by the optimizer for choosing a plan
  • Impact: A metric relative to the unit-less cost of the operator the index will help

Breaking each of those down, the only one that has a concrete meaning is Uses, but that of course doesn’t mean that a query took a long time or is even terribly inefficient.

That leaves us with Average Query Cost, which is the sum of each operator’s estimated cost in the query plan, and Impact.

But where does Impact come from?

Impactful


Let’s look at a query plan with a missing index request to figure out what the Impact metric is tied to.

Here’s the relevant part of the plan:

SQL Server Query Plan
sticky kid

And here’s the missing index request:

/*
The Query Processor estimates that implementing the following index could improve the query cost by 16.9141%.
*/

/*
USE [StackOverflow2013]
GO
CREATE NONCLUSTERED INDEX [<Name of Missing Index, sysname,>]
ON [dbo].[Comments] ([Score])
INCLUDE ([PostId])
GO
*/

Here’s the breakdown:

  • The optimizer estimates that hitting the Comments table will cost 762 query bucks, which is 17% of the total plan cost
  • The optimizer further estimates that hitting the Comments table with the suggested index will reduce the total plan cost by 16.9%

Here’s the relevant properties from the scan of the Comments table:

SQL Server Query Plan
Indecisive

What I want you to take away from this is that, while hitting the Comments table may be 17% of the plan’s total estimated cost, the time spent scanning that index is not 17% of the plan’s total execution time, either in CPU or duration.

You can see in the screenshot above that it takes around 450ms to perform the full scan of 24,534,730 rows.

Doubtful


In full, this query runs for around 23 seconds:

SQL Server Query Plan
outta here

The estimated cost of hitting the Comments tables is not 17% of the execution time. That time lives elsewhere, which we’ll get to.

In the meantime, there are two more egregious problems to deal with:

  1. The optimizer severely miscalculates the cost of scanning the Posts table at 70% (note the 860ms time here):
SQL Server Query Plan
oh no no no

2. It buries other missing index requests in the properties of the root operator:

SQL Server Missing Index Request
train tracks

Now, there are two other missing index requests listed here that are a) of higher “impact” b) not ordered by that impact number and c) even if both a and b were true, we know that adding those indexes would not substantially reduce the overall runtime of the stored procedure.

Assuming that we added every single missing index here, at best we would reduce the estimated cost of the plan by 87%, while only reducing the actual execution time of the plan by about 1.3 seconds out of 23 seconds.

Not a big win, here.

Hurtful


Examining where time is spent in this plan, this branch will stick out as the dominating factor:

SQL Server Query Plan
baby don’t do it

Some interesting things to note here, while we’re talking about interesting things:

  • The scan of the Badges table takes 1.4 seconds, and has an estimated cost of 1%
  • The estimated cost of the eager index spool is 11%, but accounts for 20 seconds of elapsed time (less the 1.4 seconds for the scan of Badges)
  • There was no missing index request generated for the Badges table, despite the optimizer creating one on the fly

This is a bit of the danger in creating missing index requests without first validating which queries generated them, and where the benefit in having them would be.

In tomorrow’s post, we’ll look at how SQL Server 2019 makes figuring this stuff out easier.

Thanks for reading!

Going Further


If this is the kind of SQL Server stuff you love learning about, you’ll love my training. I’m offering a 75% discount to my blog readers if you click from here. I’m also available for consulting if you just don’t have time for that and need to solve performance problems quickly.

Using Views To Reduce Memory Grants In SQL Server

We All Have It


You know those tables, right? The ones where developers went and got lazy or didn’t know any better and decided every string column was going to be gigantic.

They may have read, of course, that SQL Server’s super-smart variable length data types only consume necessary space.

It’s free real estate.

Except it isn’t, especially not when it comes to query memory grants.

The bigger a string column’s defined byte length is, the bigger the optimizer’s memory grant for it will be.

Memory Grant Primer


In case you need some background, the short story version is:

  • All queries ask for some memory for general execution needs
  • Sorts, Hashes, and Optimized Nested Loops ask for additional memory grants
  • Memory grants are decided based on things like number of rows, width of rows, and concurrently executing operators
  • Memory grants are divided by DOP, not multiplied by DOP
  • By default, any query can ask for up to 25% of max server memory for a memory grant
  • Approximately 75% of max server memory is available for memory grants at one

Needless to say, memory grants are very sensitive to misestimates by the optimizer. Going over can be especially painful, because that memory will most often get pulled from the buffer pool, and queries will end up going to disk more.

Underestimates often mean spills to disk, of course. Those are usually less painful, but can of course be a problem when they’re large enough. In particular, hash spills are worth paying extra attention to.

Memory grant feedback does supply some relief under modern query execution models. That’s a nice way of saying probably not what you have going on.

Query Noogies


Getting back to the point: It’s a real pain in the captain’s quarters to modify columns on big tables, even if it’s reducing the size.

SQL Server’s storage engine has to check page values to make sure you’re not gonna lose any data fidelity in the process. That’ a nice way of saying you’re not gonna truncate any strings.

But if you do something cute like run a MAX(LEN(StringCol) and see what you’re up against, you can use a view on top of your table to assuage SQL Server’s concerns about such things.

After all, functions are temporary. Data types are forever (usually).

An easy way to illustrate what I mean is to look at the details of these two queries:

SELECT TOP (1000)
    p.Body
FROM dbo.Posts AS p
ORDER BY p.Score DESC
OPTION(RECOMPILE);

SELECT TOP (1000)
    Body = 
        CONVERT
        (
            nvarchar(100), 
            p.Body
        )
FROM dbo.Posts AS p
ORDER BY p.Score DESC
OPTION(RECOMPILE);

Some of this working is dependent on the query plan, so let’s look at those.

Pink Belly Plans


You can ignore the execution times here. The Body column is not a good representation of an oversized column.

It’s defined as nvarchar(max), but (if I’m remembering my Stack lore correctly) is internally limited to 30k characters. Many questions and answers are longer than 100 characters anyway, but on to the plans!

SQL Server Query Plan
janitor

In the plan where the Body column isn’t converted to a smaller string length, the optimizer asks for a 16GB memory grant, and in the second plan the grant is reduced to ~3.5GB.

This is dependent on the compute scalar occurring prior to the Top N Sort operator, of course. This is where the convert function is applied to the Body column, and why the grant is reduced

If you were to build a view on top of the Posts table with this conversion, you could point queries to the view instead. That would get you the memory grant reduction without the pain of altering the column, or moving the data into a new table with the correct definition.

Thanks for reading!

Going Further


If this is the kind of SQL Server stuff you love learning about, you’ll love my training. I’m offering a 75% discount to my blog readers if you click from here. I’m also available for consulting if you just don’t have time for that and need to solve performance problems quickly.

SQL Server Performance Mysteries: Why Does Production Get A Bad Plan That Development Doesn’t?

Statistical Legacy


A client question that I get quite a bit is around why queries in production get a bad query plan that queries in dev, QA, or staging don’t get is typically answered by looking at statistics.

Primarily, it’s because of the cardinality estimates that queries get around ascending keys. It usually gets called the ascending key problem, but the gist is that:

  • You have a pretty big table
  • You’re using the legacy cardinality estimator
  • A whole bunch of rows get inserted, but not enough to trigger an auto stats update
  • You’re not using compatibility level >= 130 or trace flag 2371
  • Queries that look for values off an available histogram get a one row estimate using the legacy Cardinality Estimator or a 30% estimate using the default Cardinality Estimator

Which is a recipe for potentially bad query plans.

Reproductive Script


Here’s the full repro script. If you’re using a different Stack Overflow database, you’ll need to adjust the numbers.

USE StackOverflow2013;

/*Figure out the 20% mark for stats updates using legacy compat levels*/
SELECT
    c = COUNT_BIG(*),
    c20 = CEILING(COUNT_BIG(*) * .20)
FROM dbo.Users AS u;

/*Stick that number of rows into a new table*/
SELECT TOP (493143)
    u.*
INTO dbo.Users_Holder
FROM dbo.Users AS u
ORDER BY u.Id DESC;


/*Delete that number of rows from Users*/
WITH 
    del AS
(
SELECT TOP (493143)
    u.*
FROM dbo.Users AS u
ORDER BY u.Id DESC
)
DELETE
FROM del;

/*I'm using this as a shortcut to turn off auto stats updates*/
UPDATE STATISTICS dbo.Users WITH NORECOMPUTE;

/*Put the rows back into the Users Table*/
SET IDENTITY_INSERT dbo.Users ON;

INSERT
    dbo.Users
(
    Id,
    AboutMe,
    Age,
    CreationDate,
    DisplayName,
    DownVotes,
    EmailHash,
    LastAccessDate,
    Location,
    Reputation,
    UpVotes,
    Views,
    WebsiteUrl,
    AccountId
)
SELECT
    uh.Id,
    uh.AboutMe,
    uh.Age,
    uh.CreationDate,
    uh.DisplayName,
    uh.DownVotes,
    uh.EmailHash,
    uh.LastAccessDate,
    uh.Location,
    uh.Reputation,
    uh.UpVotes,
    uh.Views,
    uh.WebsiteUrl,
    uh.AccountId
FROM dbo.Users_Holder AS uh;

SET IDENTITY_INSERT dbo.Users OFF;

/*Figure out the minimum Id we put into the holder table*/
SELECT
    m = MIN(uh.Id)
FROM dbo.Users_Holder AS uh;

/*Compare estimates*/
SELECT
    c = COUNT_BIG(*)
FROM dbo.Users AS u
WHERE u.Id > 2623772
OPTION(USE HINT('FORCE_LEGACY_CARDINALITY_ESTIMATION'));


SELECT
    c = COUNT_BIG(*)
FROM dbo.Users AS u
WHERE u.Id > 2623772
OPTION(USE HINT('FORCE_DEFAULT_CARDINALITY_ESTIMATION'));

/*Cleanup*/
UPDATE STATISTICS dbo.Users;

TRUNCATE TABLE dbo.Users_Holder;

Query Plans


Here are the plans for the stars of our show:

SQL Server Query Plan
king push

In these query plans, you can see the legacy cardinality estimator gets a one row estimate, and the default cardinality estimator gets a 30% estimate.

There isn’t necessarily a one-is-better-than-the-other answer here, either. There are times when both can cause poor plan choices.

You can think of this scenario as being fairly similar to parameter sniffing, where one plan choice does not fit all executions well.

Checkout


There are a lot of ways that you can go about addressing this.

In some cases, you might be better off using trace flag 2371 to trigger more frequent auto stats updates on larger tables where the ~20% modification counter doesn’t get hit quickly enough. In others, you may want to force one estimator over the other depending on which gets you a better plan for most cases.

Another option is to add hints to the query in question to use the default cardinality estimator (FORCE_DEFAULT_CARDINALITY_ESTIMATION), or to generate quick stats for the index/statistics being used (ENABLE_HIST_AMENDMENT_FOR_ASC_KEYS). Documentation for both of those hints is available here. Along these lines, trace flags 2389, 2390, or 4139 may be useful as well.

Of course, you could also try to address any underlying query or index issues that may additionally contribute to poor plan choices, or just plan differences. A common problem in them is a seek + lookup plan for the one row estimate that doesn’t actually make sense when the actual number of rows and lookup executions are encountered at runtime.

Thanks for reading!

Going Further


If this is the kind of SQL Server stuff you love learning about, you’ll love my training. I’m offering a 75% discount to my blog readers if you click from here. I’m also available for consulting if you just don’t have time for that and need to solve performance problems quickly.

CPU & RAM Don’t Lie: Query Metrics I Care About For Tuning

Discarded


There are metrics that I care and don’t care about when I’m looking for queries to tune.

Metrics I don’t care about:

  • Logical Reads
  • Costs

If a query does “a lot” of reads or has a high “cost”, I generally don’t care as long as they run quickly. Doing consistent physical reads is a slightly different story, but would probably fall more under server tuning or fixing memory grants.

Metrics I do care about:

  • CPU (taking parallelism into consideration)
  • Duration (compared to CPU)
  • Memory Grants (particularly when they’re not being fully utilized)
  • Writes (especially if it’s just a select)
  • Executions (mostly to track down scalar UDFs)

CPU and Duration


These two metrics get lumped together because they need to be compared in order to figure out what’s going on. First, you need to figure out what the minimum runtime of a query is that you want to tune.

In general, as query execution time gets faster, getting it to be much faster gets more difficult.

  • Bringing a query from 1 second to 100 milliseconds might be a small matter
  • Bringing that same query from 100 milliseconds to 1 millisecond might take more time than it’s worth

I say that because unless someone is querying SQL Server directly, smaller durations tend to be less detectable to end users. By the time they hit a button, send the request, receive the data, and have the application render it etc. they’re probably not aware of a 99 millisecond difference.

Of course, not everything is end-user centric. Other internal operations, especially any loop processing, might benefit greatly from reductions on the smaller side of things.

  • If duration and CPU are acceptable, leave it alone
  • If either is unacceptable, tune the darn thing
  • If CPU is much higher than duration, you have a parallel plan, and tuning is optional
  • If duration is much higher than CPU, you have blocking or another contention issue, and the query you’re looking at probably isn’t the problem
  • If duration and CPU are roughly equivalent, you either have a functional serial plan or a really crappy parallel plan

I give these the highest priority because reducing these is what makes queries faster, and reduces the surface area (execution time) of a query where something crappy might happen, like blocking, or deadlocks, or other resource contention.

Memory Grants


Using these as a tuning metric can have a lot of positive effects, depending on what kind of shape the system is in.

Consider a few scenarios:

  • PAGEIOLATCH_XX waits are high because large memory grants steal significant buffer pool space
  • RESOURCE_SEMAPHORE waits are high because queries suck up available memory space and prevent other queries from using it
  • Queries are getting too low of a memory grant and spilling significantly, which can slow them down and cause tempdb contention under high concurrency

Fixing memory grant issues can take many forms:

  • Getting better cardinality estimates for better overall grant estimates
  • Indexing to influence operator choices away from memory consumers
  • Using more appropriate string lengths to reduce memory grants
  • Fixing parallel skew issues that leaves some threads with inadequate memory
  • Rewriting the query to not ask for ordered data
  • Rewriting the query to ask for ordered data in smaller chunks
  • Rewriting the query to convert strings to better fitting byte lengths

That’s just some stuff I end up doing off the top of my head. There are probably more, but blog posts are only useful up to a certain length.

Like all other strings.

Writes and Selects


Modification queries are going to do writes. This seems intuitive and not at all shocking. If you have queries that are doing particularly large modifications, you could certainly look into tuning those, but it would be a standard exercise in query or index tuning.

Except that your index tuning adventure would most likely lead you to dropping unused and overlapping indexes to reduce the number of objects that you need to write to than to add an index.

But who knows. Boring anyway. I hear indexes tune themselves in the cloud.

When select queries do a large number of writes, then we’re talking about a much more interesting scenario.

  • Spills
  • Spools
  • Stats updates

Of course, stats updates are likely a pretty small write, but the read portion can certainly halt plan compilation for a good but on big tables.

Spills and Spools are going to be the real target here. If it’s a spill, you may find yourself tracking back to the memory grant section up above.

Spools, though! What interesting little creatures. I wrote a longer post about them here:

Understand Your Plan: Operators That Write Data (Spools, Spools, Spools)

It has a bit of a link roundup of other posts on my site and others that talk about them, too.

But since we’re living in this now, let’s try to be present. Here’s the short story on spools that we might try to fix:

  • The Spools we typically care about are Table or Index
  • They can be eager or lazy
  • They’ll show up on the inner side of Nested Loops
  • SQL Server uses them as a temporary cache for data
  • They are a good indicator that something is amok with your query or indexes

For eager index spools, the story is pretty simple around creating a better index for SQL Server to use.

For lazy table spools, you have more options:

  • Give SQL Server unique data to work with
  • Get the optimizer to not choose nested loops
  • Use the NO_PERFORMANCE_SPOOL hint to test the query without spools

Of course, there are times where you’re better off with a spool than without. So don’t walk away feeling disheartened if that’s the case.

Executions


These are on the opposite end of the spectrum from most of the queries I go after. If a query runs enough, and fast enough, to truly rack up a high number of executions, there’s probably not a ton of tuning you could do.

Sure, sometimes there’s an index you could add or a better predicate you could write, but I’d consider it more beneficial to get the query to not run so much.

That might result in:

  • Rewriting functions as inline table valued functions
  • Handing the queries off to app developers for caching

To learn how I rewrite functions, check out this video

I know, you can’t rewrite every single function like this, but it’s a wonderful thing to do when you can.

Anything Other Than


Again, metrics I don’t ever look at are logical reads or costs.

  • Doing reads doesn’t necessarily mean that queries are slow, or that there’s anything you can fix
  • Costs are a meme metric that should be removed from query plans in favor of operator times

Well, okay, maybe not completely removed, but they shouldn’t be front and center anymore.

There are many other more reliable metrics to consider that are also far more interesting.

Thanks for reading!

Going Further


If this is the kind of SQL Server stuff you love learning about, you’ll love my training. I’m offering a 75% discount to my blog readers if you click from here. I’m also available for consulting if you just don’t have time for that and need to solve performance problems quickly.

Getting Parameter Values From A SQL Server Query Plan For Performance Tuning

Property Management


I’m a really big fan of using operator properties for a lot of things, at least visually. Where things sort of fall down for that is copying and pasting things out.

For some stuff, you still need to head down to the XML.

Let’s say you have a stored procedure that accepts a bunch of parameters. The rest of this one isn’t important, but here you go:

CREATE OR ALTER PROCEDURE 
    dbo.AwesomeSearchProcedure 
( 
    @OwnerUserId int = NULL, 
    @CreationDate datetime = NULL, 
    @LastActivityDate datetime = NULL,
    @PostTypeId int = NULL,
    @Score int = NULL,
    @Title nvarchar(250) = NULL, 
    @Body nvarchar(MAX) = NULL 
)

A Plan Appears


Let’s say we grab a query plan for this thing from the plan cache or query store. We can get the properties of the select operator and see compile time values:

EXEC dbo.AwesomeSearchProcedure 
    @OwnerUserId = 35004,
    @CreationDate = '20130101', 
    @LastActivityDate = '20140101',
    @Title = N'SQL Server';

We get this back:

SQL Server Query Plan
visio

Again — nice visually — but it doesn’t do much for us if we want to recreate executing the stored procedure to get an actual execution plan.

It’s also not terrible helpful if we want to simulate a parameter sniffing situation, because we only have the compile time values, not the run time values.

Bummer. But whatever.

XML Time!


If we right click and select “show execution plan XML”, we can scroll way down to the bottom to find the XML fragment that holds what the properties display:

<ParameterList>
  <ColumnReference Column="@iTitle" ParameterDataType="nvarchar(250)" ParameterCompiledValue="N'SQL Server'" />
  <ColumnReference Column="@iLastActivityDate" ParameterDataType="datetime" ParameterCompiledValue="'2014-01-01 00:00:00.000'" />
  <ColumnReference Column="@iCreationDate" ParameterDataType="datetime" ParameterCompiledValue="'2013-01-01 00:00:00.000'" />
  <ColumnReference Column="@iOwnerUserId" ParameterDataType="int" ParameterCompiledValue="(35004)" />
</ParameterList>

This still isn’t awesome, because we have to do some surgery on the XML itself to get values out.

It’s even worse if we have a parameterized application query, because not only do we need to make a DECLARE to assign values to these variables but we need to turn the query itself into dynamic SQL.

If we don’t do that, we’ll fall victim to a common pitfall: testing queries with local variables.

Passwords


For most things, I absolutely adore using operator properties. For some things, you still need the XML.

It’d be nice if there were some fancy copy and paste magic that would do that for you, but so far it doesn’t exist.

Thanks for reading!

Going Further


If this is the kind of SQL Server stuff you love learning about, you’ll love my training. I’m offering a 75% discount to my blog readers if you click from here. I’m also available for consulting if you just don’t have time for that and need to solve performance problems quickly.

Understand Your Plan: Operator Properties

Dragging The Line


There’s a lot of stuff flying around in a query plan. Data and what not.

Sure, you can hover over operators and arrows and see some stuff, but if you really wanna see stuff — I mean REALLY wanna see stuff — you gotta get into the properties.

You can access those in two ways:

  • Hit F4 (not F5 again; you already suffered through that)
  • Right click on any operator in the query plan and hit Properties

And that, my dear friend, will unlock many mysteries in your query plans.

Start With Select


I think one of the most interesting places to start is with the root operator (select, insert, update, delete), because there’s so much in there.

Here’s an abridged list of things you can see from the properties of the root node of an Actual Execution Plan:

  • Compile metrics: CPU, duration, memory
  • Degree Of Parallelism
  • Detailed Memory Grant information
  • Stats Usage
  • Query Time Stats in CPU and duration (including UDF times)
  • Parameter compile and runtime values
  • Nonparallel Plan reasons
  • Set Options
  • Warnings
  • CPU thread usage
  • Wait Stats

There’s more in there too, but holy cow! All the stuff you can learn here is fantastic. You might not be able to solve all your problems looking here, but it’s as good a place to start as any.

Plus, this is where you can get a sense of just how long your query ran for, and start tracking down the most troublesome operators.

Follow The Time


I’ve said before that operator costs are basically useless, and you should be following the operator times to figure out where things get wonky.

For some operators, just looking at the tool tip is enough. For example, if you have an operator that piles up a bunch of execution time because of a spill, the spill details are right in front of you.

SQL Server Query Plan
contagious

But other times, operator properties expose things that aren’t surfaced at the tool tip.

Skew Manchu


Take skewed parallelism, for example. There are no visual indicators that it happened (maybe there should be, but given the warnings we get now, I’m not sure I trust that summer intern).

SQL Server Query Plan
year of the spider

But you know, it might be nice to know about stuff like this. Each thread is supposed to get an equal portion of the query memory grant, and if work is distributed unevenly, you can end up with weird, random performance issues.

This is something I almost always spot check in parallel plans. In a perfect world, duration would be CPU➗DOP. Life rarely ends up perfect, which is why it’s worth a look.

I To The O


You can also see I/O stats at the operator level, logical and physical. This is why I kinda laugh at folks who still use SET STATISTICS TIME, IO ON; — you can get that all in one place — your query plan.

SQL Server Query Plan
ding!

You can interpret things in the same way, it’s just a little easier to chew.

Thanks for reading!

Going Further


If this is the kind of SQL Server stuff you love learning about, you’ll love my training. I’m offering a 75% discount to my blog readers if you click from here. I’m also available for consulting if you just don’t have time for that and need to solve performance problems quickly.

Understand Your Plan: Query Plan Warnings

Good And Bad


The good news is that SQL Server’s query plans will attempt to warn you about problems. The bad news is that most of the warnings only show up in Actual Execution Plans. The worse news is that a lot of the warnings that try to be helpful in Estimated Execution plans can be pretty misleading.

Here’s a current full list:

<xsd:element name="SpillOccurred" type="shp:SpillOccurredType" minOccurs="0" maxOccurs="1"/>
<xsd:element name="ColumnsWithNoStatistics" type="shp:ColumnReferenceListType" minOccurs="0" maxOccurs="1"/>
<xsd:element name="SpillToTempDb" type="shp:SpillToTempDbType" minOccurs="0" maxOccurs="unbounded"/>
<xsd:element name="Wait" type="shp:WaitWarningType" minOccurs="0" maxOccurs="unbounded"/>
<xsd:element name="PlanAffectingConvert" type="shp:AffectingConvertWarningType" minOccurs="0" maxOccurs="unbounded"/>
<xsd:element name="SortSpillDetails" type="shp:SortSpillDetailsType" minOccurs="0" maxOccurs="unbounded"/>
<xsd:element name="HashSpillDetails" type="shp:HashSpillDetailsType" minOccurs="0" maxOccurs="unbounded"/>
<xsd:element name="ExchangeSpillDetails" type="shp:ExchangeSpillDetailsType" minOccurs="0" maxOccurs="unbounded"/>
<xsd:element name="MemoryGrantWarning" type="shp:MemoryGrantWarningInfo" minOccurs="0" maxOccurs="1"/>

<xsd:attribute name="NoJoinPredicate" type="xsd:boolean" use="optional"/>
<xsd:attribute name="SpatialGuess" type="xsd:boolean" use="optional"/>
<xsd:attribute name="UnmatchedIndexes" type="xsd:boolean" use="optional"/>
<xsd:attribute name="FullUpdateForOnlineIndexBuild" type="xsd:boolean" use="optional"/>

Certain of these are considered runtime issues, and are only available in Actual Execution Plans, like:

  • Spills to tempdb
  • Memory Grants

I’ve never seen the “Spatial Guess” warning in the wild, which probably speaks to the fact that you can measure Spatial data/index adoption in numbers that are very close to zero. I’ve also never seen the Full Update For Online Index Build warning.

Then there are some others like Columns With No Statistics, Plan Affecting Converts, No Join Predicate, and Unmatched Indexes.

Let’s talk about those a little.

Columns With No Statistics


I almost never look at these, unless they’re from queries hitting indexed views.

The only time SQL Server will generate statistics on columns in an indexed view is when you use the NOEXPAND hint in your query. That might be very helpful to know about, especially if you don’t have useful secondary indexes on your indexed view.

If you see this in plans that aren’t hitting an indexed view, it’s likely that SQL Server is complaining that multi-column statistics are missing. If your query has a small number of predicates, it might be possible to figure out which combination and order will satisfy the optimizer, but it’s often not worth the time involved.

Like I said, I rarely look at these. Though one time it did clue me in to the fact that a database had auto create stats disabled.

So I guess it’s nice once every 15 years or so.

Plan Affecting Converts


There are two of these:

  • Ones that might affect cardinality estimates
  • Ones that might affect your ability to seek into an index

Cardinality Affecting

The problem I have with the cardinality estimation warning is that it shows up when it’s totally useless.

SELECT TOP (1)
    Id = CONVERT(varchar(1), u.Id)
FROM dbo.Users AS u;
SQL Server Query Plan
fine2me

Like I said, misleading.

Seek Affecting

These can be misleading, but I often pay a bit more attention to them. They can be a good indicator of data type issues in comparison operations.

Where they’re misleading is when they tell you they mighta-coulda done a seek, when you don’t have an index that would support a seek.

SELECT TOP (1)
    u.Id
FROM dbo.Users AS u
WHERE u.Reputation = CONVERT(sql_variant, N'138');
SQL Server Query Plan
knot4you

Of course, without an index on Reputation, what am I going to seek to?

Nothing. Nothing at all.

No Join Predicate


This one is almost a joke, I think.

Back when people wrote “old style joins”, they could have missed a predicate, or something. Like so:

SELECT
    c = COUNT_BIG(*)
FROM dbo.Users AS u, 
     dbo.Badges AS b, 
     dbo.Comments AS c
WHERE u.Id = b.UserId;
/*Oops no join on comments!*/

Except there’s no warning in this query plan for a missing join predicate.

SQL Server Query Plan
well okay

But if we change the query to this, it’ll show up:

SELECT
    u.Id
FROM dbo.Users AS u, 
     dbo.Badges AS b, 
     dbo.Comments AS c
WHERE u.Id = b.UserId;
/*Oops no join on comments!*/
SQL Server Query Plan
greatly

But let’s take a query that has a join predicate:

SELECT TOP (1)
    b.*
FROM dbo.Comments AS c
JOIN dbo.Badges AS b
    ON c.UserId = b.UserId
WHERE b.UserId = 22656;

We still get that warning:

SQL Server Query Plan
tough chickens

We still get a missing join predicate, even though we have a join predicate. The predicate is implied here, because of the where clause.

But apparently the check for this is only at the Nested Loops Join. No attempt is made to track pushed predicates any further.

SQL Server Query Plan
run for your life

If there were, the warning would not appear.

Unmatched Indexes


If you create filtered indexes, you should know a couple things:

  • It’s always a good idea to have the column(s) you’re filter(ing) on somewhere in the index definition (key or include, whatever)
  • If query predicate(s) are parameterized on the column(s) you’re filter(ing) on, the optimizer probably won’t choose your filtered index

I say probably because recompile hints and unsafe dynamic SQL may prompt it to use your filtered index. But the bottom line here is parameters and filtered indexes are not friends in some circumstances.

Here’s a filtered index:

CREATE INDEX
    cigarettes
ON dbo.Users
    (Reputation)
WHERE
    (Reputation >= 1000000)
WITH
    (SORT_IN_TEMPDB = ON, DATA_COMPRESSION = PAGE);

And here’s a query that should use it:

SELECT 
    u.Reputation
FROM dbo.Users AS u
WHERE u.Reputation >= 1000000;

BUUUUUUUUUUUUUUUT!

SQL Server Query Plan
combine

SQL Server warns us we didn’t. This is an artifact of Simple Parameterization, which happens early on in the Trivial Plan optimization phase.

It’s very misleading, that.

Warnings And Other Drugs


In this post we covered common scenarios when plan warnings just don’t add up to much of a such. Does that mean you should always ignore them? No, but also don’t be surprised if your investigation turns up zilch.

If you’re interested in learning more about spills, check out the Spills category of my blog. I’ve got a ton of posts about them.

At this point, you’re probably wondering why people bother with execution plans. I’m sort of with you; everything up to the actual version feels futile and useless, and seems to lie to you.

Hopefully Microsoft invests more in making the types of feedback mechanisms behind gathering plans and runtime metrics easier for casual users in future versions of SQL Server.

Thanks for reading!

Going Further


If this is the kind of SQL Server stuff you love learning about, you’ll love my training. I’m offering a 75% discount to my blog readers if you click from here. I’m also available for consulting if you just don’t have time for that and need to solve performance problems quickly.

Understand Your Plan: Missing Index Requests

Just A Friend


Missing index requests aren’t perfect, and that’s okay. But you need to know where they’re not okay so you can start creating better ones.

Let’s start with some basics:

  • They really only care about the where clause
  • Joins always seem to end up in the INCLUDE list
  • Column suggestions are not in any particular order
    • Outside of being grouped into equality and inequality predicates
  • The impact is based on operator costs, which is often complete crap

There’s more, but this is a good start. Good starts are good. Nice things are nice.

And of course, the day this blog published, Microsoft published a huge update to missing index docs, by way of the fabulous Kendra Little.

Let’s move on.

Users


The Users table looks like this. It’s important for me to show you this up front, because column ordinal position in the table is important for understanding missing index requests.

SQL Server Query Plan
what-whatcha need?

Keep this in mind — the columns aren’t in alphabetical order, or how selective they are, or by data type, etc.

They’re in the order that they are when the table was created, and then if any of them were added later on.

That’s all.

Long Time


Let’s take this query:

SELECT TOP (10000)
    u.Id,
    u.AccountId,
    u.DisplayName,
    u.Reputation,
    u.Views,
    u.CreationDate
FROM dbo.Users AS u
WHERE u.Views = 0
ORDER BY u.CreationDate DESC;

Is it very useful? No. But it’ll help us paint the right picture. The query plan doesn’t matter, because it’s just a clustered index scan, and it’ll be a clustered index scan for every other permutation, too.

The missing index for this query is like so:

CREATE NONCLUSTERED INDEX [<Name of Missing Index, sysname,>]
ON [dbo].[Users] ([Views])
INCLUDE ([CreationDate],[DisplayName],[Reputation],[AccountId])

Only the Views column is in the key of the index, even though CreationDate is an order by column.

In this case, it would be beneficial to have it as the second key column, because it would be sorted for free for us after an equality predicate.

You may also notice that Id is not part of the definition too. That’s because it’s the clustered index, so it will be inherited by any nonclustered indexes we create.

Normal


Okay, now let’s look at this query, with a slightly different where clause:

SELECT TOP (10000)
    u.Id,
    u.AccountId,
    u.DisplayName,
    u.Reputation,
    u.Views,
    u.CreationDate
FROM dbo.Users AS u
WHERE u.Views = 0
AND   u.Reputation = 1
ORDER BY u.CreationDate DESC;

We’re adding another predicate on Reputation = 1 here. The missing index request now looks like this:

CREATE NONCLUSTERED INDEX [<Name of Missing Index, sysname,>]
ON [dbo].[Users] ([Reputation],[Views])
INCLUDE ([CreationDate],[DisplayName],[AccountId])

Neither one of these predicates is particularly selective (7,954,119 and 6,197,417, respectively) but Reputation ends up first in the key column list because its ordinal position in the table is first.

Frequency


How about if we add a really selective predicate to our query?

SELECT TOP (10000)
    u.Id,
    u.AccountId,
    u.DisplayName,
    u.Reputation,
    u.Views,
    u.CreationDate
FROM dbo.Users AS u
WHERE u.AccountId = 12462842
AND   u.Views = 0
ORDER BY u.CreationDate DESC;

Now our missing index request looks like this:

CREATE NONCLUSTERED INDEX [<Name of Missing Index, sysname,>]
ON [dbo].[Users] ([Views],[AccountId])

Two things happened:

  • We don’t have any included columns anymore
  • AccountId is second in the key columns

This is amusing because the missing index request machine seems to understand that this will only ever one row via the equality predicate on AccountId but it still gets enumerated as the second index key column.

In other words, it doesn’t put the most selective column first. It gives you an index designed, like other examples, based on the column’s ordinal position in the table.

Nothing else, at least not so far.

Inequality


Where missing index requests will change column order is when it comes to inequality predicates. That doesn’t just mean not equal to, oh no no no.

That covers any “range” predicate: <, <=, >, >=, <> or !=, and IS NOT NULL.

Take this query for example:

SELECT TOP (10000)
    u.Id,
    u.AccountId,
    u.DisplayName,
    u.Reputation,
    u.Views,
    u.CreationDate
FROM dbo.Users AS u
WHERE u.AccountId = 0
AND   u.Reputation < 0
AND   u.Views < 0
ORDER BY u.CreationDate DESC;

The missing index request looks like this:

CREATE NONCLUSTERED INDEX [<Name of Missing Index, sysname,>]
ON [dbo].[Users] ([AccountId],[Reputation],[Views])

Now AccountId is the leading key column, but Reputation and Views are still in ordinal position order as inequality predicates.

Wink Wink


Now, look, I started off by saying that missing index requests aren’t perfect, and that’s okay. They’re not meant to replace a well-trained person. They’re meant to help the hapless when it comes to fixing slow queries.

As you get more comfortable with indexes and how to create them to make queries go faster, you’ll start to see deficiencies in missing index requests.

But you don’t want the optimizer spending a long time in the index matching/missing index request phases. That’s a bad use of its time.

As you progress, you’ll start treating missing index requests like a crying baby: something might need attention, but it’s up to you as an adult DBA or developer to figure out what that is.

Thanks for reading!

Going Further


If this is the kind of SQL Server stuff you love learning about, you’ll love my training. I’m offering a 75% discount to my blog readers if you click from here. I’m also available for consulting if you just don’t have time for that and need to solve performance problems quickly.