Spills Week: How Hash Aggregate Spills Hurt SQL Server Query Performance

Quite Different


Hash spills are nothing like sort spills, in that even with (very fast) disks, there’s no immediate benefit to breaking the hash down into pieces via a spill.

In fact, there are many downsides, especially when memory is severely constrained.

The query that I’m using looks about like this:

SELECT   v.PostId, 
		 COUNT_BIG(*) AS records
FROM dbo.Votes AS v
GROUP BY v.PostId
HAVING COUNT_BIG(*) >  2147483647

The way this is written, we’re forced to count everything, and then only filter out rows at the end.

The idea is to spend no time waiting on rows to be displayed in SSMS.

Just One Int


To get an idea what performance looks like, I’m starting with one integer column.

With no spills and a 776 MB memory grant, this runs for about 15 seconds.

SQL Server Query Plan
Hello

If we drop the grant down to about 10 MB, we spill a bunch, but runtime doesn’t go up too much.

SQL Server Query Plan
Hurts A Little

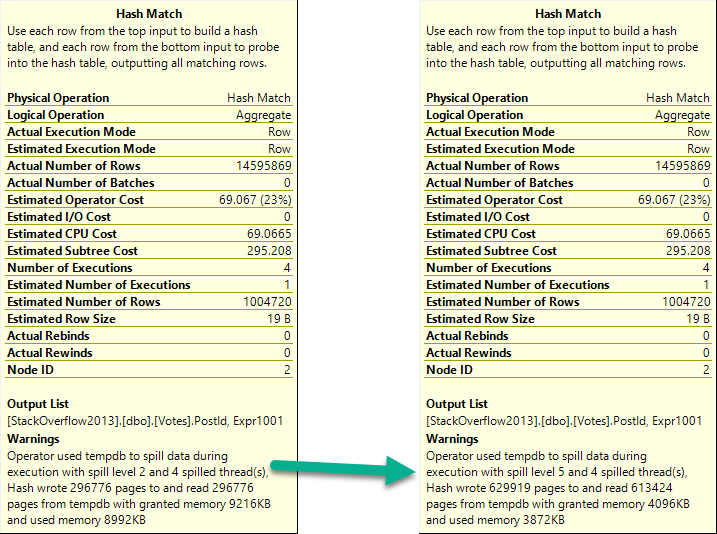
And if we drop it down to 4.5 MB, things go absolutely, terribly, pear shaped.

SQL Server Query Plan
Hurts A Lot

The difference in both the number of pages spilled and the spill level are pretty dramatic.
SQL Server Query Plan
TWO THOUSAND!

Expansive


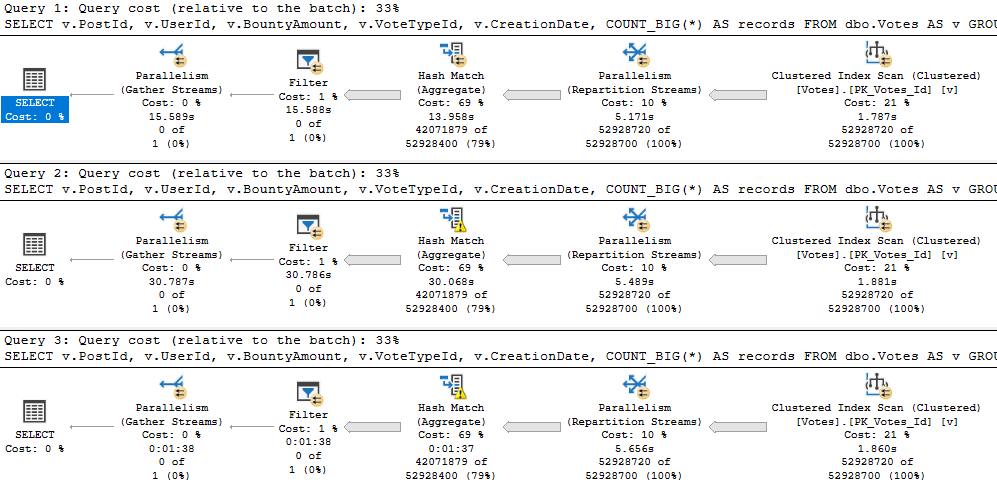
If we expand the query a bit to look like this, memory starts to matter more:

SELECT   v.PostId, 
         v.UserId, 
		 v.BountyAmount, 
		 v.VoteTypeId, 
		 v.CreationDate, 
		 COUNT_BIG(*) AS records
FROM dbo.Votes AS v
GROUP BY v.PostId, 
         v.UserId, 
		 v.BountyAmount, 
		 v.VoteTypeId, 
		 v.CreationDate
HAVING COUNT_BIG(*) >  2147483647
SQL Server Query Plan
Extra Extra

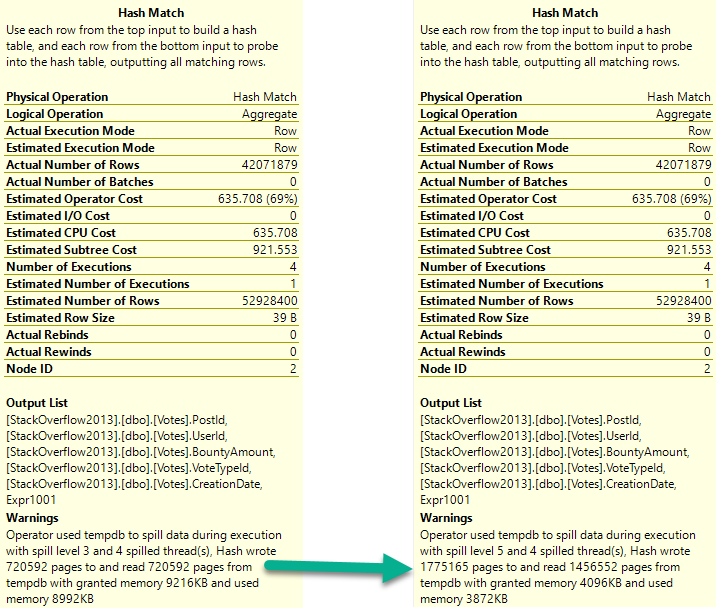
With more columns, the first spill escalates to a higher level faster, and the second spill absolutely wipes out.

It runs for almost 2 minutes.
SQL Server Query Plan
EATS IT

As a side note, I really hate how long that Repartition Streams operator runs for.

Predictably


When we get the Comments table involved, that string column beats us right up.

SQL Server Query Plan
Love On An Escalator

The first query asks for the largest possible grant on my laptop: 9.7GB. The second query gets 10MB.

The spill is godawful.

When we reduce the memory grant to 4.5MB, the spill runs another 1:20, for a total of 3:31.

SQL Server Query Plan
Crud

Those spills are the root cause of why these queries run longer than any we’ve seen to date in this series.

Something quite funny happens when Hashes of any variety spill “too much” — which you can read about in more detail here.

There’s an Extended Event called “hash warning” that we can use to track recursion and bailout.

Here’s the final output aggregated:
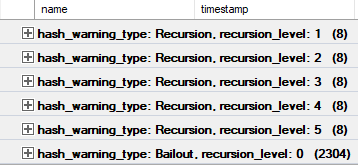
SQL Server Extended Events
[outdated political joke]
What happens when a Hash Aggregate bails out?

GOOD QUESTION.

In Which I Belabor The Point Anyway, Despite Saying…


Not to belabor the point too much, but if we select and group all the columns in the Comments table, things get a bit worse.
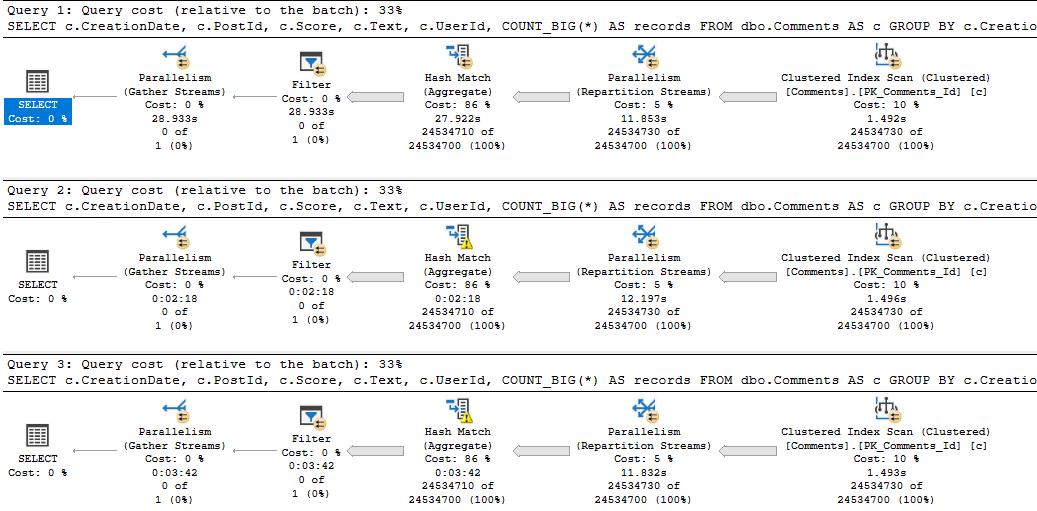
SQL Server Query Plan
Not fond

Three minutes of spills. What a time to be alive.

But, yeah, the bulk of the trouble here is caused by the string column.

Adding in some numbers and a date on top doesn’t have a profound effect.

Taking Up


While Sort Spills certainly dragged query performance down a bit when memory was severely limited, Hash Spills were far more detrimental.

If I had to choose between which one to investigate first, it’d be Hash spills.

But again, small spills are often not worth the effort, and in some cases, you may always see spills.

If your server is totally under-provisioned from a memory perspective, or if there are multiple concurrent memory consuming operations (i.e. they can’t share intra-query memory), it may not be possible for a large enough grant to be give to satisfy all of them.

This is part of why writing very large queries can be perilous, and it’s usually worth splitting them up.

In tomorrow’s post, we’ll look at hash joins.

Thanks for reading!

Going Further


If this is the kind of SQL Server stuff you love learning about, you’ll love my training. I’m offering a 75% discount to my blog readers if you click from here. I’m also available for consulting if you just don’t have time for that and need to solve performance problems quickly.
Spills Week: When Sort Spills Start To Hurt SQL Server Performance

Imbalance


In yesterday’s post, we looked at a funny situation where a query that spilled was about 5 seconds faster than one that didn’t.

Here’s what the query looked like:

SELECT x.PostId
FROM (
SELECT v.PostId, 
       ROW_NUMBER() OVER ( ORDER BY v.PostId DESC ) AS n
FROM dbo.Votes AS v
) AS x
WHERE x.n = 1;

Now, I can add more columns in, and the timing will hold up:

SELECT x.Id, 
       x.PostId, 
	   x.UserId, 
	   x.BountyAmount, 
	   x.VoteTypeId, 
	   x.CreationDate
FROM (
SELECT v.Id, 
       v.PostId, 
	   v.UserId, 
	   v.BountyAmount, 
	   v.VoteTypeId, 
	   v.CreationDate,
       ROW_NUMBER() OVER ( ORDER BY v.PostId DESC ) AS n
FROM dbo.Votes AS v
) AS x
WHERE x.n = 1;
SQL Server Query Plan
Gas Pedal

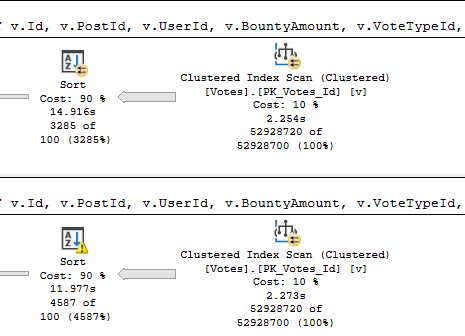
They both got slower, the non-spill plan by about 2.5s, and the spill plan by about 4.3s.

But the spill plan is still 3s faster. With fewer columns it was 5s faster, but hey.

No one said this was easy.

Fully comparing things from yesterday, when memory is capped at 0.0, the query takes much longer now, with more columns:

SQL Server Query Plan
Killing Time

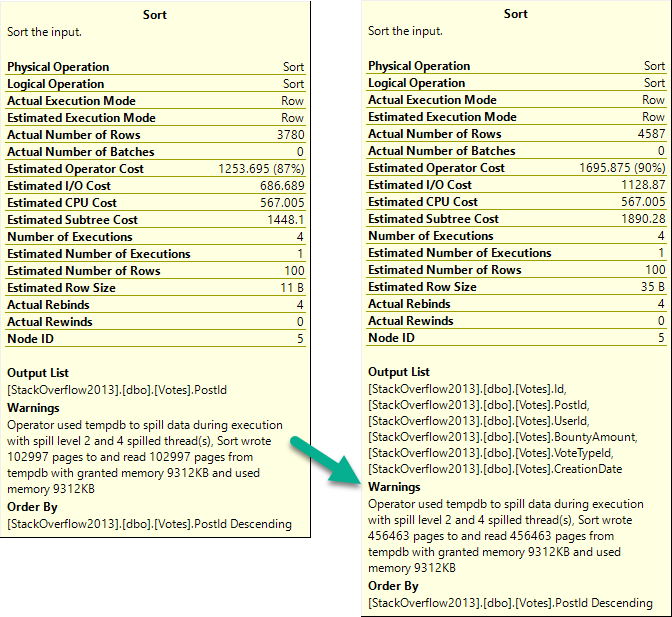
To compare the “fast” spills, here’s yesterday and today’s warnings.

SQL Server Query Plan
More Pages, More Problems

With one integer column, we spilled 100k pages.

With five integer columns and one datetime column, we spill 450k pages.

That’s a non-trivial amount. That’s like every column adding 75k pages to the spill.

If you’re really worried about spills: STOP SELECTING SO MANY COLUMNS.

For The Worst


I promised to show you things going quite downhill, and for the spill query to no longer be faster.

To do that, we need a different table.

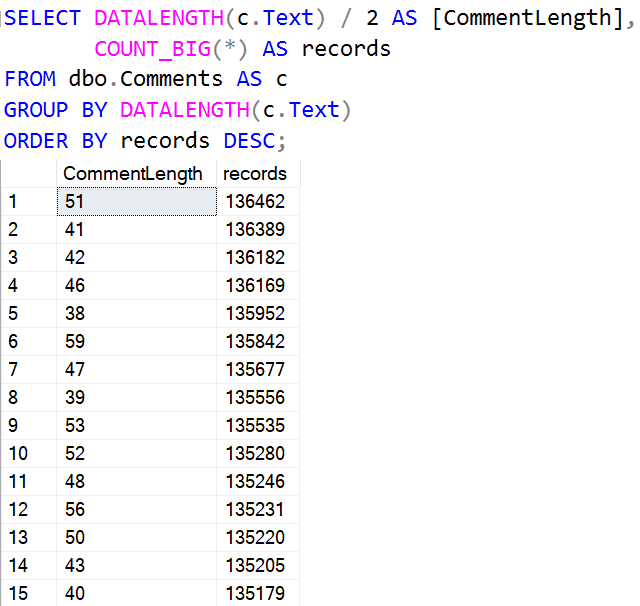
I’m going to use the Comments table, because it has a column called Text in it, which is an NVARCHAR(700).

Very few comments are 700 characters long. The majority are < 120 or so.

SQL Server Query Results
5-7-9

This query looks about like so:

SELECT x.Id, 
       x.CreationDate, 
	   x.PostId, 
	   x.Score, 
	   x.Text, 
	   x.UserId
FROM (
SELECT c.Id, 
       c.CreationDate, 
	   c.PostId, 
	   c.Score, 
	   c.Text, 
	   c.UserId,
       ROW_NUMBER() 
           OVER ( ORDER BY c.PostId DESC ) AS n
FROM dbo.Comments AS c
) AS x
WHERE x.n = 1

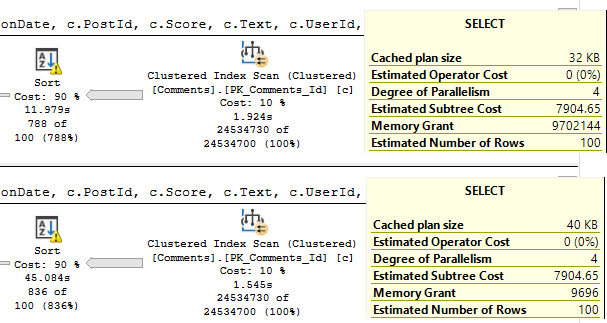
And the results are… icky.

SQL Server Query Plan
Gigs To Spare?

The top query asks for 9.7GB of RAM. That’s as much as my laptop can give out.

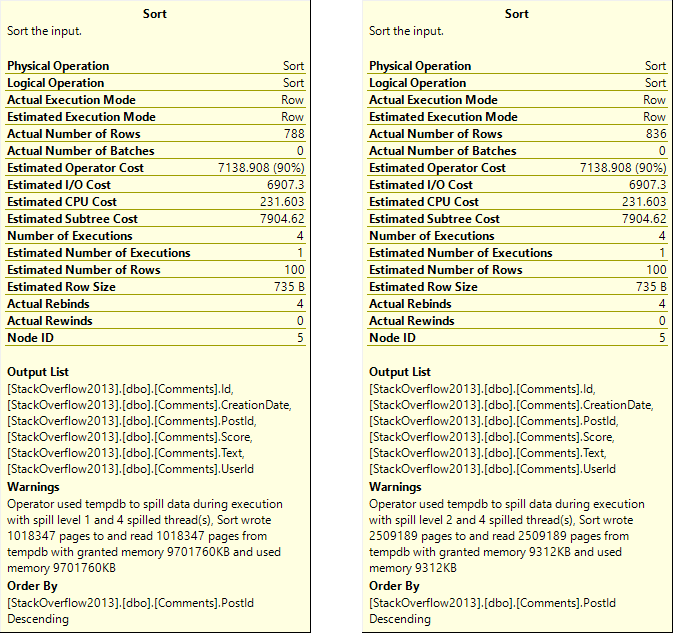
It still spills. Nearly 10GB of memory grant, and it still spills.

If you care about spills: STOP OVERSIZING STRING COLUMNS:

SQL Server Query Plan
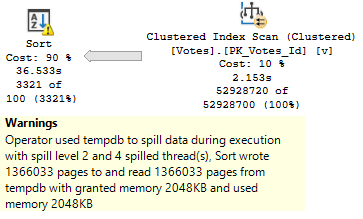
Billy Budd

Apparently only spilling 1mm pages is a lot faster than spilling 2.5mm pages.

But still much slower than not spilling string columns.

Who knew?

Matters of Whale


I was using the Stack Overflow 2013 database for that, which is fairly big relative to the 64GB of RAM my laptop has.

If I go back to using the 2010 version, we can get a better comparison, because the first query won’t spill anymore.

SQL Server Query Plan
It’s like what all those query tuners keep telling you.

Some points to keep in mind here:

  • I’m testing with (very fast) local storage
  • I don’t have tempdb contention

But still, it seems like spilling out non-string columns is significantly less painful than spilling out string columns.

Ahem.

“Seems.”

I’ll reiterate two points:

  • Stop selecting so many columns
  • Stop oversizing string columns

In the next two posts, we’ll look at hash match and hash join spills under similar circumstances.

Thanks for reading!

Going Further


If this is the kind of SQL Server stuff you love learning about, you’ll love my training. I’m offering a 75% discount to my blog readers if you click from here. I’m also available for consulting if you just don’t have time for that and need to solve performance problems quickly.
Spills Week: When Sort Spills Don’t Really Hurt SQL Server Performance

Pre-faced


Every post this week is going to be about spills. No crazy in-depth, technical, debugger type stuff.

Just some general observations about when they seem to matter more for performance, and when you might be chasing nothing by fixing them.

The queries I use are sometimes a bit silly looking, but the outcomes are ones I see.

Sometimes I correct them and it’s a good thing. Other times I correct them and nothing changes.

Anyway, all these posts started because of the first demo, which I intended to be a quick post.

Oh well.

Intervention


Spills are a good thing to make note of when you’re tuning a query.

They often show up as a symptom of a bigger problem:

  • Parameter sniffing
  • Bad cardinality estimates

My goal is generally to fix the larger symptom than to hem and haw over the spill.

It’s also important to keep spills in perspective.

  • Some are small and inconsequential
  • Some are going to happen no matter what

And some spills… Some spills…

Can’t Hammer This


Pay close attention to these two query plans.

SQL Server Query Plan
Completely unfounded

Not sure where to look? Here’s a close up.

SQL Server Query Plan
Grounded

See that, there?

Yeah.

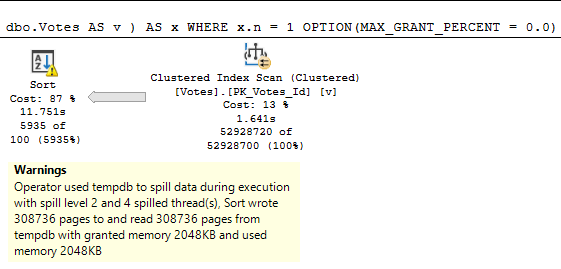
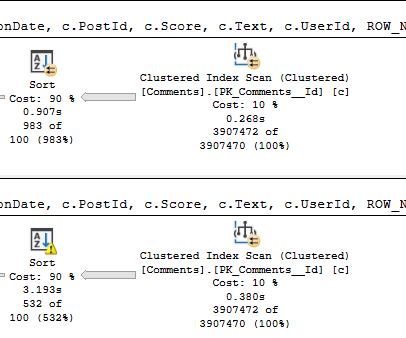
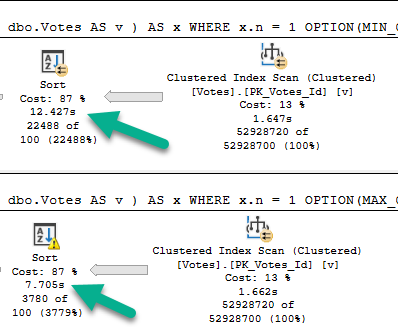
That’s a Sort with a Spill running about 5 seconds faster than a Sort without a Spill.

Wild stuff, huh? Here’s what it looks like.

SQL Server Query Plan
Still got it.

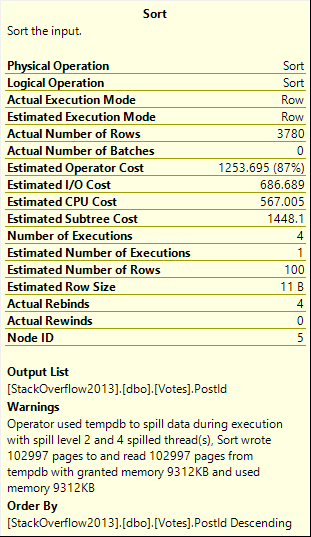
Not inconsequential. >100k 8kb pages.

Spill level 2, too. Four threads.

A note from future Erik: if I run this with the grant capped at 0.0 rather than 0.1, the spill plan takes 12 seconds, just like the non-spill plan.

There are limits to how efficiently a spill can be handled when memory is capped at a level that increases the number of pages spilled without increasing the spill level.

SQL Server Query Plan
Z to the Ero

But it’s still funny that the spill and non-spill plans take about the same time.

Why Is This Faster?


Well, the first thing we have to talk about is storage, because that’s where I spilled to.

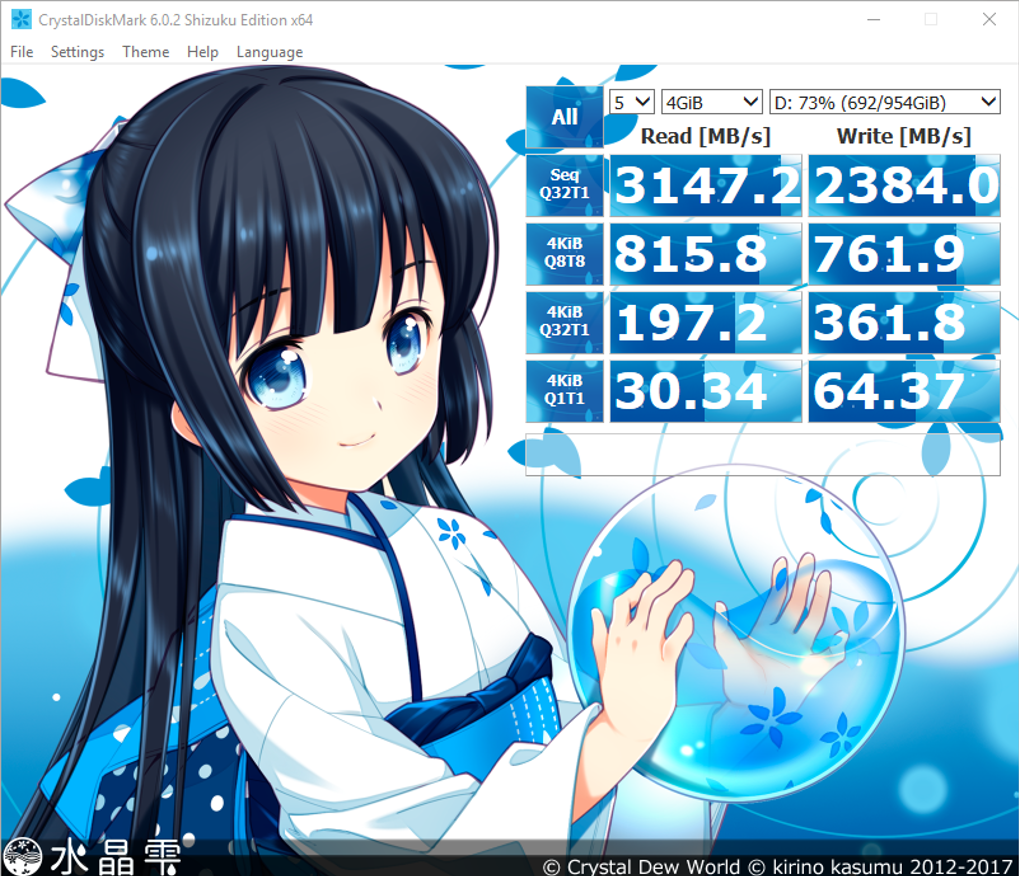
My Lenovo P52 has some seriously fast SSDs in it. Here’s what they give me, via Crystal Disk Mark:

Crystal Disk Mark
Girlfriend In A Cartoon

If you’re on good local storage, you might see those speeds.

If you’re on a SAN, I don’t care how much anyone squawks about how fast it is: you’re not gonna see that.

(But seriously, if you do get those speeds on a SAN, tell me about your setup.)

(If you think you should but you don’t, uh… Operators are standing by.)

With that out of the way, let’s hit some reference material.

Kiwis & Machanics


First, Paul White:

Multiple merge passes can be used to work around this. The general idea is to progressively merge small chunks into larger ones, until we can efficiently produce the final sorted output stream. In the example, this might mean merging 40 of the 800 first-pass sorted sets at a time, resulting in 20 larger chunks, which can then be merged again to form the output. With a total of two extra passes over the data, this would be a Level 2 spill, and so on. Luckily, a linear increase in spill level enables an exponential increase in sort size, so deep sort spill levels are rarely necessary.

Next, Paul White showing an Adam Machanic demo:

Well, okay, I’ll paraphrase here. It’s faster to sort a bunch of small things than one big thing.

If you watch the demo, that’s what happens with using the cross apply technique.

And that’s what’s happening here, too, it looks like.

On With It


The spills to (very fast) disk work in my favor here, because we’re sorting smaller data sets, then reading from (very fast) disk more small data sets, and sorting/merging those together for a final finished product.

Of course, this has limits, and is likely unrealistic in many tuning scenarios. I probably should have lead with that, huh?

But hey, if you ever fix a Sort Spill have have a query slow down, now you know why.

In tomorrow’s post, you’ll watch my luck run out (very fast) with different data.

Thanks for reading!

Going Further


If this is the kind of SQL Server stuff you love learning about, you’ll love my training. I’m offering a 75% discount to my blog readers if you click from here. I’m also available for consulting if you just don’t have time for that and need to solve performance problems quickly.
The Fastest Way To Get The Highest Value In SQL Server Part 2

Whistle Whistle


In yesterday’s post, we looked at four different ways to get the highest value per use with no helpful indexes.

Today, we’re going to look at how those same four plans change with an index.

This is what we’ll use:

CREATE INDEX ix_whatever
    ON dbo.Posts(OwnerUserId, Score DESC);

Query #1

This is our MAX query! It does really well with the index.

SELECT u.Id,
       u.DisplayName,
	   u.Reputation,
	   ca.Score
FROM dbo.Users AS u
CROSS APPLY
(
    SELECT MAX(Score) AS Score
	FROM dbo.Posts AS p
	WHERE p.OwnerUserId = u.Id

) AS ca
WHERE u.Reputation >= 100000
ORDER BY u.Id;

It’s down to just half a second.

SQL Server Query Plan
Phoney

Query #2

This is our TOP 1 query with an ORDER BY.

SELECT u.Id,
       u.DisplayName,
	   u.Reputation,
	   ca.Score
FROM dbo.Users AS u
CROSS APPLY
(
    SELECT TOP (1) p.Score
	FROM dbo.Posts AS p
	WHERE p.OwnerUserId = u.Id
	ORDER BY p.Score DESC

) AS ca
WHERE u.Reputation >= 100000
ORDER BY u.Id;
SQL Server Query Plan
Aliveness

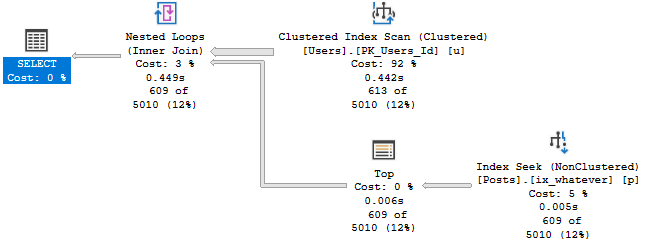
This finished about 100ms faster than MAX in this run, but it gets the same plan.

Who knows, maybe Windows Update ran during the first query.

Query #3

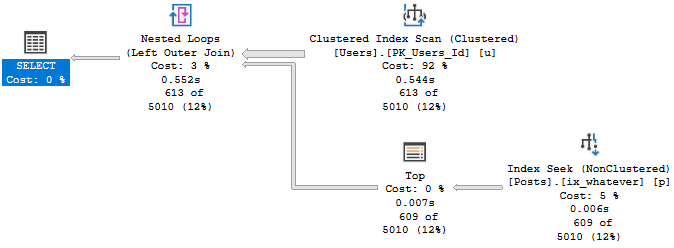
This is our first attempt at row number, and… it’s not so hot.

SELECT u.Id,
       u.DisplayName,
	   u.Reputation,
	   ca.Score
FROM dbo.Users AS u
CROSS APPLY
(
    SELECT p.Score,
	       ROW_NUMBER() OVER (ORDER BY p.Score DESC) AS n
	FROM dbo.Posts AS p
	WHERE p.OwnerUserId = u.Id
) AS ca
WHERE u.Reputation >= 100000
AND ca.n = 1
ORDER BY u.Id;

While the other plans were able to finish quickly without going parallel, this one does go parallel, and is still about 200ms slower.

SQL Server Query Plan
Bad Bed

Query #4

Is our complicated cross apply. The plan is simple, but drags on for almost 13 seconds now.

SELECT u.Id,
       u.DisplayName,
	   u.Reputation,
	   ca.Score
FROM dbo.Users AS u
CROSS APPLY
(
    SELECT * 
	FROM 
	(
        SELECT p.OwnerUserId,
	           p.Score,
	           ROW_NUMBER() OVER (PARTITION BY p.OwnerUserId 
			                      ORDER BY p.Score DESC) AS n
	    FROM dbo.Posts AS p
	) AS p
	WHERE p.OwnerUserId = u.Id
	AND p.n = 1
) AS ca
WHERE u.Reputation >= 100000
ORDER BY u.Id;
SQL Server Query Plan
Wrong One

Slip On


In this round, row number had a tougher time than other ways to express the logic.

It just goes to show you, not every query is created equal in the eyes of the optimizer.

Now, initially I was going to do a post with the index columns reversed to (Score DESC, OwnerUserId), but it was all bad.

Instead, I’m going to do future me a favor and look at how things change in SQL Server 2019.

Thanks for reading!

Going Further


If this is the kind of SQL Server stuff you love learning about, you’ll love my training. I’m offering a 75% discount to my blog readers if you click from here. I’m also available for consulting if you just don’t have time for that and need to solve performance problems quickly.
The Fastest Way To Get The Highest Value In SQL Server Part 1

Expresso


Let’s say you wanna get the highest thing. That’s easy enough as a concept.

Now let’s say you need to get the highest thing per user. That’s also easy enough to visualize.

There are a bunch of different ways to choose from to write it.

In this post, we’re going to use four ways I could think of pretty quickly, and look at how they run.

The catch for this post is that we don’t have any very helpful indexes. In other posts, we’ll look at different index strategies.

Query #1

To make things equal, I’m using CROSS APPLY in all of them.

The optimizer is free to choose how to interpret this, so WHATEVER.

SELECT u.Id,
       u.DisplayName,
	   u.Reputation,
	   ca.Score
FROM dbo.Users AS u
CROSS APPLY
(
    SELECT MAX(Score) AS Score
	FROM dbo.Posts AS p
	WHERE p.OwnerUserId = u.Id

) AS ca
WHERE u.Reputation >= 100000
ORDER BY u.Id;

The query plan is simple enough, and it runs for ~17 seconds.

SQL Server Query Plan
Big hitter

Query #2

This uses TOP 1.

SELECT u.Id,
       u.DisplayName,
	   u.Reputation,
	   ca.Score
FROM dbo.Users AS u
CROSS APPLY
(
    SELECT TOP (1) p.Score
	FROM dbo.Posts AS p
	WHERE p.OwnerUserId = u.Id
	ORDER BY p.Score DESC

) AS ca
WHERE u.Reputation >= 100000
ORDER BY u.Id;

The plan for this is also simple, but runs for 1:42, and has one of those index spool things in it.

SQL Server Query Plan
Unlucky

Query #3

This query uses row number rather than top 1, but has almost the same plan and time as above.

SELECT u.Id,
       u.DisplayName,
	   u.Reputation,
	   ca.Score
FROM dbo.Users AS u
CROSS APPLY
(
    SELECT p.Score,
	       ROW_NUMBER() OVER (ORDER BY p.Score DESC) AS n
	FROM dbo.Posts AS p
	WHERE p.OwnerUserId = u.Id
) AS ca
WHERE u.Reputation >= 100000
AND ca.n = 1
ORDER BY u.Id;
SQL Server Query Plan
Why send me silly notes?

Query #4

Also uses row number, but the syntax is a bit more complicated.

The row number happens in a derived table inside the cross apply, with the correlation and filtering done outside.

SELECT u.Id,
       u.DisplayName,
	   u.Reputation,
	   ca.Score
FROM dbo.Users AS u
CROSS APPLY
(
    SELECT * 
	FROM 
	(
        SELECT p.OwnerUserId,
	           p.Score,
	           ROW_NUMBER() OVER (PARTITION BY p.OwnerUserId 
			                      ORDER BY p.Score DESC) AS n
	    FROM dbo.Posts AS p
	) AS p
	WHERE p.OwnerUserId = u.Id
	AND p.n = 1
) AS ca
WHERE u.Reputation >= 100000
ORDER BY u.Id;

This is as close to competitive with Query #1 as we get, at only 36 seconds.

SQL Server Query Plan
That’s a lot of writing.

Wrap Up


If you don’t have helpful indexes, the MAX pattern looks to be the best.

Granted, there may be differences depending on how selective data in the table you’re aggregating is.

But the bottom line is that in that plan, SQL Server doesn’t have to Sort any data, and is able to take advantage of a couple aggregations (partial and full).

It also doesn’t spend any time building an index to help that one.

In the next couple posts, we’ll look at different ways to index for queries like this.

Thanks for reading!

Going Further


If this is the kind of SQL Server stuff you love learning about, you’ll love my training. I’m offering a 75% discount to my blog readers if you click from here. I’m also available for consulting if you just don’t have time for that and need to solve performance problems quickly.
How SQL Server’s Missing Index Requests Can Hurt Performance

DON’T THROW EGGS


Thanks for watching!

Going Further


If this is the kind of SQL Server stuff you love learning about, you’ll love my training. I’m offering a 75% discount to my blog readers if you click from here. I’m also available for consulting if you just don’t have time for that and need to solve performance problems quickly.
SQL Server 2019: If You Want Adaptive Joins, You Need Wider Indexes

What You Make Of It


We’ve got this query. Handsome devil of a query.

You can pretend it’s in a stored procedure, and that the date filter is a parameter if you want.

SELECT u.DisplayName, p.Score
FROM dbo.Users AS u
JOIN dbo.Posts AS p
ON p.OwnerUserId = u.Id
WHERE u.CreationDate >= '20131201';

A long time ago, when we migrated Stack Overflow from Access to SQL Server 2000, we created indexes.

This one has worked alright.

CREATE INDEX ix_whatever 
    ON dbo.Posts(OwnerUserId);

But Now We’re On 2019


And we’ve, like, read a lot about Adaptive Joins, and we think this’ll be cool to see in action.

Unfortunately, our query doesn’t seem to qualify.

SQL Server Query Plan
Shame shame shame

Now, there’s an Extended Event that… Used to work.

These days it just stares blankly at me. But since I’ve worked with this before, I know the problem.

It’s that Key Lookup — I’ll explain more in a minute.

Index Upgrade


First, let’s get rid of the Lookup so we can see the Adaptive Join happen.

CREATE INDEX ix_adaptathy 
    ON dbo.Posts(OwnerUserId, Score);
SQL Server Query Plan
New new new

As We Proceed


Let’s think about what Adaptive Joins need:

  • An index on the column(s) you’re joining

This gives us a realistic choice between using a Nested Loops join to do efficient Seeks, or an easy scan for a Hash Join.

  • That index has to cover the query

Without a covering index, there’s too much for the optimizer to think about.

It’s not just making a choice between a Nested Loops or Hash Join, it’s also factoring in the cost of a Lookup.

This used to trigger the XE on eajsrUnMatchedOuter, meaning the outer table didn’t have an index that matched the query.

Why Revisit This?


When SQL Server 2019 comes out, people are gonna have really high hopes for their workloads automagickally getting faster.

While there are lots of things that it’ll likely help, it’s going to take a lot of work on your part to make sure your queries and indexes allow for the automagick to kick in.

Thanks for reading!

Going Further


If this is the kind of SQL Server stuff you love learning about, you’ll love my training. I’m offering a 75% discount to my blog readers if you click from here. I’m also available for consulting if you just don’t have time for that and need to solve performance problems quickly.

The Difference Between Statistics Time And Plan Operator Times In SQL Server Query Plans

Goal Posts


When you’re measuring query changes to see if your performance changes have made a difference, a common way to do that is to use STATISTICS TIME and IO.

They’re not perfect, but the barrier to entry is super low, and you can get a good enough feel for if you’re on the right track.

In a perfect world, people would only select the rows and columns they need.

Also in a perfect world: that really embarrassing thing you did in 3rd grade wouldn’t pop into your head every time you’re about to do something really important.

Durex


What can make judging differences tough is if you’re returning a lot of rows to SSMS.

Sometimes it feels like you can reduce reads and CPU time, but your overall query time hasn’t changed.

Now with query operator times, that becomes easier to see.

And Earl


Let’s take this query, which returns ~271k rows.

SET STATISTICS TIME, IO ON;

SELECT c.Score, c.UserId, c.Text 
FROM dbo.Comments AS c
WHERE c.Score BETWEEN 5 AND 30
ORDER BY c.Score DESC

In the Stack Overflow 2013 database, this runs for about 3 wall clock seconds.

It says so in the bottom corner of SSMS.

Since we turned on stats time, we can look in the messages window to see that information.

Here are the relevant details:

 SQL Server Execution Times:
   CPU time = 3516 ms,  elapsed time = 3273 ms.

What looks odd here is that CPU and elapsed time are near-equal, but the plan shows parallelism.

SQL Server Query Plan
Tired of roaches

Thankfully, with operator times, the actual plan helps us out.

SQL Server Query Plan
Tired of rats

The query itself ran for <900ms.

The situation isn’t so dire.

More Ales


In stats time, elapsed time measures until results are done getting to SSMS.

It might look like this query “ran” for ~3 seconds, but it didn’t. The query finished processing data in under a second, but it took another couple seconds for SSMS to render the results.

You can do a mock test by doing something like this:

DECLARE @blob_eater VARCHAR(8000);

SELECT @blob_eater = c.Score, 
       @blob_eater = c.UserId, 
	   @blob_eater = c.Text 
FROM dbo.Comments AS c
WHERE c.Score BETWEEN 5 AND 30
ORDER BY c.Score DESC

Now when we run the query, stats time is much closer to the operator finish time:

 SQL Server Execution Times:
   CPU time = 2954 ms,  elapsed time = 897 ms.

Thanks for reading!

Going Further


If this is the kind of SQL Server stuff you love learning about, you’ll love my training. I’m offering a 75% discount to my blog readers if you click from here. I’m also available for consulting if you just don’t have time for that and need to solve performance problems quickly.
Why Not Just Go For The Big Plan To Improve SQL Server Query Performance?

M’ocean


Going Further


If this is the kind of SQL Server stuff you love learning about, you’ll love my training. I’m offering a 75% discount to my blog readers if you click from here. I’m also available for consulting if you just don’t have time for that and need to solve performance problems quickly.
Running Query Confusion In SQL Server

Somewhat Solved


This bit of confusion is largely solved in SQL Server 2019 under compatibility level 150, when FROID (scalar udf inlining) kicks in.

But, you know, we’re a ways off from 2019 dropping, being adopted, and compat level 150 being the operating norm.

So here goes!

Functional Querying


I’ve got a scalar valued function. What it does is unimportant, but I’m calling it in a query like this:

SELECT u.DisplayName, 
       dbo.TotalScore(u.Id) AS TotalScore --<functione
FROM dbo.Users AS u
WHERE u.Reputation >= 200000
ORDER BY u.Id;

When I run this in SSMS, it’s obvious to us what’s going on.

But if I’m watching what’s happening on a server using sp_WhoIsActive, what’s going on might not be obvious.

I’m doing all this with just my query running to show how confusing things can get.

First Confusion: Query Text

SQL Server sp_WhoIsActive
Foggy

This doesn’t look at all like the text of our query. We can guess that it’s the function running in the select list since we know what we’re doing, but, you know…

We can bring some clarity by running sp_WhoIsActive like this:

sp_WhoIsActive @get_plans = 1, 
               @get_outer_command = 1;

The outer command parameter will show us the query calling the function, which’ll look more familiar.

SQL Server sp_WhoIsActive
Headline News

Second Confusion: Phantom Parallelism

We’re hitting more of those harmless, silly little CXCONSUMER waits.

But how? Our query plan is serial!

SQL Server Query Plan
Glam Chowder

This part is a little less obvious, but if we get an estimated plan for our query, or track down the query plan for the function, it becomes more obvious.

SQL Server Query Plan
Questionable Taco

The query plan for the function is parallel — a cute ~nuance~ about scalar udfs is that they only prevent the query calling them from going parallel.

The function itself can go parallel. So that’s… nice.

I guess.

They Walked Inlined


In compat level 150, things are more clear.

SQL Server sp_WhoIsActive
CLRLY

The inner and outer text are the same. There’s more of that CXCONSUMER, though. Hoowee.

SQL Server Query Plan
Might as well jump.

But at least now we have a query plan that matches the parallel waits, right?

In the next post, we’re gonna talk more about those wait stats, though.

Thanks for reading!