Blog

Signs You Need SQL Server Enterprise Edition

But Postgres Is So Much Cheaper


There’s a lot of cool stuff in Enterprise Edition of SQL Server, which is probably why it costs $7000 a core.

When’s the last the price went up, though? Hm?

Real Availability Groups

HA isn’t my thing, but a lot of people seem to be into it. I still prefer Failover Clusters most of the time, but for folks with a deeper interest in self-flagellation, Availability Groups are there for you. In Standard Edition, you don’t get the full fledged technology though. There are a lot of limitations, and most of the time those limitations are so stifling that people bail on them pretty early.

Full Batch Mode

SQL Server Standard Edition hobbles batch mode pretty badly. DOP is limited to two, and there’s no SIMD support. It’s totally possible to have batch mode queries running slower than row mode queries, because the row mode queries can use much higher DOPs and spread the row workload out.

I’d almost rather use indexed views in Standard Edition for large aggregations, because there are no Edition-locked enhancements. You’ll probably wanna use the NOEXPAND hint either way.

All The RAM

Memory is just about the most important consideration for SQL Server hardware. It can truly make or break a workload. Sure, CPU can too, but without sufficient memory it’s unlikely that you’ll be able to push CPUs hard enough to find out.

With Enterprise Edition, you can pack a server with as much memory as you can download. I spend a lot of time trying to explain this to people, and when they finally listen, they’re amazed at the difference.

Resource Governor

I don’t like this for much, but I absolutely adore it for capping memory grants lower. Kind of building on the same points as above, memory is shared between the buffer pool and query memory grants. By default, any query can come along and ask for 25% of max server memory, and SQL Server is willing to let up to three queries doing that run concurrently.

That means ~75% of your buffer pool or so can get eaten alive by query memory grants. And lemme tell you, the optimizer can beĀ really bad at guessing memory grant needs. Really bad.

Online Indexing

If you’re at the point where you need to think hard about some of the stuff I’ve already talked about, you’re probably at the point where your data is reasonably big. Creating new indexes can be tough if you need to do it on Standard Edition because a lot of stuff can end up blocked while it’s happening. That means index changes have to wait for maintenance windows, which makes it harder to solve big problems on the spot.

Thanks for reading!

Going Further


If this is the kind of SQL Server stuff you love learning about, you’ll love my training. I’m offering a 75% discount to my blog readers if you click from here. I’m also available for consulting if you just don’t have time for that and need to solve performance problems quickly.

Signs You Need Batch Mode To Make Your SQL Server Queries Faster

My Name Is


I speak with a lot of DBAs and developers who have either heard nothing about column store and batch mode, or they’ve only heard the bare minimum and aren’t sure where it can help them.

Here’s a short list of reasons I usually talk through with people.

Your Reporting Queries Hit Big Tables

The bigger your tables get, the more likely you are to benefit, especially if the queries are unpredictable in nature. If you let people write their own, or design their own reports, nonclustered column store can be a good replacement for nonclustered row store indexes that were created specifically for reporting queries.

In row store indexes, index key column order matters quite a bit. That’s not so much the case with column store. That makes them an ideal data source for queries, since they can scan and select from column independently.

Your Predicates Aren’t Always Very Selective

Picture the opposite of OLTP. Picture queries that collect large quantities of data and (usually) aggregate it down. Those are the ones that get along well with column store indexes and batch mode.

If most of your queries grab and pass around a couple thousand rows, you’re not likely to see a lot of benefit, here. You wanna target the ones with the big arrows in query plans.

Your Main Waits Are I/O And CPU

If you have a bunch of waits on blocking or something, this isn’t going to be your solve.

When your main waits are CPU, it could indicate that queries are overall CPU-bound. Batch mode is useful here, because for those “big” queries, you’re passing millions of rows around and making SQL Server send each one to CPU registers. Under batch mode, you can send up to 900 at a time. Just not in Standard Edition.

When your main waits are on I/O — reading pages from disk specifically — column store can be useful because of the compression they offer. It’s easy to visualize reading more compact structures being faster, especially when you throw in segment and column elimination.

Your Query Plans Have Some Bad Choices In Them

SQL Server 2019 (Enterprise Edition) introduced Batch Mode On Row Store, which let the optimizer heuristically select queries for Batch Mode execution. With that, you get some cool unlocks that you used to have to trick the optimizer into before 2019, like adaptive joins, memory grant feedback, etc.

While those things don’t solve every single performance issue, they can certainly help by letting SQL Server be a little more flexible with plan choices and attributes.

The Optimizer Keeps Choosing Cockamamie Parallel Sort Merge Plans That Make No Sense And Force You To Use Hash Join Hints All The Time

šŸ¤¦ā€ā™‚ļø

Thanks for reading!

Going Further


If this is the kind of SQL Server stuff you love learning about, you’ll love my training. I’m offering a 75% discount to my blog readers if you click from here. I’m also available for consulting if you just don’t have time for that and need to solve performance problems quickly.

Performance Issues With NOT EXISTS Queries In SQL Server

Born Day


I’m going to start this post off sort of like Friday’s post:

Look, I really like EXISTS and NOT EXISTS. I do. They solve a lot of problems.

This post isnā€™t a criticism of them at all, nor do I want you to stop using them. I would encourage you to use them more, probably.

If you keep your head about you, youā€™ll do just fine.

The difference here is specific to NOT EXISTS, though, and it has to do with join reordering.

Or rather, the lack of join reordering.

Let’s get after it.

Happy Kids


When we write our query like so, things are fine.

The Users and Badges tables are relatively small, and a parallel hash join query makes short work of the situation.

SELECT
    c = COUNT_BIG(*)
FROM dbo.Users AS u
WHERE u.Reputation > 1000
AND   
(
    NOT EXISTS
        (
            SELECT
                1/0
            FROM dbo.Badges AS b
            WHERE b.UserId = u.Id
        )
    AND  NOT EXISTS
             (
                 SELECT
                     1/0
                 FROM dbo.Comments AS c
                 WHERE c.UserId = u.Id
             )      
);

This query finishes in a shart under a second.

SQL Server Query Plan
promised

Notice that since no rows pass the first join, the Comments table is left unscathed.

BUT THENā„¢

Bad Times


If we write the query like this, the optimizer leaves things alone, and we get a much worse-performing query.

SELECT
    c = COUNT_BIG(*)
FROM dbo.Users AS u
WHERE u.Reputation > 1000
AND   
(
    NOT EXISTS
        (
            SELECT
                1/0
            FROM dbo.Comments AS c
            WHERE c.UserId = u.Id
        )   
    AND NOT EXISTS
            (
                SELECT
                    1/0
                FROM dbo.Badges AS b
                WHERE b.UserId = u.Id
            )   
);

This one clocks in around 6 seconds, and complains of an excessive memory grant.

SQL Server Query Plan
hello xml!

The big time suck here is spent hitting the Comments table, which is significantly larger than the Badges table.

Totally Wired


The order that you write joins and where clause elements in generally doesn’t matter much, but in the case of NOT EXISTS, it can make a huge difference.

I realize that there are only two NOT EXISTS clauses in these examples, and that hardly makes for a compelling “always” statement. But I did a lot of experimenting with more tables involved, and it really doesn’t seem like the optimizer does any reordering of anti-semi joins.

Thanks for reading!

Going Further


If this is the kind of SQL Server stuff you love learning about, you’ll love my training. I’m offering a 75% discount to my blog readers if you click from here. I’m also available for consulting if you just don’t have time for that and need to solve performance problems quickly.

Performance Issues With EXISTS Queries In SQL Server

Dos Puntos


Look, I really like EXISTS and NOT EXISTS. I do. They solve a lot of problems.

This post isn’t a criticism of them at all, nor do I want you to stop using them. I would encourage you to use them more, probably.

But there’s some stuff you need to be aware of when you use them, whether it’s in control-flow logic, or in queries.

If you keep your head about you, you’ll do just fine.

IF EXISTS


The issue you can hit here is one of row goals. And a T-SQL implementation shortcoming.

If I run this query, it’ll chug along for about 10 seconds.

IF EXISTS
(
    SELECT 
       1/0
    FROM dbo.Posts AS p
    JOIN dbo.Votes AS v
        ON  p.Id = v.PostId
    WHERE v.VoteTypeId = 1
    AND   v.CreationDate >= '2018-12-01'
    AND   p.PostTypeId = 1
)
BEGIN
    SELECT x = 1;
END;

The part of the plan that we care about is a seek into theĀ Votes table.

SQL Server Query Plan
eviction

SQL SERVER’S COST BASED OPTIMIZERā„¢ thinks that 2.52 (rounded to 3) rows will have to get read to find data we care about, but it ends up having to do way more work than that.

It’s worth a short topic detour here to point out that when you’re tuning a slow query, paying attention to operator costs can be a real bad time. The reason this query is slow isĀ because the costing was wrong and it shows. Costed correctly, you would not get this plan. You would not spend the majority of the query execution time executes in the lowest-costed-non-zero operator.

Normally, you could explore query hints to figure out why this plan was chosen, but you can’t do that in the context of an IF branch. That sucks, because a Hash Join hinted query finished in about 400ms. We could solve a problem with that hint, or if we disabled row goals for the query.

Fixing It


In order to tune this, we need to toggle with the logic a little bit. Rather than put a query in the IF EXISTS, we’re going to set a variable based on the query, and use the IF logic on that, instead.

DECLARE
    @do_it bit;

SELECT
    @do_it = 
    (
        SELECT 
            CONVERT
            (
                bit,
                ISNULL
                (
                    MAX(1), 
                	0
                )
            )
        FROM dbo.Posts AS p
        JOIN dbo.Votes AS v
            ON  p.Id = v.PostId
        WHERE v.VoteTypeId = 1
        AND   v.CreationDate >= '2018-12-01'
        AND   p.PostTypeId = 1
    )
OPTION(HASH JOIN);

IF @do_it = 1
BEGIN
    SELECT x = 1;
END;

This produces the fast plan that we’re after. You can’t use a CASE expression here and get a hash join though, for reasons explained in this post by Pablo Blanco.

But here it is. Beautiful hash join.

SQL Server Query Plan
blown

EXISTS With OR Predicates


A common query pattern is to is EXISTS… OR EXISTS to sort out different things, but you can end up with a weird optimizer query rewrite (SplitSemiApplyUnionAll) that looks a lot like the LEFT JOIN… IS NULL pattern for finding rows that don’t exist. Which is generally a bad pattern, as discussed in the linked post.

Anyhoo.

SELECT
    c = COUNT_BIG(*)
FROM dbo.Users AS u
WHERE u.Reputation > 1000000
AND   EXISTS
      (
          SELECT
              1/0
          FROM dbo.Badges AS b
          WHERE b.UserId = u.Id
      )
OR    EXISTS
      (
          SELECT
              1/0
          FROM dbo.Comments AS c
          WHERE c.UserId = u.Id
      );

This is what I’m talking about, in the plan for this query.

SQL Server Query Plan
made for the movies

Rather than do two semi joins here for the EXISTS, we get two right outer joins. That means (like in the linked post above), all rows between tables are joined, and filters are applied much later on in the plan. You can see one of the right outer joins, along with the filters (on expressions!) in the nice picture up there.

Fixing It


The fix here, of course (of course!) is to write the query in a way that the optimizer can’t apply that foolishness to.

SELECT
    c = SUM(x.c)
FROM 
(
    SELECT
        c = COUNT_BIG(*)
    FROM dbo.Users AS u
    WHERE u.Reputation > 1000000
    AND   EXISTS
          (
              SELECT
                  1/0
              FROM dbo.Badges AS b
              WHERE b.UserId = u.Id
          )
    
    UNION ALL
    
    SELECT
        c = COUNT_BIG(*)
    FROM dbo.Users AS u
    WHERE EXISTS
          (
              SELECT
                  1/0
              FROM dbo.Comments AS c
              WHERE c.UserId = u.Id
          )
) AS x;

This query completes in around 1.5 seconds, compared to 4.9 seconds above.

SQL Server Query Plan
explored

Seasoned Veteran


It’s rough when you run into these problems, because solutions aren’t always obvious (obvious!), nor is the problem.

Most of the posts I write about query tuning arise from issues I solve for clients. While most performance problems come from predictable places, sometimes you have to deal with edge cases like this, where the optimizer mis-costs things.

Thanks for reading!

Going Further


If this is the kind of SQL Server stuff you love learning about, you’ll love my training. I’m offering a 75% discount to my blog readers if you click from here. I’m also available for consulting if you just don’t have time for that and need to solve performance problems quickly.

sp_WhoIsActive Version 12 Is Out!

Get’em Daddy


You know, you love it, you often wondered if it would ever get a new version!

Now it has! <— Click there to get it.

What’s New?


  • New parameter,Ā @get_memory_info, that exposes memory grant information, both in two top-level scalar columns and a new XML-basedĀ memory_infoĀ column.
  • Better handling of the newer CX* parallelism wait types that have been added post-2016
  • A top-level implicit_transaction identifier, available inĀ @get_transaction_info = 1Ā mode
  • AddedĀ context_infoĀ andĀ original_login_nameĀ toĀ additional_infoĀ collection
  • A number of small bug fixes
  • Transition code to use spaces rather than tabs

New file name: Not an enhancement per se, but please note that starting with this release there is a new source file,Ā sp_WhoIsActive.sql. The old file,Ā who_is_active.sql, will be kept around for a few months and then removed. Please migrate any processes that might be using the old name.

What Does It Look Like?


For memory grant information:

You’ll wanna run like so:

EXEC sp_WhoIsActive
    @get_memory_info = 1;

You’ll get back some new columns:

SQL Server sp_WhoIsActive
clicky

In the XML, you’ll see stuff like this, which is pretty cool.

<memory_info>
  <memory_grant>
    <request_time>2021-11-11T05:08:57.870</request_time>
    <grant_time>2021-11-11T05:08:57.870</grant_time>
    <requested_memory_kb>17350600</requested_memory_kb>
    <granted_memory_kb>17747912</granted_memory_kb>
    <used_memory_kb>17743872</used_memory_kb>
    <max_used_memory_kb>17743872</max_used_memory_kb>
    <ideal_memory_kb>85373512</ideal_memory_kb>
    <required_memory_kb>1352</required_memory_kb>
    <dop>8</dop>
    <query_cost>4791.8359</query_cost>
  </memory_grant>
  <resource_semaphore>
    <timeout_error_count>0</timeout_error_count>
    <target_memory_kb>69402424</target_memory_kb>
    <max_target_memory_kb>69402424</max_target_memory_kb>
    <total_memory_kb>69402424</total_memory_kb>
    <available_memory_kb>51654512</available_memory_kb>
    <granted_memory_kb>17747912</granted_memory_kb>
    <used_memory_kb>17679048</used_memory_kb>
    <grantee_count>1</grantee_count>
    <waiter_count>0</waiter_count>
  </resource_semaphore>
  <workload_group>
    <name>default</name>
    <request_max_memory_grant_percent>25</request_max_memory_grant_percent>
    <request_max_cpu_time_sec>0</request_max_cpu_time_sec>
    <request_memory_grant_timeout_sec>0</request_memory_grant_timeout_sec>
    <max_dop>0</max_dop>
  </workload_group>
  <resource_pool>
    <name>default</name>
    <min_memory_percent>0</min_memory_percent>
    <max_memory_percent>100</max_memory_percent>
    <min_cpu_percent>0</min_cpu_percent>
    <max_cpu_percent>100</max_cpu_percent>
  </resource_pool>
</memory_info>

For parallelism information:

You’ll wanna run like so:

EXEC sp_WhoIsActive
    @get_task_info = 2;

You’ll see this in the wait_info column, if your queries are hitting parallelism waits. Previously we only support CXPACKET, but now we support CXPACKET, CXCONSUMER, CXSYNC_PORT, and CXSYNC_CONSUMER.

This can be really helpful for tracking down issues in parallel queries.

For implicit transaction information:

You’ll wanna run like so:

EXEC sp_WhoIsActive
    @get_transaction_info = 1;

You’ll see a new column that will tell you if your god-awful JDBC driver is using the absolute mistake known as implicit transactions.

sp_WhoIsActive
bars

For additional info:

You’ll wanna run like so:

EXEC sp_WhoIsActive
    @get_additional_info = 1;

You’ll get back this column:

sp_WhoIsActive
clicky

If you click on it, you’ll get back this output, which now includes original login name, and context info.

<additional_info>
  <text_size>2147483647</text_size>
  <language>us_english</language>
  <date_format>mdy</date_format>
  <date_first>7</date_first>
  <quoted_identifier>ON</quoted_identifier>
  <arithabort>ON</arithabort>
  <ansi_null_dflt_on>ON</ansi_null_dflt_on>
  <ansi_defaults>OFF</ansi_defaults>
  <ansi_warnings>ON</ansi_warnings>
  <ansi_padding>ON</ansi_padding>
  <ansi_nulls>ON</ansi_nulls>
  <concat_null_yields_null>ON</concat_null_yields_null>
  <transaction_isolation_level>ReadCommitted</transaction_isolation_level>
  <lock_timeout>-1</lock_timeout>
  <deadlock_priority>0</deadlock_priority>
  <row_count>0</row_count>
  <command_type>SELECT</command_type>
  <sql_handle>0x020000004d3842022d406c17300f7e339224b8c5e0392bbb0000000000000000000000000000000000000000</sql_handle>
  <plan_handle>0x060008004d38420210a907e34d01000001000000000000000000000000000000000000000000000000000000</plan_handle>
  <statement_start_offset>122</statement_start_offset>
  <statement_end_offset>534</statement_end_offset>
  <host_process_id>16688</host_process_id>
  <group_id>2</group_id>
  <original_login_name>sa</original_login_name>
  <context_info>0x0000008a</context_info>
</additional_info>

Which is useful for people doing really weird stuff. Questionable stuff.

Again, you can grab the new version here!

Thanks for reading!

Going Further


If this is the kind of SQL Server stuff you love learning about, you’ll love my training. I’m offering a 75% discount to my blog readers if you click from here. I’m also available for consulting if you just don’t have time for that and need to solve performance problems quickly.

TRY_CAST And TRY_CONVERT Can Still Throw Errors In SQL Server

It Was Written


I was a bit surprised by this, because I thought the whole point of these new functions was to avoid errors like this.

SELECT
    oops = TRY_CONVERT(uniqueidentifier, 1);
GO 

SELECT
    oops = TRY_CAST(1 AS uniqueidentifier);
GO

Both of theseĀ selects will throw the same error message:

Msg 529, Level 16, State 2, Line 2
Explicit conversion from data type int to uniqueidentifier is not allowed.

Which, you know,Ā fine. I get that limitation of anĀ explicit cast or convert, but why not just throw a NULL like other cases where the expression isn’t successful?

Bummer.

Thanks for reading!

Going Further


If this is the kind of SQL Server stuff you love learning about, you’ll love my training. I’m offering a 75% discount to my blog readers if you click from here. I’m also available for consulting if you just don’t have time for that and need to solve performance problems quickly.

I’m Officially A Maintainer Of sp_WhoIsActive!

Busyness, Man


sp_WhoIsActive is probably one of the most famous utilities in SQL Server. To the point where when I see people using sp_who – sp_who4762, I immediately disqualify their ability as a DBA.

If you think that’s unfair, it’s probably because you use sp_who2.

But anyway, with Mr. Machanic being busy with outside of SQL Server projects, the script hadn’t been getting much attention lately. Since I had been working on a couple issues, and saw other piling up, I offered to help with Adam’s project in the same way I help with the First Responder Kit stuff.

hired

I’ll be working on issues over there to get new stuff and bug fixes into the script. If there’s anything you’d like to see in there, or see fixed, let us know!

Help You


If you’re hitting an issue with the script and you want to do some investigating, here’s what I suggest doing.

EXEC sp_WhoIsActive
    @show_own_spid = 1,
    @get_full_inner_text = 1;

Run that along with any of the other parameters you’re using, and click on the sql_text column, that’ll give you the whole query that WhoIsActive runs. Paste that into a new SSMS window, and get rid of the XML artifacts like <?query -- and --?>.

After that, you’ll have to declare a few variables to make things run correctly:

DECLARE
    @i bigint = 922337203685477580,
    @recursion smallint = 1,
    @blocker bit = 0;


You’ll also wanna delete some of the header information that comes along:

(@recursion SMALLINT, @filter sysname, @not_filter sysname, @first_collection_ms_ticks BIGINT)DECLARE @blocker BIT;
SET @blocker = 0;
DECLARE @i INT;
SET @i = 2147483647;

After that, you can hit F5 and it’ll run. If your problem is in the main branch of the script that generates all the complicated dynamic SQL, that’ll help you figure out exactly where the problem is.

Thanks!

Going Further


If this is the kind of SQL Server stuff you love learning about, you’ll love my training. I’m offering a 75% discount to my blog readers if you click from here. I’m also available for consulting if you just don’t have time for that and need to solve performance problems quickly.

The Right Way To Check For NULLs In SQL Server Queries

101ers


This is still one of the most common problems I see in queries.

People are terrified of NULLs. People are afraid to merge on freeways in Los Angeles.

What results is this endless stream of poorly performing queries, and some surprise logic bugs along the way.

I don’t have much more else of an intro. The TL;DR is that you should use natural expressions like IS NULL or IS NOT NULL, rather than any of the built in functions available to you in SQL Server, like ISNULL, COALESCE, et al. which are presentation layer functions with no relational meaning whatsoever.

From here on out, we’ll be calling themĀ unnatural expressions. Perhaps that will get through to you.

Tuning Wizard


First is something I’ve covered before, but when you useĀ unnatural expressions, the optimizer will not give you feedback about useful indexes.

SQL Server Query Plan
tenting

The first query generates a missing index request, the second one does not. The optimizer hasĀ abandoned all hope with the use of anĀ unnatural expression.

Lethargy


The other issue withĀ unnatural expressions comes down to implicit conversion.

Take this, for instance.

DECLARE 
    @i int = 0;

SELECT 
    c = 
        CASE ISNULL(@i, '') 
             WHEN '' 
             THEN 1 
             ELSE 0 
        END;

This will return a 1, because 0 and ” can be implicitly converted.

Perhaps less obvious, and more rare, is this:

DECLARE 
    @d datetime = '19000101';

SELECT 
    c = 
        CASE ISNULL(@d, '') 
             WHEN '' 
             THEN 1 
             ELSE 0 
        END;

Which will also return 1.

Not many databases have stuff going back to 1900, but I do see people using that as a canary value often enough.

Perfidy


If that’s not enough to get you off the idea, let’s look at how this stuff plays out in the real world.

First, let’s get ourselves an index. Without that, there’s fundamentally no difference in performance.

CREATE INDEX v ON dbo.Votes
    (BountyAmount);

Our gold standard will be these two queries:

SELECT
    c = COUNT_BIG(*)
FROM dbo.Votes AS v
WHERE v.BountyAmount IS NULL;

SELECT
    c = COUNT_BIG(*)
FROM dbo.Votes AS v
WHERE v.BountyAmount IS NOT NULL;

The first one that checks for NULL values returns a count of 182,348,084.

The second one that checks for NOT NULL values returns a count of 344,070.

Keep those in mind!

The query plans for them both look like this:

SQL Server Query Plan
jumbotron

Which run, respectively (and respectably), in 846ms and 26ms. Obviously the query with the more selective predicate will have a time advantage, here.

Wrongly


Here’s where things start to go wrong.

This query returns incorrect results, but you’re probably used to that because of all the NOLOCK hints in your queries anyway.

SELECT
    c = COUNT_BIG(*)
FROM dbo.Votes AS v
WHERE ISNULL(v.BountyAmount, '') = '';

A count of 182,349,088 is returned rather than 182,348,084, because there are 1004 rows with a bounty of 0.

Even though we have an empty string in our query, it’s implicitly converted to 0.

SQL Server Query Plan
checked

And you thought you were so clever.

Badly


The exercises in futility that I see people carrying on with often look make use of ISNULL, COALESCE, and CASE expressions.

It’s worth noting here that COALESCE is only a CASE expression underneath, anyway. They are interchangeable in this respect.

For findings NULLs, people will screw up and do this:

SELECT
    c = COUNT_BIG(*)
FROM dbo.Votes AS v
WHERE ISNULL(v.BountyAmount, -1) = -1;

SELECT
    c = COUNT_BIG(*)
FROM dbo.Votes AS v
WHERE COALESCE(v.BountyAmount, -1) = -1;

We can use -1 here because it doesn’t naturally occur in the data. Results are correct for both, but performance is comparatively horrible.

SQL Server Query Plan
up high

We’re looking at 2.5 seconds compared to 900ms. This situation gets worse with the more selective predicates, too.

SQL Server Query Plan
down low

These both take roughly the same time as the otherĀ unnatural forms of this query, but recall theĀ natural version of this query finished in under 30ms.

Deadly


I hope I don’t have to write about this anymore, but at the rate I see people doing this stuff, I kind of doubt it.

Broken Record Enterprises, it feels like sometimes.

I’m not sure why anyone thinks this is a good idea. I’ve heard rumors that it comes from application developers who are used to NULLs throwing errors writing SQL queries, where they don’t pose the same threat.

Who knows, though. Maybe people just really like the festive pink text color that functions turn in SSMS.

Thanks for reading!

Going Further


If this is the kind of SQL Server stuff you love learning about, you’ll love my training. I’m offering a 75% discount to my blog readers if you click from here. I’m also available for consulting if you just don’t have time for that and need to solve performance problems quickly.

Dealing With Wide Missing Index Requests In SQL Server

We’ve All Been There


You’re running a query that selects a lot of columns, and you get a missing index request.

For the sake of brevity, let’s say it’s a query like this:

SELECT
    p.*
FROM dbo.Posts AS p
WHERE p.ParentId = 0;

The missing index request I get for this query is about like so:

CREATE NONCLUSTERED INDEX [<Name of Missing Index, sysname,>]
ON [dbo].[Posts] ([ParentId])
INCLUDE ([AcceptedAnswerId],[AnswerCount],[Body],[ClosedDate],[CommentCount],[CommunityOwnedDate],
[CreationDate],[FavoriteCount],[LastActivityDate],[LastEditDate],[LastEditorDisplayName],[LastEditorUserId],
[OwnerUserId],[PostTypeId],[Score],[Tags],[Title],[ViewCount])

But that’s laughable, because it’s essentially a shadow clustered index. It’s every column in the table ordered by <some column>.

And Again


Under many circumstances, you can trim all those included columns off and make sure there’s a usable index with ParentId as the leading column.

I’m not a fan of single key column indexes most of the time, so I’d avoid that practice.

But sure, if you haveĀ reasonably selective predicates, you’ll get a decent seek + lookup plan. That’s not always going to be the case, though, and for various reasons you may end up getting a poor-enough estimate on a reasonably selective predicate, which will result in a bad-enough plan.

Of course, other times you may not have very selective predicates at all. Take that query up there, for example. There are 17,142,169 rows in the Posts table (2013), and 6,050,820 of them qualify for our predicate on ParentId.

This isn’t a case where I’d go after a filtered index, either, because it’d only be useful for this one query. And it’d still be really wide.

There are four string columns in there, all nvarchar.

  • Title (250)
  • Tags (150)
  • LastEditorDisplayName(40)
  • Body(max)

Maybe Something Different


If I’m going to create an index like that, I want more out of it than I could get with the one that the optimizer asked for.

On a decently recent version of SQL Server (preferably Enterprise Edition), I’d probably opt for creating a nonclustered column store index here.

You get a lot of benefits from that, which you wouldn’t get from the row store index.

  • Column independence for searching
  • High compression ratio
  • Batch Mode execution

That means you can use the index for better searching on other predicates that aren’t terribly selective, the data source is smaller and less likely to be I/O bound, and batch mode is aces for queries that process a lot of rows.

Column store indexes still have some weird limitations and restrictions. Especially around data types and included columns, I don’t quite understand why there isn’t better parity between clustered and nonclustered column store.

Thanks for reading!

Going Further


If this is the kind of SQL Server stuff you love learning about, you’ll love my training. I’m offering a 75% discount to my blog readers if you click from here. I’m also available for consulting if you just don’t have time for that and need to solve performance problems quickly.

Trying out the new premium-series Azure SQL Managed Instances

At Microsoft Ignite 2021, public preview for new “premium-series” hardware was announced for Azure SQL Managed Instances. There’s even a black friday sort of sale during this month where you can do testing on premium-series VMs without paying for the compute costs. As someone without free cloud bucks: sign me up!

I did some basic query benchmarking to get an idea of the performance difference between the new premium VMs and the standard gen 5 VMs. The test VMs aren’t identical in specs: the standard-series has 4 vCore with 20.4 GB of memory and the premium-series has 8 vCore with 56 GB of memory. I will attempt to call out any situations where that spec difference had a measurable impact.

What is an Intel 8370C processor?

When I see an Intel CPU model that I’m not familiar with, the first thing I do is try to look it up on the Intel Ark website. Unfortunately, like other cloud specific CPUs, there is no information available there on the Intel 8370C. I did try to ask around but I didn’t get very far. Here’s everything that I know:

  • 3rd Generation IntelĀ® XeonĀ® Scalable Processors
  • Ice Lake code name
  • At least 24 cores per socket
  • 2.8 GHz base
  • Turbo clock speed of 3.5GHz
  • Intel Turbo Boost Technology 2.0
  • Intel AVX-512
  • Intel Deep Learning Boost

That will have to do. It’s a bit annoying trying to compare on-prem performance numbers to MI when we don’t have full details about the processor in the cloud, but this seems to be how it is.

What is a Managed Instance vCore?

There are a few things that you need to know in order to put a vCPU or vCore count into perspective:

1) What is the hardware in the physical host? For Managed instances, we know that the gen 5 series physical hosts have Intel E5-2673 v4, SP-8160, or 8272CL processors. For the premium-series, we know that the physical hosts only have Intel 8370C processors. We may not know exactly what those processors are, but we at least have some information.

2) How are the logical cores in the VM spread over the physical costs of the physical host? In other words, are 4 vCores generally spread over 2 physical cores on the host or are they spread over a single hyperthread each from four different physical cores? Those configurations will result in very different application throughput. In a blog post that I haven’t written yet, I present evidence that you should think of Managed Instance VMs as being spread over the minimum number of physical cores on the host. In other words, a 4 vCore VM will at most get 2X the throughput of a single query running at MAXDOP 1.

3) How much CPU oversubscription is there at the physical host level? Your VM may be fighting for CPU time with other VMs on the same physical host. With MI, you only have access to the SQL Server instance. As far as I know, there really isn’t a way to tell if your query runtime is getting penalized due to activity by some other VM. I’ve seen query performance degrade on MI instances with nothing else going on. The only way that I know to explain it is some kind of oversubscription at the host level. Note that Microsoft only offers compute isolation for standard-series VMs at 40+ vCores and for premium-series VMs at 64+ vCores.

You might be wondering why I’m writing all of this in a blog post about query performance testing. The reason is simple: CPU time at the individual query level may be a significantly less consistent performance metric on Managed Instances compared to what you’re used to. As an example from this round of testing, the same query used both 1289 ms of CPU and 1929 ms of CPU under conditions that appeared to be identical. Both hyperthreading and VM oversubscription can contribute to “inflated” CPU times. You might be getting time on one of the processor’s logical cores but that time is shared with whatever else may be running on the other logical core. And who even knows what HyperV is doing in terms of scheduling?

With that said, I did not observe the wild variances in CPU time on the premium-series VM. I suspect that this is a property of the public preview nature of the VM. Still, I ran all queries five times each and averaged the results to mitigate the CPU variance problem. When query tuning on Managed Instances in the real world, do note that if your rewrite reduces CPU time by 20%, you may have not accomplished anything. You’ll need to test performance many times or evaluate performance in a different way, perhaps by examining the query plan shape or (gasp!) looking at logical reads.

While Loop Test

The first test that I did was the simple WHILE loop described here. Managed Instances have significant observer overhead for this code compared to a vanilla SQL Server install. Perhaps it has something to do with all of the extended event sessions mentioned in the MI error log. It could be said that testing this T-SQL is really just benchmarking that observer overhead. However, it’s still CPU work, so why not do it?

The premium-series VM took an average of 663 CPU ms compared to 1043 CPU ms for the standard VMs.

Cross Join Test

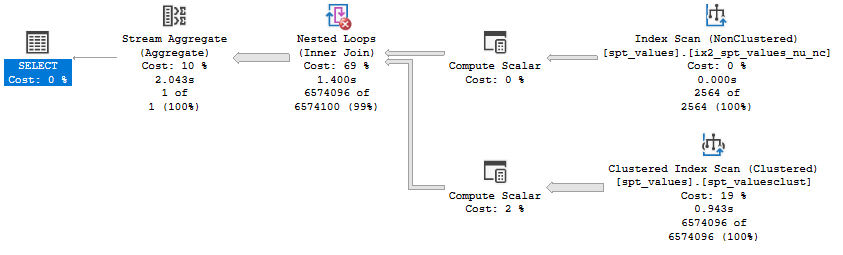
For the next test case, I wanted to reduce the observer overhead but still execute a CPU-bound query with a minimum of time lost to waits. I decided on the following query which calculates 6.5 million checksums:

SELECT MIN(CHECKSUM(CAST(t1.number AS BIGint) + CAST(t2.number AS BIGint)))
FROM master..spt_values t1
CROSS JOIN master..spt_values t2
OPTION (MAXDOP 1, NO_PERFORMANCE_SPOOL);

The query plan isn’t very exciting:

The premium-series VM took an average of 1277 CPU ms compared to 1876 CPU ms for the standard VMs.

Batch Mode Test

I also wanted to run a query that does some batch mode work without spilling to tempdb. I don’t know if it applies here, but in some cases, CPUs with newer instruction sets can get better performance with batch mode operations. First I created a simple CCI:

CREATE TABLE dbo.BatchModeTest (
ID1 BIGINT NOT NULL,
ID2 BIGINT NOT NULL,
ID3 BIGINT NOT NULL,
STRING VARCHAR(100),
INDEX CCI CLUSTERED COLUMNSTORE
);

INSERT INTO dbo.BatchModeTest WITH (TABLOCK)
SELECT q.RN, q.RN, q.RN, REPLICATE('Z', 100)
FROM
(
    SELECT ROW_NUMBER() OVER (ORDER BY (SELECT NULL)) RN
    FROM master..spt_values t1
    CROSS JOIN master..spt_values t2
) q
OPTION (MAXDOP 1);

I then tested the performance of the following query:

SELECT COUNT_BIG(DISTINCT ID1)
FROM BatchModeTest
OPTION (MAXDOP 1);

The premium-series VM took an average of 724 CPU ms compared to 1162 CPU ms for the standard VMs.

On a batch mode related note, I observed that Managed Instances don’t seem to have the fix for the “queries on CCIs can get trivial plans which result in no batch mode” issue that was addressed with SQL Server 2017. I sent this feedback to Microsoft and it was received positively, so perhaps there will be an update one day on Managed Instances that addresses that problem. I have to admit that I’m curious as to how such a situation is possible. Are there other fixes that haven’t been ported to the Managed Instance bits yet? Performance tuning in the cloud is difficult enough without the absence of performance fixes implemented years ago in the boxed product!

Application Query Tests

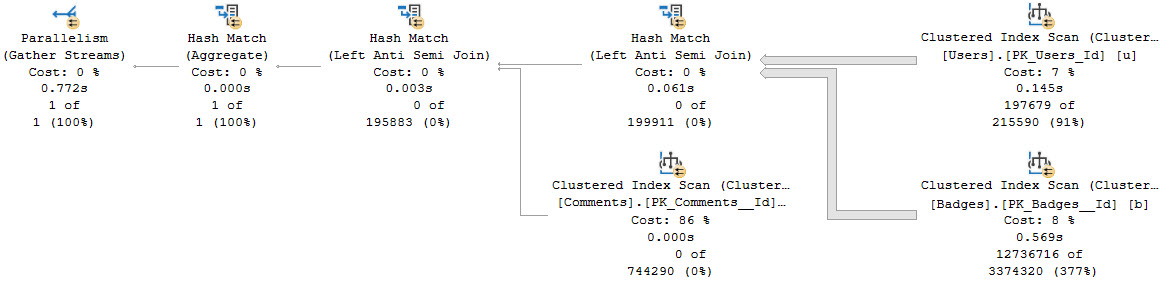
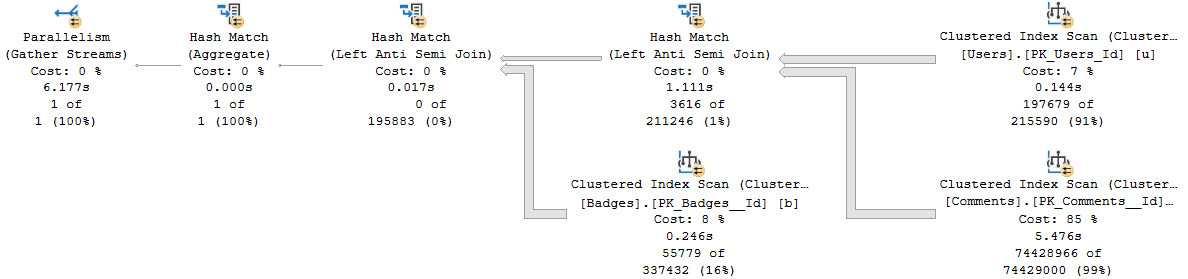
I also tested two of our application queries which are known pain points for our end users. I am not able to share any information about the queries, but you may consider them to be significantly more “real world” compared to the previous tests done so far. As with the other tests conducted so far, both queries used significantly less CPU time on the premium-series managed instance. Here are all of the performance testing results so far:

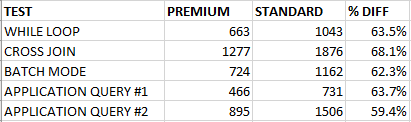
I will note once again that the VMs aren’t identical in specs: the standard-series has 4 vCore with 20.4 GB of memory and the premium-series has 8 vCore with 56 GB of memory. With that said, tempdb spills would have contributed to at most a 30 ms difference in CPU time for the application queries.

Maintenance Tests

By popular demand, I also tested a few maintenance activities. I ran DBCC CHECKTABLE against one of the largest tables in the database. It took 44 seconds to complete on the premium-series and 65 seconds to complete on the standard-series.

Rebuilding an index of a table was more interesting. The premium-series VM took significantly longer than the standard-series: 209 seconds vs 158 seconds. However, the premium-series tests used significantly less CPU: 55 seconds vs 109 seconds. I saw a lot of LOGBUFFER waits on the premium-series VM that weren’t observed on the standard-series. As far as I can tell, storage performance should have been identical between the two VMs. Perhaps I just got unlikely, or maybe the root cause of this difference will be addressed before premium-series VMs become generally available.

Final Thoughts

Based on limited public preview results, the new premium-series VMs are significantly more CPU efficient than the standard-series VMs for several different types of queries. I saw a 40% reduction in CPU time across the board in my testing. Workloads with queries that are CPU bound may be able to reduce their overall vCore count and still see improved query performance by switching to the premium-series VMs. For our workload, based on the information that I have, I would prefer a 24 vCore premium-series VM over a 32 vCore standard-series VM. It’s a cheaper option with slightly more memory and more CPU power. Other workloads that aren’t as CPU bound may not see the same benefits from switching to the Intel 8370C. Perhaps the 15% price premium isn’t worth it in all cases.

For VM sizes that don’t qualify for compute isolation (fewer than 64 vCores), I suspect that these test results are biased in favor of the premium-series. It’s just speculation on my part, but I didn’t see the kind of oversubscription at the host level with the premium-series that I’m used to seeing on the standard-series MI VMs. It is possible that the premium-series VMs will have less of a performance advantage compared to the standard-series once they become generally available.

I’ll add that databases platforms, and software in general, are supposed to serve us and make our lives easier. Too often it feels like we’re the ones serving the database platforms instead. That’s part of why I’m such a big advocate for using the right hardware for your important relational database workloads. It’s really hard to get excited when spinning up a new Managed Instance VM only to get something on an E5-2673 v4 physical host. That doesn’t sound like the right hardware to me.

Thanks for reading!