Working with clients long term presents some different options for how I interact with their SQL Servers.
Working on a web meeting with the team watching
Having them give me direct access to SQL Server
While everything kicks off with some analysis done all together, different teams have different ways of working with me after that.
It really depends on the point of the engagement.
Facetime
Some companies have teams of folks that want to:
Have me look at and work on specific things
Ask me questions about a bunch of topics
Learn how I do things so they can analyze and tune on their own
For those clients, we schedule meetings for a block of time, and someone shares their screen so I can take remote control.
It’s less messy, because everyone can see what I’m running, ask questions about the options and output, and I don’t need any credentials.
This way is my favorite, because it’s less for me to keep track of, and more interactive.
Shadowy
Other companies either don’t have time for all that, or are using me to do things they don’t have staff to do. Competency, or something.
For those folks, there’s usually a few things involved:
VPNs
Jump boxes
Authenticator apps
Only two clients have ever sent me a computer to work on. For everyone else, I set up a VM specific to them to use and work on.
It helps me keep things separated, and it makes getting rid of all the evidence assets when the engagement is done, and after everything has been handed over.
This way is more secure for everyone, but I have had issues with a couple VPN providers not liking connections from a VM, because they detect it as a RDP session.
You can work around that by using Team Viewer or another remote access app, but thankfully those issues are sporadic.
While this isn’t my favorite way to work, it does allow me to work asynchronously. I sometimes keep weird hours, and it’s nice to be able to get things done on my own schedule.
It’s also nice to be able to hand someone a flawlessly tuned query without them having to see all the different things I tried to get there.
Party Of One
Since I’m a one man party, I can’t really offer on-call or emergency hours.
I also tend to focus exclusively on SQL Server performance issues, and not security, corruption or server-down issues. I respect people who want to deal with those issues, but the liability is too big, and I’d much rather stick to the performance tuning stuff that I’m passionate about.
In tomorrow’s post, I’ll talk about some things you can do to get prepared to work with a consultant to make their jobs easier.
Thanks for reading!
Going Further
If this is the kind of SQL Server stuff you love learning about, you’ll love my training. I’m offering a 75% discount to my blog readers if you click from here. I’m also available for consulting if you just don’t have time for that and need to solve performance problems quickly.
I’m going to be running some posts about working with clients, which might be sort of specific to the way I tend to work with people.
I realize it’s not my usual technical content, but every once in a while the brain needs a break from writing about that stuff all the time.
Anyway, the first post up is about who should attend meetings.
Stakeholders
Usually there’s a mix of people who are potentially invested in SQL Server.
Technical staff, like DBAs, developers, and sysadmins
Executives and managers
Customer support to advocate for client issues
Third party developers who build the product
Sometimes there are other people involved, but that covers the most common mix.
I like working with people who work with the server and product directly, because they have the best domain knowledge about why things are the way they are, and where the bodies are buried.
Working In The Dark
I tell everyone I work with that I don’t like working in the dark. That means a couple things:
I don’t want my process to be a black box, I want to build self-sufficiency where I can
I don’t want to wander blindly through a server, I want to focus on the pieces where the pain is
That’s why I kick off every engagement by working via web meeting with anyone who’s interested. We look at everything all together.
If it touches the SQL Server, it’s in scope:
Hardware
Settings
Queries
Indexes
Monitoring data
Other stuff sometimes comes into the mix, like looking at application code and servers, but there’s not a ton I can do to fix those directly. It’s mostly just advice.
I save any scripts we use so folks can run them later, on any other SQL Server. That’s part of building self-sufficiency, but not working in the dark isn’t just for your benefit, it’s for me too.
Anyone can find a slow query, but I like to focus in directly on the queries that are causing the business pain I’m getting paid to solve.
Even with Query Store or a monitoring tool, you’re only guessing at exactly which queries users are complaining about.
Showtime
The thing is, not everyone needs to attend every minute of every meeting.
Executives and managers very rarely have the time and technical knowledge to make attending start to finish. They might care very much about the product, and making sure the engagement is successful, but I usually save their time for delivery of findings.
After the initial analysis, I write detailed findings about the issues that get uncovered during the initial meeting, and I start them off with an executive summary.
You know, for executives.
That gives the really busy, non-technical folks a chance to hear high level pain points, and to ask questions about them without having to sit through all the technical voodoo behind them
After that, I get into all the gory details with the folks who have the best chance of understanding them.
In tomorrow’s post, I’ll talk about how I get access to client SQL Servers in different circumstances.
Thanks for reading!
Going Further
If this is the kind of SQL Server stuff you love learning about, you’ll love my training. I’m offering a 75% discount to my blog readers if you click from here. I’m also available for consulting if you just don’t have time for that and need to solve performance problems quickly.
I wrote one of these after six months of independent consulting, and then never cared to do one again. You might find the April 1 timing of this weird, but there’s no additional Fools here, just me as usual.
Why bother now? Well, after three years, I figure I’m probably too much of a dandy to ever get a real job again. Since that’s the case, I’ve done a couple things:
I purchased the domain erikdarling.com for a stupid amount of money
I hired some nice gals from Brooklyn to make it look professional
Now, here’s the thing: many times in my life spending a significant amount of money on things signaled me about to quit doing that thing. I have many thousands of dollars worth of hobby equipment that sits forgotten in various bags, boxes, and closets.
But not this time! Unless this here PowerBall ticket is lined up with the stars.
When I first started getting set up to do this, I bought an easy domain, hooked it up to WordPress, designed some logos myself that I thought evinced a SQL coach aesthetic or some such, and let it ride.
Turns out that very few people want a SQL coach. They want someone to work out for them.
I never said I was a fast learner.
Number Signs
Since that first section isn’t much of a blog post, I’ll talk a little about how things are doing business-wise.
I’ve worked with over 500 consulting clients, and I’ve sold training to over 1,500 people. Most of the training sales are fairly low dollar value, but I’m hoping that changes with the move to Podia.
For consulting, I’ve got a couple basic products: a two-day performance analysis, or a bucket of hours. I still don’t do on-call or night/weekend work, but I found that a lot of shops out there want the insurance policy that comes with having time on the clock to use.
There’s no need to get into great detail here, because I often tweak things in response to individual clients, but this has been working out really well.
Anyway, keep an eye out for a SEAMLESS TRANSITION to the new website over the next month or so, and uh… I dunno.
Other stuff.
We’ll see.
Whatever.
Thanks for reading!
Going Further
If this is the kind of SQL Server stuff you love learning about, you’ll love my training. I’m offering a 75% discount to my blog readers if you click from here. I’m also available for consulting if you just don’t have time for that and need to solve performance problems quickly.
In the war of Chicken v Egg, one might say that it’s not worth developing a feature that isn’t exactly widely in use. Of course, the reason for that might be that… What got developed isn’t what people need.
Here are some similar examples:
Chicago Pizza
Tabs
Cats
Chunky peanut butter
See what I mean? I want better for Query Store.
With that said, here’s what I think it should do better.
Searching
Query Store needs to give you a way to search for things you care about. A few of the things sp_QuickieStore lets you search for:
Query Ids
Plan Ids
Object names (functions, procedures)
Query Text
I built that because I need that, and so do a lot of other people. Just opening up a GUI and sorting by some metrics doesn’t help you when you need to find a specific thing that’s causing a problem.
If I can write queries to do that, I’m sure the fine folks at Microsoft can manage. I’m not that bright.
Ignoring
Some queries you don’t care about. At all. Ever.
You know how you can track some queries? I’d love a way to unsubscribe from some queries, too.
And uh, sp_QuickieStore lets you ignore a list of Query and Plan Ids in the output.
It should also ignore a few other things that you can’t really tune:
Index maintenance
Statistics updates
Query Store Queries
If you’ve ever looked in Query Store, seen some crazy outlier, and found one of the queries you just ran to populate the GUI, you’re not alone.
Visualizing
In SQL Server 2017, Query Store started collecting high level wait stats. I’m not asking for anything more granular, but how about giving me an option to see them broken down over time?
Right now, you open that view up and there are some columns that show you the highest waits, but not when they happened.
When is pretty important! You might wanna see things that use high CPU, but only during the day. Sure, that’s easy if you know when you want to look at, but if you just wanna get a sense of how things ebbed and flowed over the last day or week, you’re outta luck.
A nice line graph that you can choose which waits to include in broken down over time would be awesome, especially if you could zoom in to find out what was running during a window.
The reports now are all very rudimentary. Maybe Microsoft is being nice to monitoring tool companies and not stepping on their toes, but not everyone has one of those.
Or will ever have one of those.
Please, help!
Collecting
I’ve griped before about this, but Query Store doesn’t collect one of the most useful metrics from a query: the granted memory. It only collects used memory.
You can get that from the Plan Cache, but that thing is an unreliable grump. And yeah, you can get that if you look in the query plan, but… If I want to do some analysis and quickly figure out which queries asked for huge grants and then didn’t use them, it’s not very practical to open every query plan to do it.
I’d also love if it stored some of the actual/runtime metrics. Not every one. Maybe the last 1-5 plans, either for tracked queries, or for ones that meet a certain threshold for resource usage.
Imagine if you could get the compile and runtime parameters for a query you know is sensitive to parameter sniffing, so that you could easily reproduce the issue?
Your life would get a whole lot easier.
Analyzing
Since Query Store is somewhat asynchronous, it would be helpful if you could get some advice about some of the gremlins in your Query Plan.
There’s a ton of detail and data in those query plans that’s ripe for analysis. If you’ve ever looked at the Warnings column in sp_BlitzCache, you’ll understand what I mean.
Yeah, that all comes from a bunch of terrible XQuery, but dammit… Normal folks looking at query plans don’t always know what to look for.
Heck, I’d forget to look for everything on that list, too, and I spend a good chunk of my days staring at these darn things.
It doesn’t have to be as exhaustive, but it would give civilians a fighting chance of understanding why things are bonked.
Thanks for reading!
Going Further
If this is the kind of SQL Server stuff you love learning about, you’ll love my training. I’m offering a 75% discount to my blog readers if you click from here. I’m also available for consulting if you just don’t have time for that and need to solve performance problems quickly.
While I still don’t install Azure Data Studio by default, I heard recently from Erin Stellato (t) that there’s a preview of real, live, actual execution plans out now.
Since not having query plans available was one of my chief gripes about ADS, I figured this was a good time to install it.
The pro here is that it looks like the query plan assets are much higher DPI than the ones in SSMS, but… I still can’t picture using it every day just yet.
There’s some key stuff missing, like being able to hide query results, and plan operators don’t show parallelism yet. While I hear that a lot of improvements are on the to-do list, between whatever is going on internally along with the GitHub backlog, I have no idea what the timeline is for them.
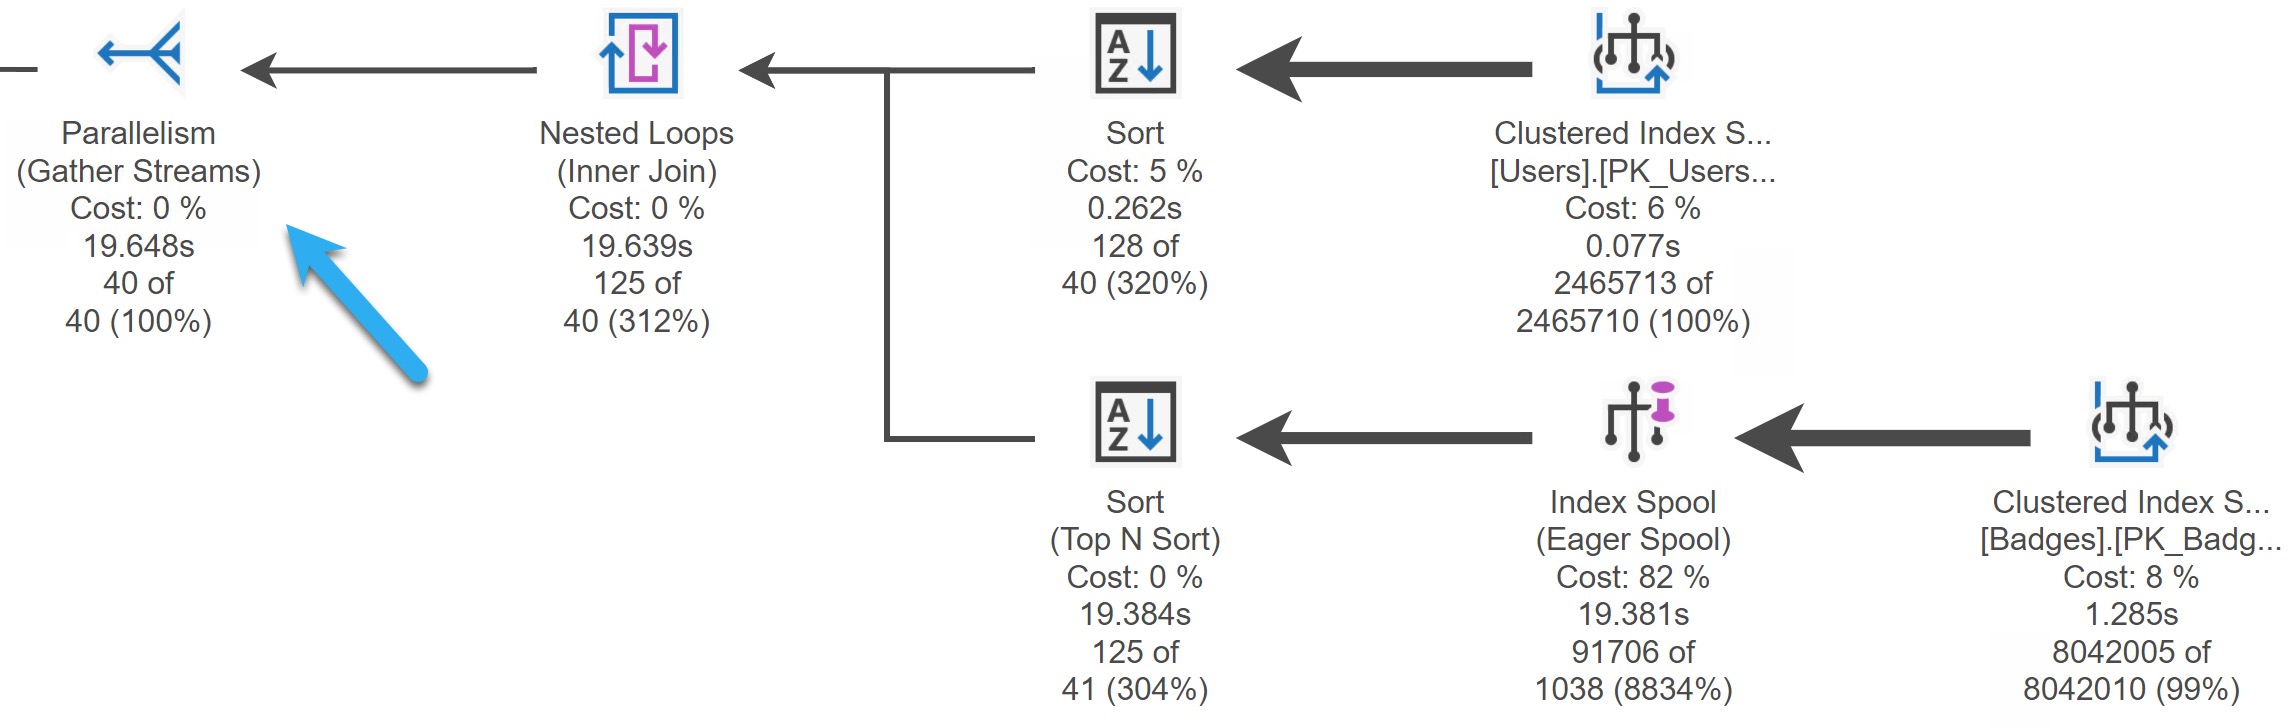
A Query Plan In Azure Data Studio
If you enable the workbench editor enable preview setting, you can hit CTRL+M to get an actual execution plan. Here’s what it looks like:
clean and shiny
The arrow is just to point out the the plan does have parallelism engaged, but it is not shown anywhere (yet, I know, I know).
It is cool that you can get the full properties of any of the operators, and that operator times are consistent with what SSMS shows. Also, I like the highly accusatory, Snag-It style arrows here.
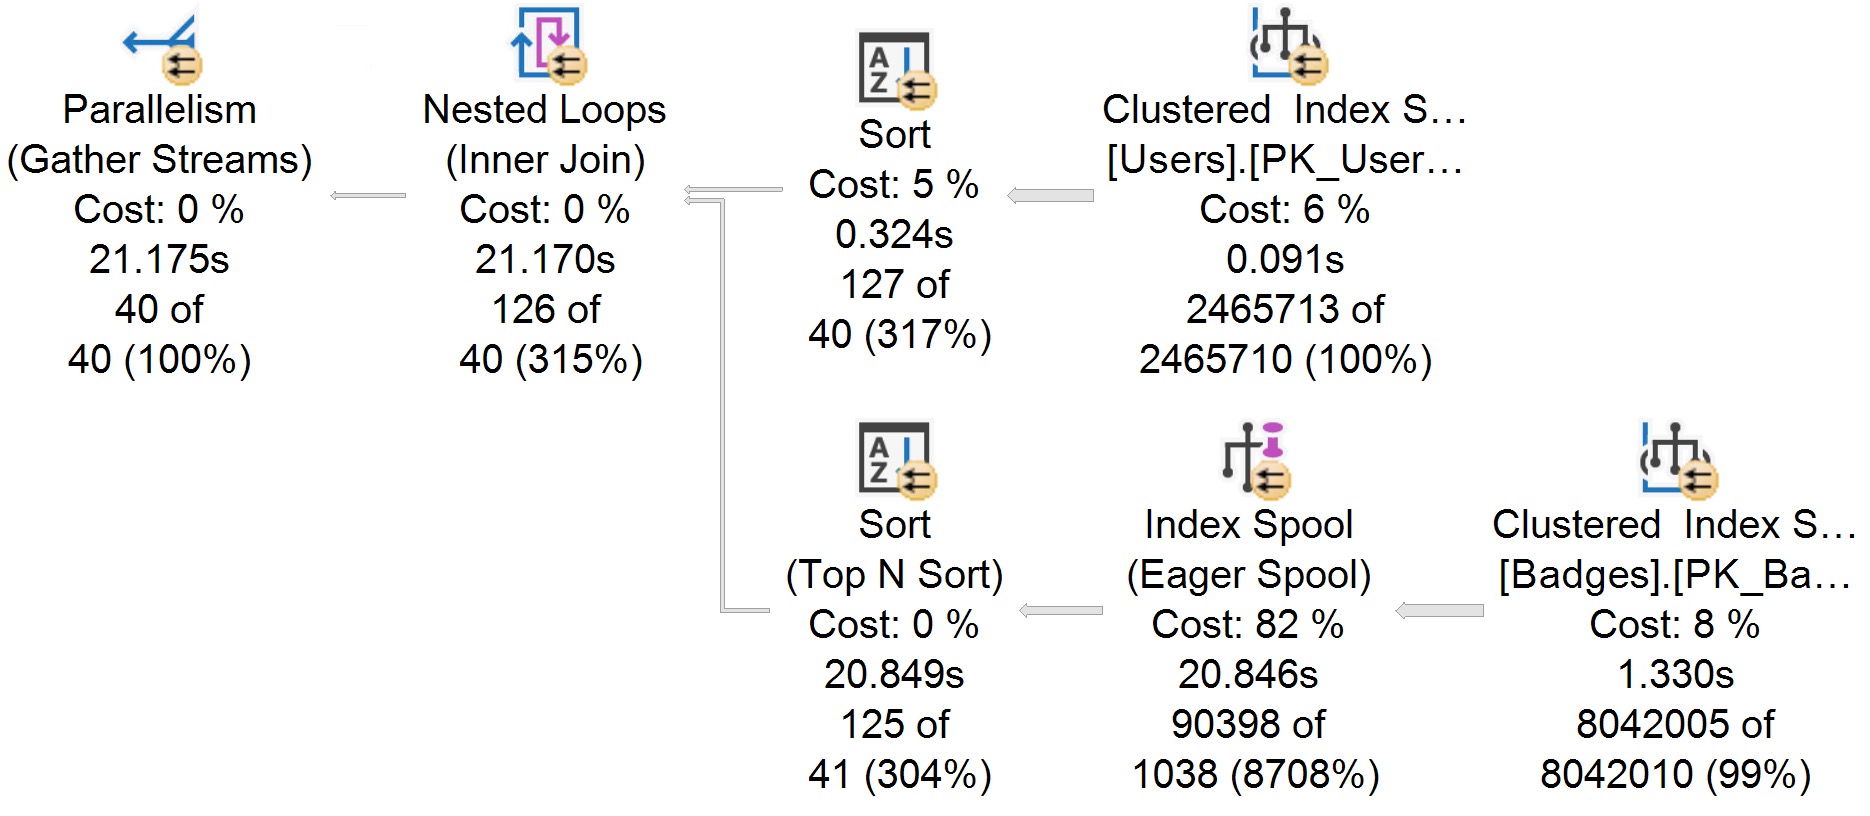
The Same Plan In SSMS
I recently changed the font that my query plans use to one that’s a bit less offensive. The only point here is that in this plan you can see parallelism more easily, and maybe that the operator icons aren’t quite as spiffy.
nice font
Aside from slight variations in CPU timing, the plans are virtually identical. Good!
Kind of.
Six Different Ways
My criticisms of how query plans are displayed are somewhat nit-picky, and I’d even wager that some people might disagree with me on how things should show up.
For example, i think it’s quite confusing that batch mode operators track time differently than row mode operators, and that there’s no real visual indication as to which operators use batch mode. I also very much dislike that in both the ADS and SSMS plans, the index operation is cut off. “Clustered Index S…” doesn’t help anyone.
I’d also find it useful to have an I/O rollup in the root node, where other Query Time Statistics are. But hey.
When you get deeper into things, stuff like a visual indicator of how many times an operator executed, and missing index requests for Eager Index Spools would be nice, too.
Anyway, I’m still not the target audience for ADS (at least so far as I can tell), and I’ll be sticking with SSMS for now, but this is a very nice addition for folks who ADS is more useful for.
Thanks for reading!
Going Further
If this is the kind of SQL Server stuff you love learning about, you’ll love my training. I’m offering a 75% discount to my blog readers if you click from here. I’m also available for consulting if you just don’t have time for that and need to solve performance problems quickly.
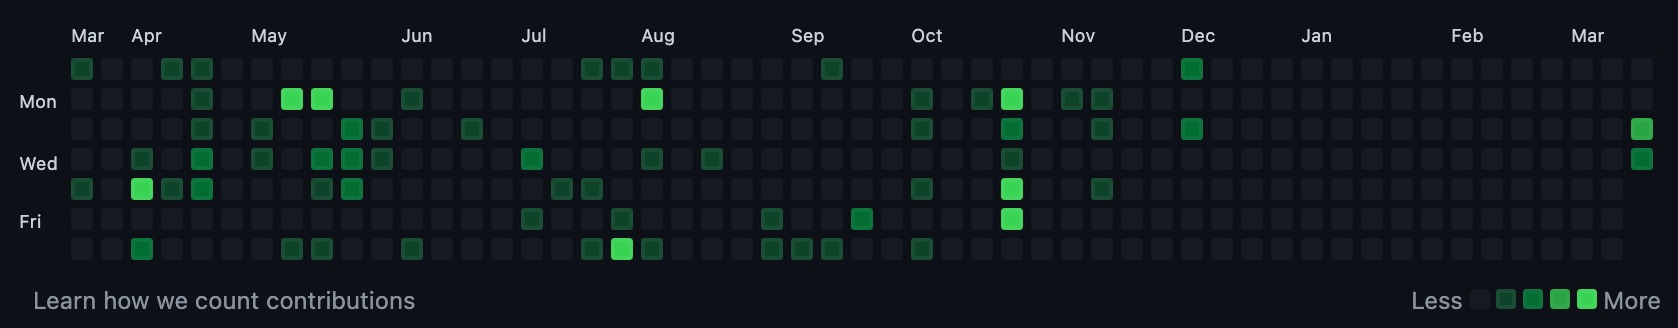
GitHub had been making me feel guilty about taking some time off over the holidays to not monkey about with T-SQL, and since my brain finally seems to be working after a hectic travel schedule, I decided to tweak a few things in sp_PressureDetector.
Paris, Cali, Cabo, London
What’d I change? Great question! There’s a preview in yesterday’s post, but here’s the change log:
Formatting, of course
Clarify memory rollup column names
Add a section with wait stats overview for related cpu/memory/disk waits
Add query text column to memory grant results
Make query txt columns xml clickables
Rearranged columns for readability and consistency
Added a couple comments to clarify code intent
Add Max Server Memory to the total/available/granted line
If this is the kind of SQL Server stuff you love learning about, you’ll love my training. I’m offering a 75% discount to my blog readers if you click from here. I’m also available for consulting if you just don’t have time for that and need to solve performance problems quickly.
Memory is S-Tier crucial for most workloads to run reliably fast. It’s where SQL Server caches data pages, and it’s what it gives to queries to process Sorts and Hashes (among other things, but these are most common).
Without it, those two things, and many other caches, would be forced to live on disk. Horrible, slow disk. Talk about a good way to make databases less popular, eh?
With no offense to the SAN administrators of the world, I consider it my sworn duty to have databases avoid your domain as much as possible.
In this post, we’ll talk about how to figure out if your SQL Server needs more memory, and if there’s anything you can do to make better use of memory at the same time.
After all, you could be doing just fine.
(You’re probably not.)
Tale Of The Wait Stats
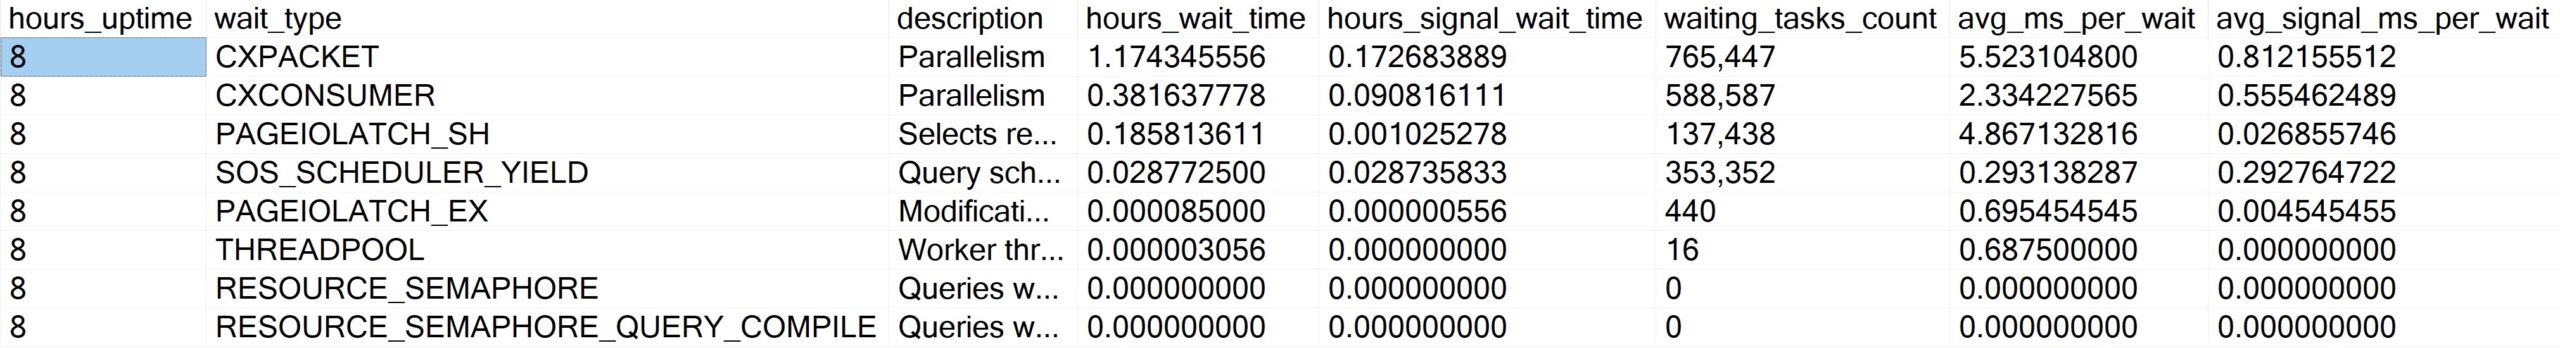
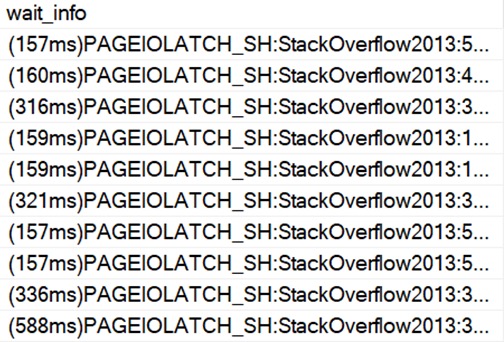
You can look at wait stats related to memory and query performance by running sp_PressureDetector.
It’ll give you some details about wait stats that relate to CPU and memory pressure. You wanna pay attention to the memory and disk waits, here. I had to squish it a little, but if you’re unfamiliar you can use the “description” column to better understand which ones to pay attention to.
Some important metrics to note here:
How do wait times relate to server uptime?
How long on average do we wait on each of these?
This won’t tell the whole story, of course, but it is a reasonable data point to start with. If your workload isn’t a 24×7 slog, though, you might need to spend more time analyzing waits for queries as they run.
In this example, it’s my local SQL instance, so it hasn’t been doing much work since I restarted it. Sometimes, you gotta look at what queries that are currently running are waiting on.
For that, go grab sp_WhoIsActive. If you see queries constantly waiting on stuff like this, it might be a sign you need more memory, because you have to keep going out to disk to get what queries need to use.
telling myself
It could also be a sign of other things, like queries and indexes that need tuning, but if it’s sustained like this then that’s not entirely likely.
It’s much more likely a memory deficiency, but it’s up to you to investigate further on your system.
How Is SQL Server Using Memory Now?
Current memory utilization can be a good way to find out if other things are using memory and taking valuable space away from your buffer pool.
A lot of folks out there don’t realize how many different things SQL Server has to share memory across.
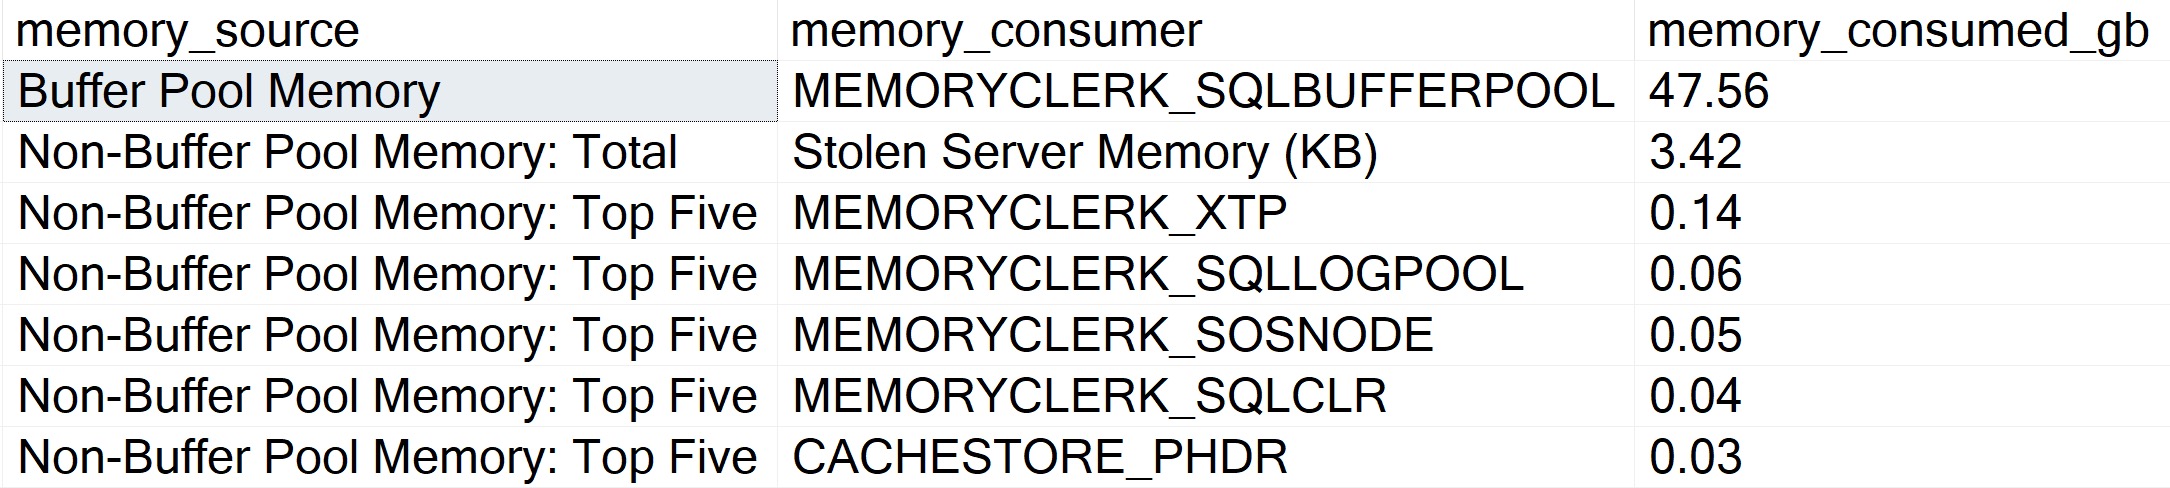
And, hey, yeah, sp_PressureDetector will show you that, too. Here’s a “normal” run:
SQL Server’s buffer pool is uninfringed upon by other consumers! Great. But sometimes queries ask for memory grants, and that’s where things can get perilous.
i feel good
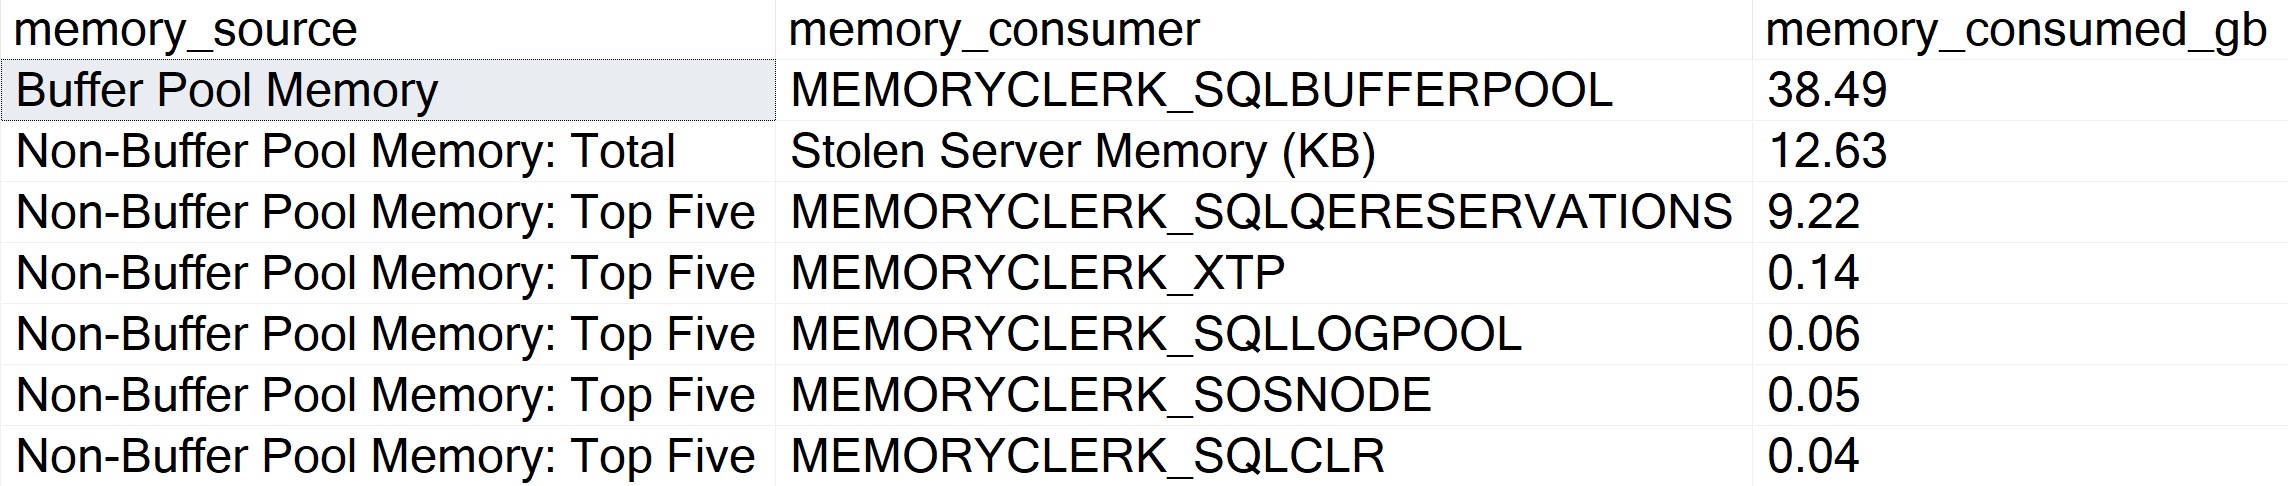
You may sometimes see Ye Olde First Memory Bank Of Motherboard loan out a swath to one or more queries:
dramarama
The difference here? The buffer pool is reduced by ~9GB to accommodate a query memory grant.
sp_PressureDetector will show you the queries doing that, too, along with query plans.
everyone is gone
It’ll also show you memory available in resource pools for granting out to queries. On this server, Max Server Memory is set to 50GB.
If you’re shocked that SQL Server is willing to give out 37GB of that to query memory grants, you haven’t been hanging around SQL Server long enough.
Then there’s a pretty good chance that it does, especially if data just plain outpaces memory by a good margin (like 3:1 or 4:1 or more).
You also have some options for making better use of your current memory, too.
Check critical queries for indexing opportunities (there may not always be a missing index request, but seasoned query tuners can spot ones the optimizer doesn’t)
Apply PAGE compression to existing row store indexes to make them smaller on disk and in memory
Check the plan cache for queries asking for large memory grants, but not using all of what’s granted to them
You can check the plan cache using a query like this. It’ll look for queries that ask for over 5GB of memory, and don’t use over 1GB of it.
WITH
    unused AS
(
    SELECT TOP (100)
        oldest_plan =
            MIN(deqs.creation_time) OVER(),
        newest_plan =
            MAX(deqs.creation_time) OVER(),
        deqs.statement_start_offset,
        deqs.statement_end_offset,
        deqs.plan_handle,
        deqs.execution_count,
        deqs.max_grant_kb,
        deqs.max_used_grant_kb,
        unused_grant =
            deqs.max_grant_kb - deqs.max_used_grant_kb,
        deqs.min_spills,
        deqs.max_spills
    FROM sys.dm_exec_query_stats AS deqs
    WHERE (deqs.max_grant_kb - deqs.max_used_grant_kb) > 1024.
    AND   deqs.max_grant_kb > 5242880.
    ORDER BY unused_grant DESC
)
SELECT
    plan_cache_age_hours =
        DATEDIFF
        (
            HOUR,
            u.oldest_plan,
            u.newest_plan
        ),
    query_text =
        (
            SELECT [processing-instruction(query)] =
                SUBSTRING
                (
                    dest.text,
                    ( u.statement_start_offset / 2 ) + 1,
                    (
                        (
                            CASE u.statement_end_offset
                                 WHEN -1
                                 THEN DATALENGTH(dest.text)
                                 ELSE u.statement_end_offset
                            END - u.statement_start_offset
                        ) / 2
                    ) + 1
                )
                FOR XML PATH(''),
                    TYPE
        ),
    deqp.query_plan,
    u.execution_count,
    u.max_grant_kb,
    u.max_used_grant_kb,
    u.min_spills,
    u.max_spills,
    u.unused_grant
FROM unused AS u
OUTER APPLY sys.dm_exec_sql_text(u.plan_handle) AS dest
OUTER APPLY sys.dm_exec_query_plan(u.plan_handle) AS deqp
ORDER BY u.unused_grant DESC
OPTION (RECOMPILE, MAXDOP 1);
This will get you the top (up to!) 100 plans in the cache that have an unused memory grant, ordered by the largest difference between grant and usage.
What you wanna pay attention to here:
How old the plan cache is: if it’s not very old, you’re not getting the full picture
How big the memory grants are: by default, the max is ~25% of max server memory
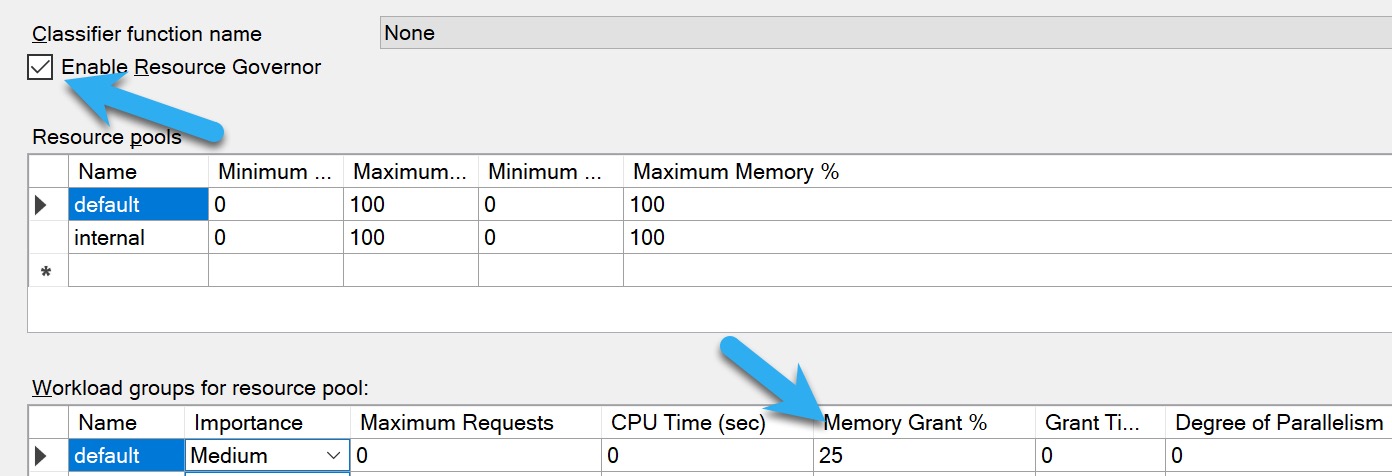
Controlling Memory Grants
If you’re looking for ways to control memory grants that doesn’t involved a bunch of query and index tuning, you have a few options:
Resource Governor: Enterprise Edition only, and usually applies to the whole workload
MIN_GRANT_PERCENT and MAX_GRANT_PERCENT query hints: You usually wanna use both to set a proper memory grant, just setting an upper level isn’t always helpful
Batch Mode Memory Grant Feedback: Requires Batch Mode/Columnstore, only helps queries between executions, usually takes a few tries to get right
For Resource Governor, you’ll wanna do some analysis using the query in the previous section to see what a generally safe upper limit for memory grants is. The more memory you have, and the higher your max server memory is, the more insane 25% is.
signs and numbers
Again, just be cautious here. If you change this setting based on a not-very-old plan cache, you’re not gonna have a clear pictures of which queries use memory, and how much they use. If you’re wondering why I’m not telling you to use Query Store for this, it’s because it only logs how much memory queries used, not how much they asked for. It’s pretty ridiculous.
After you make a change like this, or start using those query hints, you’ll wanna do some additional analysis to figure out if queries are spilling to disk. You can change the query above to something like this to look at those:
WITH
    unused AS
(
    SELECT TOP (100)
        oldest_plan =
            MIN(deqs.creation_time) OVER(),
        newest_plan =
            MAX(deqs.creation_time) OVER(),
        deqs.statement_start_offset,
        deqs.statement_end_offset,
        deqs.plan_handle,
        deqs.execution_count,
        deqs.max_grant_kb,
        deqs.max_used_grant_kb,
        unused_grant =
            deqs.max_grant_kb - deqs.max_used_grant_kb,
        deqs.min_spills,
        deqs.max_spills
    FROM sys.dm_exec_query_stats AS deqs
    WHERE deqs.min_spills > (128. * 1024.)
    ORDER BY deqs.max_spills DESC
)
SELECT
    plan_cache_age_hours =
        DATEDIFF
        (
            HOUR,
            u.oldest_plan,
            u.newest_plan
        ),
    query_text =
        (
            SELECT [processing-instruction(query)] =
                SUBSTRING
                (
                    dest.text,
                    ( u.statement_start_offset / 2 ) + 1,
                    (
                        (
                            CASE u.statement_end_offset
                                 WHEN -1
                                 THEN DATALENGTH(dest.text)
                                 ELSE u.statement_end_offset
                            END - u.statement_start_offset
                        ) / 2
                    ) + 1
                )
                FOR XML PATH(''),
                    TYPE
        ),
    deqp.query_plan,
    u.execution_count,
    u.max_grant_kb,
    u.max_used_grant_kb,
    u.min_spills,
    u.max_spills,
    u.unused_grant
FROM unused AS u
OUTER APPLY sys.dm_exec_sql_text(u.plan_handle) AS dest
OUTER APPLY sys.dm_exec_query_plan(u.plan_handle) AS deqp
ORDER BY u.max_spills DESC
OPTION (RECOMPILE, MAXDOP 1);
Small spills aren’t a big deal here, but you’ll definitely wanna pay attention to larger ones. This is set to find ones that are over 1GB, which is still pretty small, but could be meaningful.
If you notice a lot more queries spilling in a substantial way, you may have capped the high end of query memory grants too low.
Recap
Memory is something that I see people struggle to right-size, forecast, and understand the physics of in SQL Server. The worst part is that hardly anything in this post applies to Standard Edition, which is basically dead to me.
The cap for the buffer pool is 128GB, but you can use memory over that for other stuff
The main things to keep an eye on are:
Wait stats overall, and for running queries
Large unused memory grants in the plan cache
Size of data compared to size of memory
If you need help with this sort of thing, hit the link below to drop me a line about consulting.
Thanks for reading!
Going Further
If this is the kind of SQL Server stuff you love learning about, you’ll love my training. I’m offering a 75% discount to my blog readers if you click from here. I’m also available for consulting if you just don’t have time for that and need to solve performance problems quickly.
When I first started selling training videos, I tried out Shopify because it was highly recommended, seemed great at e-commerce, and offered an easy way for me to let folks buy inexpensive SQL Server training videos.
And you know what? It does all that stuff nicely, but I found it hard to incorporate other things easily.
Live training
Distributing slides and demos
Quizzes
Progress charts
Not that a lot of folks were asking for it, but it’s all stuff that seems nice to have when you’re trying to keep learners engaged.
As soon as I start getting other stuff set up, and figure out how to get past customers migrated, I’ll send out more official emails to let folks know to head to the new site.
In the meantime, thanks for all your support over the past couple years. I’m definitely looking forward to using a platform that’s friendlier for teaching, and not just selling.
Thanks for reading!
Going Further
If this is the kind of SQL Server stuff you love learning about, you’ll love my training. I’m offering a 75% discount to my blog readers if you click from here. I’m also available for consulting if you just don’t have time for that and need to solve performance problems quickly.
I’m a really big fan of using operator properties for a lot of things, at least visually. Where things sort of fall down for that is copying and pasting things out.
For some stuff, you still need to head down to the XML.
Let’s say you have a stored procedure that accepts a bunch of parameters. The rest of this one isn’t important, but here you go:
CREATE OR ALTER PROCEDURE
    dbo.AwesomeSearchProcedure
(
    @OwnerUserId int = NULL,
    @CreationDate datetime = NULL,
    @LastActivityDate datetime = NULL,
    @PostTypeId int = NULL,
    @Score int = NULL,
    @Title nvarchar(250) = NULL,
    @Body nvarchar(MAX) = NULL
)
A Plan Appears
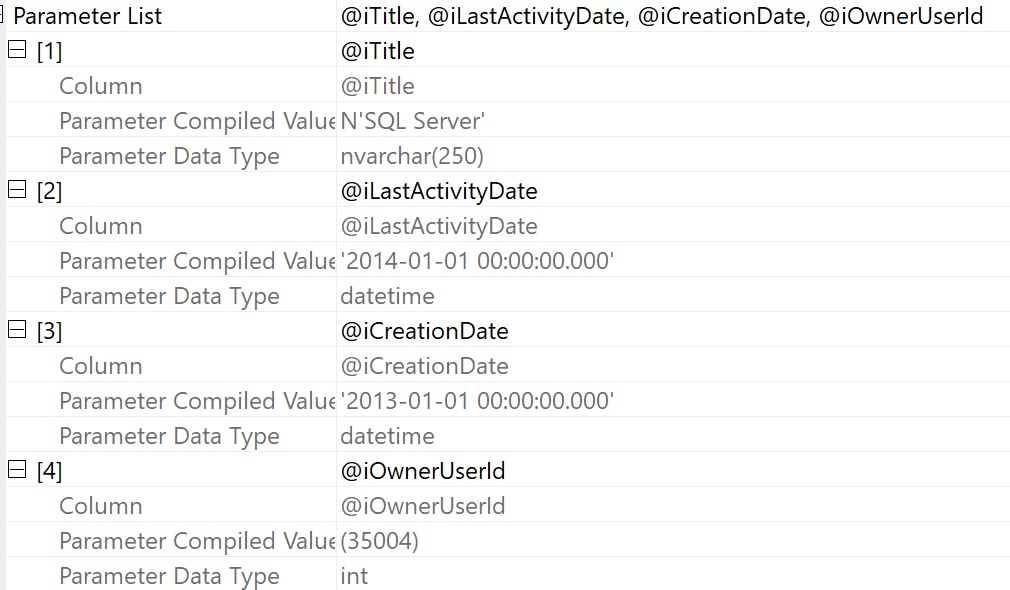
Let’s say we grab a query plan for this thing from the plan cache or query store. We can get the properties of the select operator and see compile time values:
Again — nice visually — but it doesn’t do much for us if we want to recreate executing the stored procedure to get an actual execution plan.
It’s also not terrible helpful if we want to simulate a parameter sniffing situation, because we only have the compile time values, not the run time values.
Bummer. But whatever.
XML Time!
If we right click and select “show execution plan XML”, we can scroll way down to the bottom to find the XML fragment that holds what the properties display:
This still isn’t awesome, because we have to do some surgery on the XML itself to get values out.
It’s even worse if we have a parameterized application query, because not only do we need to make a DECLARE to assign values to these variables but we need to turn the query itself into dynamic SQL.
For most things, I absolutely adore using operator properties. For some things, you still need the XML.
It’d be nice if there were some fancy copy and paste magic that would do that for you, but so far it doesn’t exist.
Thanks for reading!
Going Further
If this is the kind of SQL Server stuff you love learning about, you’ll love my training. I’m offering a 75% discount to my blog readers if you click from here. I’m also available for consulting if you just don’t have time for that and need to solve performance problems quickly.
I know what you’re gonna say: You’re gonna say, Erik, you can do this by setting the Maximum Memory Percent for each and every resource pool other than the internal one.
And I’ll tell you something wacky: That limits more than just total query memory grants, and all I want is an easy and straightforward way to tell SQL Server that I don’t want it to give up huge swaths of my buffer pool to query memory grants.
While the Memory Grant Percent setting makes it really easy to cap the total memory grant a single query can ask for, nothing does a singular job of controlling how much total memory queries can ask for as a whole, without also stifling other caches that contribute to Stolen Server Memory, like the plan cache. A very big thank you to LMNOP(b|t) for helping me figure that out.
The other downside is that you’d have to set that cap for each pool, and that’s exhausting. Tiresome. Easy to get wrong. It’d be a whole lot easier and cleaner to set that globally, without also nerfing a bunch of other potentially useful caches.
Thanks for reading!
Going Further
If this is the kind of SQL Server stuff you love learning about, you’ll love my training. I’m offering a 75% discount to my blog readers if you click from here. I’m also available for consulting if you just don’t have time for that and need to solve performance problems quickly.