Money Money
Video Summary
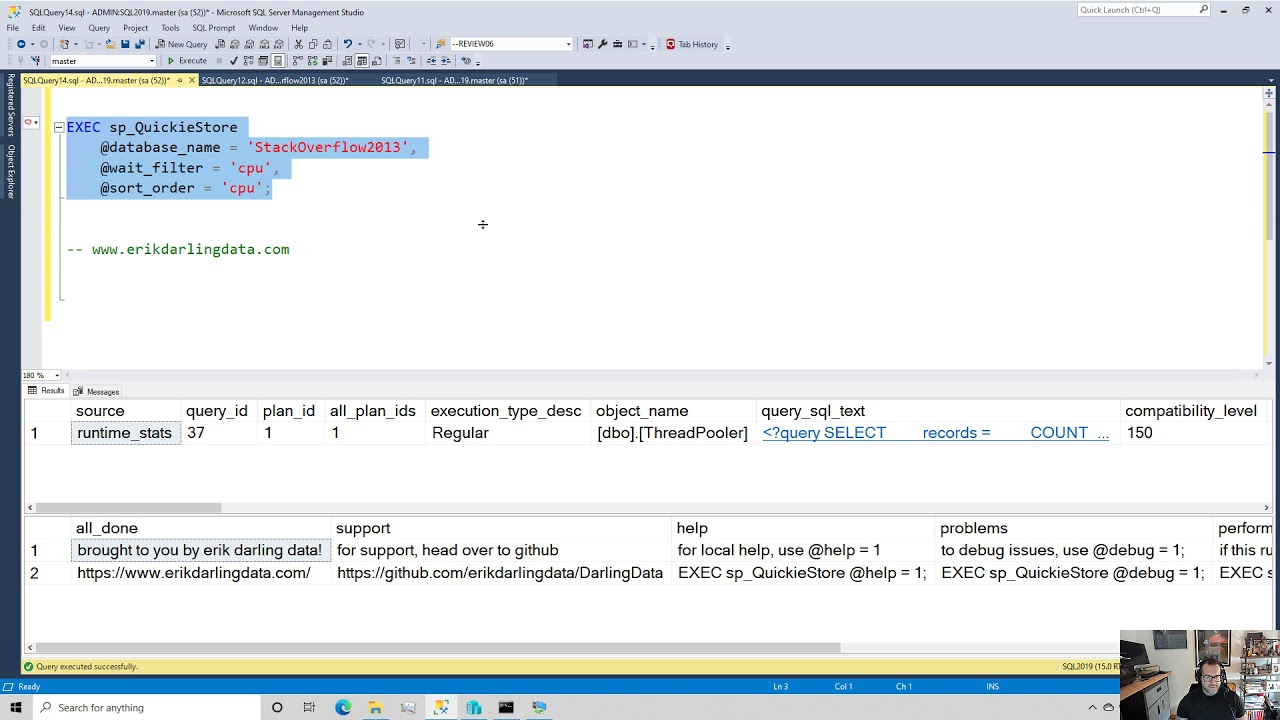
Starting with SQL Server 2017, Query Store tracks wait stats per query, so you can finally tie waits to the queries that caused them without a monitoring tool. The waits are grouped by category, such as CPU for SOS_SCHEDULER_YIELD, parallelism for the CX waits, lock waits, buffer IO for PAGEIOLATCH waits and latches for PAGELATCH waits. sp_QuickieStore can search Query Store for queries that caused a chosen wait and fills a top waits column with the average waits across executions. I have not found a good way to order by that column, so I set the sort order to the wait type. Lock waits identify victims, not the lead blocker.
Full transcript
Erik Darling here with Erik Darling Data with a short video about how you can use my wonderful, beautiful, open source stored procedure, SP underscore, quickie store, to search query store for queries that caused certain white statistics. If you head over to, if I have this curse in the right place, erikdarlingdata.com, up at the top of my website, there’s a little header that says scripts, and if you click on scripts, there’ll be three of them there. One of them will be sp_QuickieStore, and you will be able to find the GitHub download and everything else that you need there. Cool. So let’s talk a little bit about how neat of a feature this is. Now, for years, you needed to invest in a monitoring tool to get any sort of correlation between queries and wait stats. On its own, SQL Server never did a good job of putting those things together. There’s a lot of things I think that SQL Server could do a much better job of in general, where it comes to giving people views of performance and metrics on the server. But, you know, maybe that’s where that maybe that’s where all these expensive consultants and monitoring tool companies come in. I don’t know. Anyway, so what we’ve got is a lot of things that are going to be able to do.
So what we’ve got is this neat new thing that got added to query store, starting with SQL Server 2017, where it will start tracking wait stats. And more importantly, it’ll start tracking the queries that cause those wait stats. So it’s not as granular as regular query wait stats are. They’re sort of grouped together by like type, right? So you have like CPU, which is SOS scheduler yield. You have parallelism, which is the CX weights. You have, you know, like lock weights, which is all the lock weights. You have like buffer IO weights, which are all the like page waiting on page reading pages from disk into memory weights, all the page IO latch underscore weights. You have latches, but which are all the page latch weights. So there’s like they’re all kind of grouped together. They’re not as granular, but it’s still cool to have. And you can still get you can still figure out most stuff by looking at that. You know, the one thing that is, you know, I guess sort of, unfortunately incomplete is, I mean, this is true of anything, though. This is, you know, it’s like something very important to think about when you’re troubleshooting a blocking issue is that even if you know which queries caused lock weights, those are all the queries waiting. The query that caused the blocking is most likely not taking lock weights. I mean, you could get into a situation with a long blocking chain where certain queries that are waiting on locks would be blocking other stuff waiting on locks. But like at the head of it all, that lead blocker, that’s going to be the one that’s not waiting on a lock. That’s going to be the one that’s waiting on some other stuff, right?
CPU, memory, disk, latches, just completing, like getting every right log, getting everything that needs done. So that’s the one that’s going to be like the real culprit. Everything else was just sort of a victim of that lead blocker. But whatever, that’s nothing that we can really pin on query store. It’s just a limitation that you should keep in mind whenever you’re looking at queries and weight stats together. So yeah, there’s that. Anyway, so sp_QuickieStore, my free open source store procedure, lets you do let’s you search query store in a lot of ways. There’s a whole bunch of other videos in this series about how to use Quickie Store to do other things. And sort of how sp_QuickieStore works. And this one is pretty simple. Now, I recently had to clear out wait stats, or I recently had to purge out all my query store data to record a different video. So there’s not a whole lot going on in this one, unfortunately. But if we search query store for queries that caused a certain weight, what we’re going to end up with in this case is just I only have one query that’s been running in there, I had to cause a bunch of thread pool weights for a different demo. But if we look at what gets returned here, we’re going to see over in the top weights column, now this is going to be only again, only available in SQL Server 2017 plus, but you’ll see this top weights column get populated. And what it’s populated with are all the weights that this query generated. Now this is the average weights over all executions. Right? And so that’s what we’re searching on here. But it’s pretty nice to be able to figure out which query if we were looking for other stuff, you know, if we had other queries in here that cause other types of weights, we’ll be able to narrow narrow it narrow things down a little bit to there. Now. Within the top weights results set, I haven’t quite figured out a good way to order queries by this yet. I have to figure something out in there. But a workaround for now, if you also set the sort order for the type of weight that you’re searching for, if you have multiple result sets, this will still get ordered by this column over over I went too far duration, CPU, this will still be getting ordered by this column. So descending so you’ll at least get which which query caused the most weights in here, it may not be the most average weights in the top in the top weights column, but it’s better than nothing. So anyway, that’s my sort of short intro on sp_QuickieStore searching for queries that cause certain weights. I hope you enjoy it. Again, if you need to download the script, it’s over at Erik Darling data.com. Up at the top, there’s a little header that says scripts, and that will lead you to my GitHub repo where you can download and run. And as long as you’re on a version of SQL Server that supports query store, and that supports and that you have query store enabled on, you’ll be able to analyze your query store.
With sp_QuickieStore. Isn’t that lovely. And you know what, it runs a whole lot faster than the GUI does. Because I use query performance tricks. Secrets. Goodbye. where’d you go get?
0 There are no longer 0 8 9 9 9 9 9 OOM ș
More From This Series
Going Further
Someone still has to know enough SQL Server to keep the robots in check, and that’s what my training is for.