A Plan Has No Name
There are so many ways this question gets phrased.
- Why is my query sometimes slow?
- Why does restarting SQL Server make my query fast again?
- Why does clearing the plan cache fix performance?
A while back, I put together a pretty good rundown of this on the DBA Stack Exchange site.
In the plan cache, it’s really hard to tell if a query is suffering from parameter sniffing in isolation.
By that I mean, if someone sends you a cached plan that’s slow, how can you tell if it’s because of parameter sniffing?
Cached Plans Lie
Here’s a simple example with a simple index:
CREATE INDEX ix_grindr
    ON dbo.Users (CreationDate);
This query will return a couple days of data:
DECLARE @CreationDate DATETIME = '2013-12-30'
DECLARE @sql NVARCHAR(MAX) =
N'
SELECT *
FROM dbo.Users AS u
WHERE u.CreationDate >= @iCreationDate
ORDER BY u.CreationDate DESC;
'

EXEC sys.sp_executesql @sql,
                       N'@iCreationDate DATETIME',
					   @iCreationDate = @CreationDate;
GO
This query will return a year and a couple days worth of data:
DECLARE @CreationDate DATETIME = '2012-12-30'
DECLARE @sql NVARCHAR(MAX) =
N'
SELECT *
FROM dbo.Users AS u
WHERE u.CreationDate >= @iCreationDate
ORDER BY u.CreationDate DESC;
'

EXEC sys.sp_executesql @sql,
                       N'@iCreationDate DATETIME',
					   @iCreationDate = @CreationDate;
GO
Time After Time
If we run those one right after the other, the query that returns a year of data will use the query plan of the query that returns a day of data.
This is what performance tuners call “bad”.
Let’s look at the cached plan!
SELECT ds.execution_count,
       ds.min_worker_time / 1000000. AS min_worker_time_ms,
	   ds.max_worker_time / 1000000. AS max_worker_time_ms,
	   ds.min_elapsed_time / 1000000. AS min_elapsed_time_ms,
	   ds.max_elapsed_time / 1000000. AS max_elapsed_time_ms,
	   ds.min_logical_reads,
	   ds.max_logical_reads,
	   ds.min_rows,
	   ds.max_rows,
       SUBSTRING(st.text, (ds.statement_start_offset / 2) +1,
                 ((CASE ds.statement_end_offset
                       WHEN -1
				       THEN DATALENGTH(st.text)
                       ELSE ds.statement_end_offset
                   END - ds.statement_start_offset) / 2) +1) AS text,
	   dp.query_plan
FROM sys.dm_exec_query_stats AS ds
CROSS APPLY sys.dm_exec_sql_text(ds.plan_handle) AS st
CROSS APPLY sys.dm_exec_query_plan(ds.plan_handle) AS dp
WHERE st.dbid = DB_ID()
AND ds.query_plan_hash = 0x2D530BDF87345191
OPTION(RECOMPILE);
This query will go look at some details about the queries I ran.
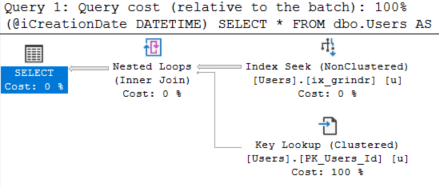
Since my code is parameterized, the cached plan for both executions looks like this:

How could this plan cause any trouble?
Metric System
The plan isn’t telling us everything, though.
Look what those other columns have to say:

We have two executions, which we knew! We ran it twice.
But the min and max for many important metrics are very different.
CPU, wall clock time, reads, rows… They all tell me that this query has wild swings in performance.
On Your Own
One simple way to go about finding queries with parameter sniffing issues might be to just look for ones with much different CPU usage.
You could easily do with this other metrics; I just like CPU as a measure of these things.
SELECT TOP (100) ds.execution_count,
       ds.min_worker_time / 1000000. AS min_worker_time_ms,
	   ds.max_worker_time / 1000000. AS max_worker_time_ms,
	   ds.min_elapsed_time / 1000000. AS min_elapsed_time_ms,
	   ds.max_elapsed_time / 1000000. AS max_elapsed_time_ms,
	   ds.min_logical_reads,
	   ds.max_logical_reads,
	   ds.min_rows,
	   ds.max_rows,
       SUBSTRING(st.text, (ds.statement_start_offset / 2) +1,
                 ((CASE ds.statement_end_offset
                       WHEN -1
				       THEN DATALENGTH(st.text)
                       ELSE ds.statement_end_offset
                   END - ds.statement_start_offset) / 2) +1) AS text,
	   dp.query_plan
FROM sys.dm_exec_query_stats AS ds
CROSS APPLY sys.dm_exec_sql_text(ds.plan_handle) AS st
CROSS APPLY sys.dm_exec_query_plan(ds.plan_handle) AS dp
WHERE st.dbid = DB_ID()
AND ds.execution_count > 1
AND (ds.min_worker_time / 1000000.) * 100. < (ds.max_worker_time / 1000000.)
ORDER BY max_worker_time_ms DESC
OPTION(RECOMPILE);
Thanks for reading!
Going Further
If this is the kind of SQL Server stuff you love learning about, you’ll love my training. I’m offering a 75% discount to my blog readers if you click from here. I’m also available for consulting if you just don’t have time for that and need to solve performance problems quickly.
Thanks for your post and the query! Just small typos in the aliases: Times in the results are s, not ms – since you divide by 1000000 🙂
Thanks, I’ll fix that!
Cool
Good idea, I haven’t though of using the DMV in that way before.