Do You Really Wanna Hurt Me?
Hi, I’m Erik. You may remember me from such hits as Make ADS An Optional Install Alongside SSMS.
While I still don’t install Azure Data Studio by default, I heard recently from Erin Stellato (t) that there’s a preview of real, live, actual execution plans out now.
Since not having query plans available was one of my chief gripes about ADS, I figured this was a good time to install it.
The pro here is that it looks like the query plan assets are much higher DPI than the ones in SSMS, but… I still can’t picture using it every day just yet.
There’s some key stuff missing, like being able to hide query results, and plan operators don’t show parallelism yet. While I hear that a lot of improvements are on the to-do list, between whatever is going on internally along with the GitHub backlog, I have no idea what the timeline is for them.
A Query Plan In Azure Data Studio
If you enable the workbench editor enable preview setting, you can hit CTRL+M to get an actual execution plan. Here’s what it looks like:

The arrow is just to point out the the plan does have parallelism engaged, but it is not shown anywhere (yet, I know, I know).
It is cool that you can get the full properties of any of the operators, and that operator times are consistent with what SSMS shows. Also, I like the highly accusatory, Snag-It style arrows here.
The Same Plan In SSMS
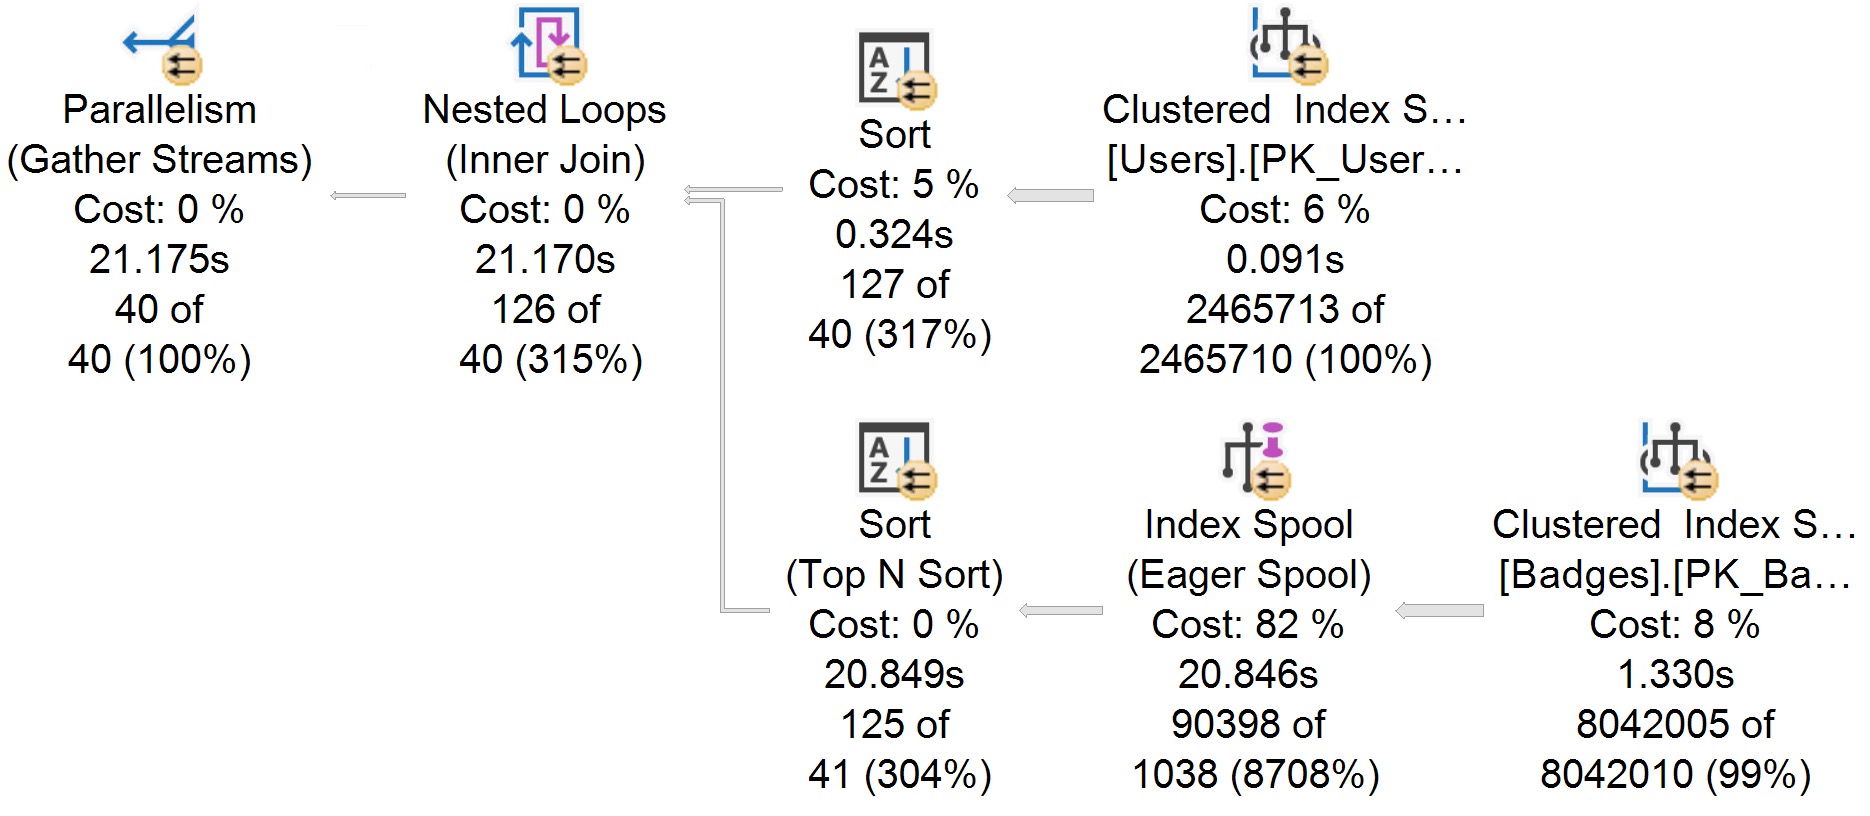
I recently changed the font that my query plans use to one that’s a bit less offensive. The only point here is that in this plan you can see parallelism more easily, and maybe that the operator icons aren’t quite as spiffy.

Aside from slight variations in CPU timing, the plans are virtually identical. Good!
Kind of.
Six Different Ways
My criticisms of how query plans are displayed are somewhat nit-picky, and I’d even wager that some people might disagree with me on how things should show up.
For example, i think it’s quite confusing that batch mode operators track time differently than row mode operators, and that there’s no real visual indication as to which operators use batch mode. I also very much dislike that in both the ADS and SSMS plans, the index operation is cut off. “Clustered Index S…” doesn’t help anyone.
I’d also find it useful to have an I/O rollup in the root node, where other Query Time Statistics are. But hey.
When you get deeper into things, stuff like a visual indicator of how many times an operator executed, and missing index requests for Eager Index Spools would be nice, too.
Anyway, I’m still not the target audience for ADS (at least so far as I can tell), and I’ll be sticking with SSMS for now, but this is a very nice addition for folks who ADS is more useful for.
Thanks for reading!
Going Further
If this is the kind of SQL Server stuff you love learning about, you’ll love my training. I’m offering a 75% discount to my blog readers if you click from here. I’m also available for consulting if you just don’t have time for that and need to solve performance problems quickly.
Hi
there’s a feedback item for adding a visual indicator for batch mode so I added my vote
https://feedback.azure.com/d365community/idea/4fbfd916-5625-ec11-b6e6-000d3a4f0da0
Nice, thanks!