WITH
    queries AS
(
    SELECT TOP (100)
        parent_object_name =
            ISNULL
            (
                OBJECT_NAME(qsq.object_id),
                'No Parent Object'
            ),
        qsqt.query_sql_text,
        query_plan =
            TRY_CAST(qsp.query_plan AS xml),
        qsrs.first_execution_time,
        qsrs.last_execution_time,
        qsrs.count_executions,
        qsrs.avg_duration,
        qsrs.avg_cpu_time,
        qsp.query_plan_hash,
        qsq.query_hash
    FROM sys.query_store_runtime_stats AS qsrs
    JOIN sys.query_store_plan AS qsp
        ON qsp.plan_id = qsrs.plan_id
    JOIN sys.query_store_query AS qsq
        ON qsq.query_id = qsp.query_id
    JOIN sys.query_store_query_text AS qsqt
        ON qsqt.query_text_id = qsq.query_text_id
    WHERE qsrs.last_execution_time >= DATEADD(DAY, -7, SYSDATETIME())
    AND   qsrs.avg_cpu_time >= (10 * 1000)
    AND   qsq.is_internal_query = 0
    AND   qsp.is_online_index_plan = 0
    ORDER BY qsrs.avg_cpu_time DESC
)
SELECT
    qs.*
FROM queries AS qs
CROSS APPLY
(
    SELECT TOP (1)
        gqs.*
    FROM sys.dm_db_missing_index_group_stats_query AS gqs
    WHERE qs.query_hash = gqs.query_hash
    AND   qs.query_plan_hash = gqs.query_plan_hash
    ORDER BY
        gqs.last_user_seek DESC,
        gqs.last_user_scan DESC
) AS gqs
ORDER BY qs.avg_cpu_time DESC
OPTION(RECOMPILE);
I don’t love this query, because I don’t love querying Query Store views. That’s why I wrote sp_QuickieStore to make it a whole lot easier.
But anyway, this will get you a similar bunch of information.
Thanks for reading!
Going Further
If this is the kind of SQL Server stuff you love learning about, you’ll love my training. I’m offering a 75% discount to my blog readers if you click from here. I’m also available for consulting if you just don’t have time for that and need to solve performance problems quickly.
I decided to expand on some scripts to look at how queries use CPU and perform reads, and found some really interesting stuff. I’ll talk through some results and how I’d approach tuning them afterwards.
Here are the queries:
/*Queries that do no logical reads, but lots of CPU work*/
SELECT TOP (100)
    total_logical_reads =
        FORMAT(qs.total_logical_reads, 'N0'),
    total_worker_time_ms =
        FORMAT(qs.total_worker_time / 1000., 'N0'),
    execution_count =
        FORMAT(qs.execution_count, 'N0'),
    query_text =
        SUBSTRING
        (
            st.text,
            qs.statement_start_offset / 2 + 1,
            CASE qs.statement_start_offset
                 WHEN -1
                 THEN DATALENGTH(st.text)
                 ELSE qs.statement_end_offset
            END - qs.statement_start_offset / 2 + 1
        ),
    qp.query_plan
FROM sys.dm_exec_query_stats AS qs
CROSS APPLY sys.dm_exec_sql_text(qs.sql_handle) AS st
CROSS APPLY sys.dm_exec_query_plan(qs.plan_handle) AS qp
WHERE qs.total_logical_reads = 0
AND   qs.total_worker_time > 5000
ORDER BY qs.total_worker_time DESC;

/*Queries that do 2x more reads than CPU work*/
SELECT TOP (100)
    total_logical_reads =
        FORMAT(qs.total_logical_reads, 'N0'),
    total_worker_time_ms =
        FORMAT(qs.total_worker_time / 1000., 'N0'),
    execution_count =
        FORMAT(qs.execution_count, 'N0'),
    query_text =
        SUBSTRING
        (
            st.text,
            qs.statement_start_offset / 2 + 1,
            CASE qs.statement_start_offset
                 WHEN -1
                 THEN DATALENGTH(st.text)
                 ELSE qs.statement_end_offset
            END - qs.statement_start_offset / 2 + 1
        ),
    qp.query_plan
FROM sys.dm_exec_query_stats AS qs
CROSS APPLY sys.dm_exec_sql_text(qs.sql_handle) AS st
CROSS APPLY sys.dm_exec_query_plan(qs.plan_handle) AS qp
WHERE qs.total_logical_reads > (qs.total_worker_time * 2)
ORDER BY qs.total_logical_reads DESC;

/*Queries that do 4x more CPU work than reads*/
SELECT TOP (100)
    total_logical_reads =
        FORMAT(qs.total_logical_reads, 'N0'),
    total_worker_time_ms =
        FORMAT(qs.total_worker_time / 1000., 'N0'),
    execution_count =
        FORMAT(qs.execution_count, 'N0'),
    query_text =
        SUBSTRING
        (
            st.text,
            qs.statement_start_offset / 2 + 1,
            CASE qs.statement_start_offset
                 WHEN -1
                 THEN DATALENGTH(st.text)
                 ELSE qs.statement_end_offset
            END - qs.statement_start_offset / 2 + 1
        ),
    qp.query_plan
FROM sys.dm_exec_query_stats AS qs
CROSS APPLY sys.dm_exec_sql_text(qs.sql_handle) AS st
CROSS APPLY sys.dm_exec_query_plan(qs.plan_handle) AS qp
WHERE qs.total_worker_time > (qs.total_logical_reads * 4)
ORDER BY qs.total_worker_time DESC;
Resultant
A quick note about these is that the comparison between CPU and logical reads happens in the where clause, and I convert CPU time to milliseconds in the select list.
That might make the number look a little funny, but it makes them somewhat more easy to understand than microseconds in the grand scheme of things.
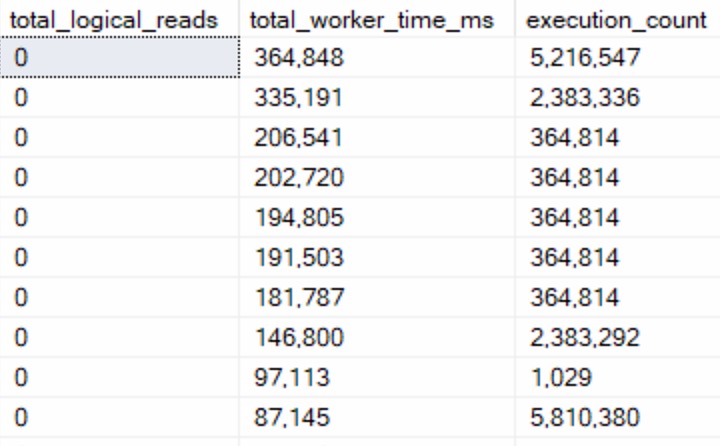
First, queries that do no logical reads but use CPU time:
ouchies
A lot of these were functions that processed input but didn’t touch data. Assembling and splitting string lists, XML, other variable assignment tasks, and occasionally DMV queries.
The “easy” button here is to stop using scalar and multi-statement functions so much. Those execution counts are hideous.
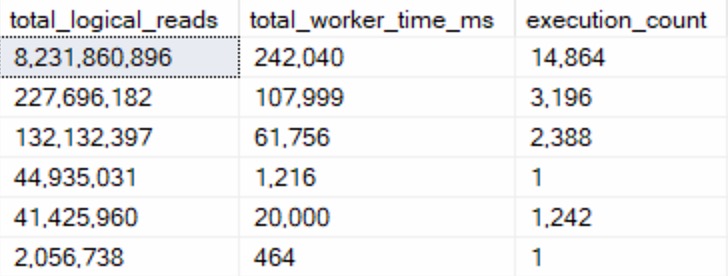
Second, queries that do 2x more reads than CPU work:
telling myself
I only found six of these, while the other two categories easily found the 100 row goal.
The queries in here largely seemed to either be:
Insert queries to temporary objects
Queries with parameter sniffing issues
Looking at these, the problem was largely the optimizer choosing Nested Loops joins when it really shouldn’t have. The worst part was that it wasn’t an indexing issue — every single one of these queries was doing seeks across the board — they were just happening in a serial plan, and happening way more than the optimizer estimated they would. Perhaps this is something that Adaptive Joins or Batch Mode more generally could have intervened in.
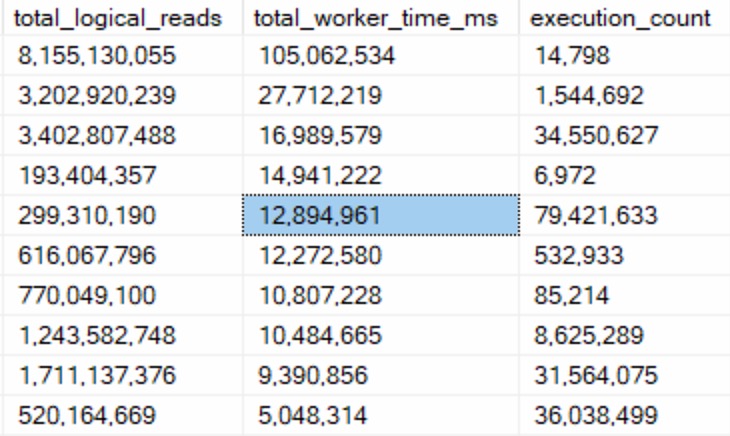
Third, queries that do 2x more CPU work than reads:
we are something
These queries were far more interesting from a tuning perspective, because there were obvious ineffiencies:
No good indexes to use
Large scans because of non-SARGable predicates
Predicate Key Lookups
But the important thing here is that these queries were able to do a lot of logical reads quickly — data they needed was already in memory — and just push the hell out of CPUs.
These are the queries you can have a field day fixing and making people happy.
Residuals
This selection of query results is why I tend to ignore logical reads and focus on CPU. I do still look at things like physical reads, and select queries that do suspicious amounts of writes.
Physical reads means going to disk, and disk is your mortal enemy
Select queries doing writes often indicate spools and spills, which can also be pretty bad
You may not like it, but this is what peak performance tuner looks like.
Thanks for reading!
Going Further
If this is the kind of SQL Server stuff you love learning about, you’ll love my training. I’m offering a 75% discount to my blog readers if you click from here. I’m also available for consulting if you just don’t have time for that and need to solve performance problems quickly.
In the quest for me trying to get people to upgrade to a not-old-and-busted version of SQL Server, this is one that I talk about a lot because it really helps folks who don’t have all the time in the world to tune queries and indexes.
Here’s a quick helper query to get you started:
SELECT TOP (50)
    query_text =
        SUBSTRING
        (
            st.text,
            qs.statement_start_offset / 2 + 1,
            CASE qs.statement_start_offset
                 WHEN -1
                 THEN DATALENGTH(st.text)
                 ELSE qs.statement_end_offset
            END - qs.statement_start_offset / 2 + 1
        ),
    qp.query_plan,
    qs.creation_time,
    qs.last_execution_time,
    qs.execution_count,
    qs.max_worker_time,
    avg_worker_time =
        (qs.total_worker_time / qs.execution_count),
    qs.max_grant_kb,
    qs.max_used_grant_kb,
    qs.total_spills
FROM sys.dm_exec_query_stats AS qs
CROSS APPLY sys.dm_exec_sql_text(qs.sql_handle) AS st
CROSS APPLY sys.dm_exec_query_plan(qs.plan_handle) AS qp
CROSS APPLY
(
    SELECT TOP (1)
        gqs.*
    FROM sys.dm_db_missing_index_group_stats_query AS gqs
    WHERE qs.query_hash = gqs.query_hash
    AND   qs.query_plan_hash = gqs.query_plan_hash
    AND   qs.sql_handle = gqs.last_sql_handle
    ORDER BY
        gqs.last_user_seek DESC,
        gqs.last_user_scan DESC
) AS gqs
ORDER BY qs.max_worker_time DESC
OPTION(RECOMPILE);
This should help you find queries that use a lot of CPU and might could oughtta use an index.
Note that this script does not assemble the missing index definition for you. That stuff is all readily available in the query plans that get returned here, and of course the missing index feature has many caveats and limitations to it.
You should, as often as possible, execute the query and collect the actual execution plan to see where the time is spent before adding anything in.
Thanks for reading!
Going Further
If this is the kind of SQL Server stuff you love learning about, you’ll love my training. I’m offering a 75% discount to my blog readers if you click from here. I’m also available for consulting if you just don’t have time for that and need to solve performance problems quickly.
There are a million scripts out there that will give you all of the missing index requests for a database (or even a whole server).
Some will even try to prioritize based on the metrics logged along with each request.
Right now, most of you get:
Uses: How many times a query compiled that could have used the index
Average Query Cost: A unit-less cost used by the optimizer for choosing a plan
Impact: A metric relative to the unit-less cost of the operator the index will help
Breaking each of those down, the only one that has a concrete meaning is Uses, but that of course doesn’t mean that a query took a long time or is even terribly inefficient.
That leaves us with Average Query Cost, which is the sum of each operator’s estimated cost in the query plan, and Impact.
But where does Impact come from?
Impactful
Let’s look at a query plan with a missing index request to figure out what the Impact metric is tied to.
Here’s the relevant part of the plan:
sticky kid
And here’s the missing index request:
/*
The Query Processor estimates that implementing the following index could improve the query cost by 16.9141%.
*/

/*
USE [StackOverflow2013]
GO
CREATE NONCLUSTERED INDEX [<Name of Missing Index, sysname,>]
ON [dbo].[Comments] ([Score])
INCLUDE ([PostId])
GO
*/
Here’s the breakdown:
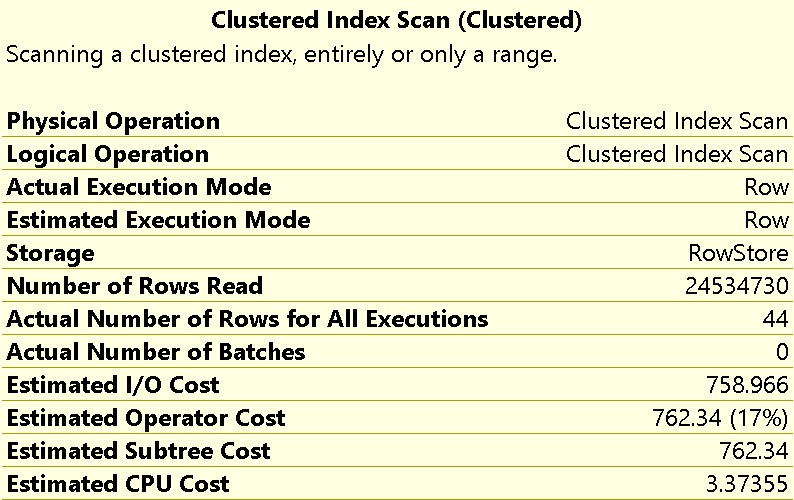
The optimizer estimates that hitting the Comments table will cost 762 query bucks, which is 17% of the total plan cost
The optimizer further estimates that hitting the Comments table with the suggested index will reduce the total plan cost by 16.9%
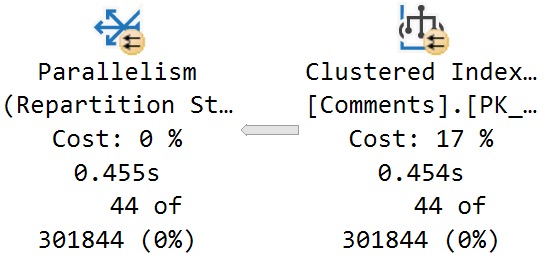
Here’s the relevant properties from the scan of the Comments table:
Indecisive
What I want you to take away from this is that, while hitting the Comments table may be 17% of the plan’s total estimated cost, the time spent scanning that index is not 17% of the plan’s total execution time, either in CPU or duration.
You can see in the screenshot above that it takes around 450ms to perform the full scan of 24,534,730 rows.
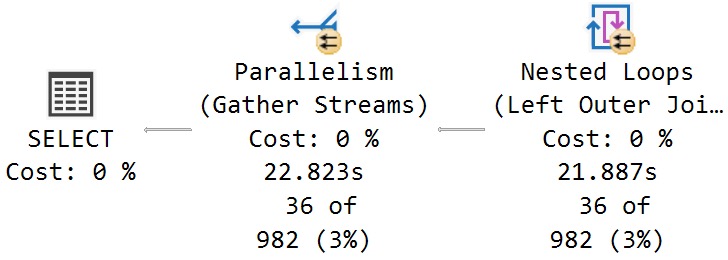
Doubtful
In full, this query runs for around 23 seconds:
outta here
The estimated cost of hitting the Comments tables is not 17% of the execution time. That time lives elsewhere, which we’ll get to.
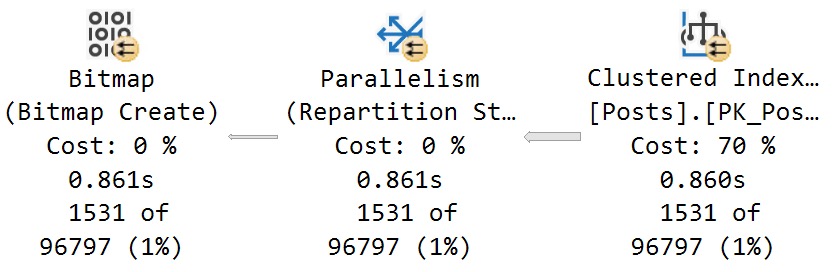
In the meantime, there are two more egregious problems to deal with:
The optimizer severely miscalculates the cost of scanning the Posts table at 70% (note the 860ms time here):
oh no no no
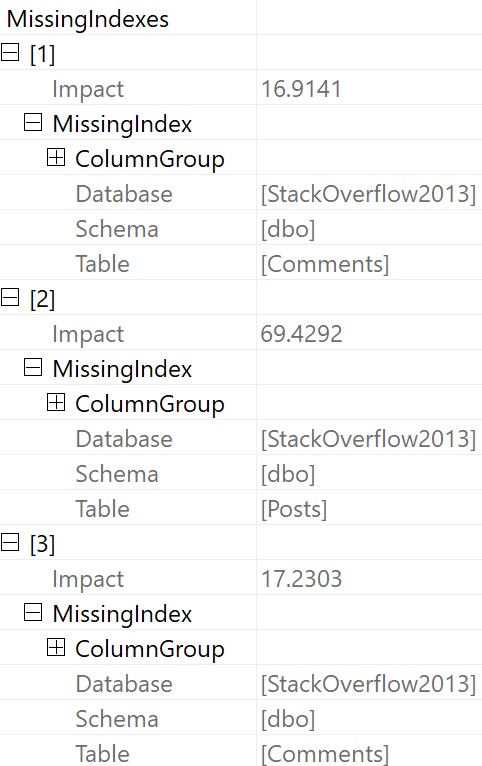
2. It buries other missing index requests in the properties of the root operator:
train tracks
Now, there are two other missing index requests listed here that are a) of higher “impact” b) not ordered by that impact number and c) even if both a and b were true, we know that adding those indexes would not substantially reduce the overall runtime of the stored procedure.
Assuming that we added every single missing index here, at best we would reduce the estimated cost of the plan by 87%, while only reducing the actual execution time of the plan by about 1.3 seconds out of 23 seconds.
Not a big win, here.
Hurtful
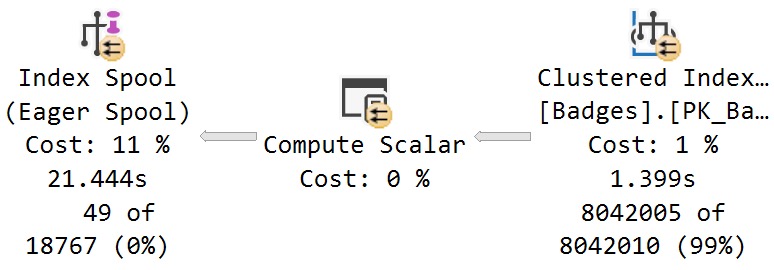
Examining where time is spent in this plan, this branch will stick out as the dominating factor:
baby don’t do it
Some interesting things to note here, while we’re talking about interesting things:
The scan of the Badges table takes 1.4 seconds, and has an estimated cost of 1%
The estimated cost of the eager index spool is 11%, but accounts for 20 seconds of elapsed time (less the 1.4 seconds for the scan of Badges)
There was no missing index request generated for the Badges table, despite the optimizer creating one on the fly
This is a bit of the danger in creating missing index requests without first validating which queries generated them, and where the benefit in having them would be.
In tomorrow’s post, we’ll look at how SQL Server 2019 makes figuring this stuff out easier.
Thanks for reading!
Going Further
If this is the kind of SQL Server stuff you love learning about, you’ll love my training. I’m offering a 75% discount to my blog readers if you click from here. I’m also available for consulting if you just don’t have time for that and need to solve performance problems quickly.
If you use this script, you can follow along with the results.
The sys.dm_exec_function_stats DMV is only available in SQL Server 2016+, so if you’re on an earlier version than that, you should focus your energies on upgrading.
I’m sure you’ve just been busy for the last five years.
/*Context is everything*/
USE master;
GO

/*Piece of crap function*/
CREATE OR ALTER FUNCTION
    dbo.useless_function(@dbid int)
RETURNS sysname
AS
BEGIN
    DECLARE /*This is to ruin scalar UDF inlining*/
        @gd datetime = GETDATE();

    RETURN DB_NAME(@dbid);
END;
GO

/*Just in the select list*/
SELECT
    database_name =
        dbo.useless_function(d.database_id),
    total_databases =
        (SELECT c = COUNT_BIG(*) FROM sys.databases AS d2)
FROM sys.databases AS d;
GO

/*Executions here should match the count above*/
SELECT
    object_name =
        OBJECT_NAME(defs.object_id),
    defs.execution_count
FROM sys.dm_exec_function_stats AS defs
WHERE defs.object_id = OBJECT_ID('dbo.useless_function');

/*Reset the counters*/
DBCC FREEPROCCACHE;
GO

/*Now in the where clause*/
SELECT
    mf.name,
    total_database_files =
        (SELECT c = COUNT_BIG(*) FROM sys.master_files AS mf2)
FROM sys.master_files AS mf
WHERE mf.name = dbo.useless_function(mf.database_id)
GO

/*Executions here should match the count above*/
SELECT
    object_name =
        OBJECT_NAME(defs.object_id),
    defs.execution_count
FROM sys.dm_exec_function_stats AS defs
WHERE defs.object_id = OBJECT_ID('dbo.useless_function');
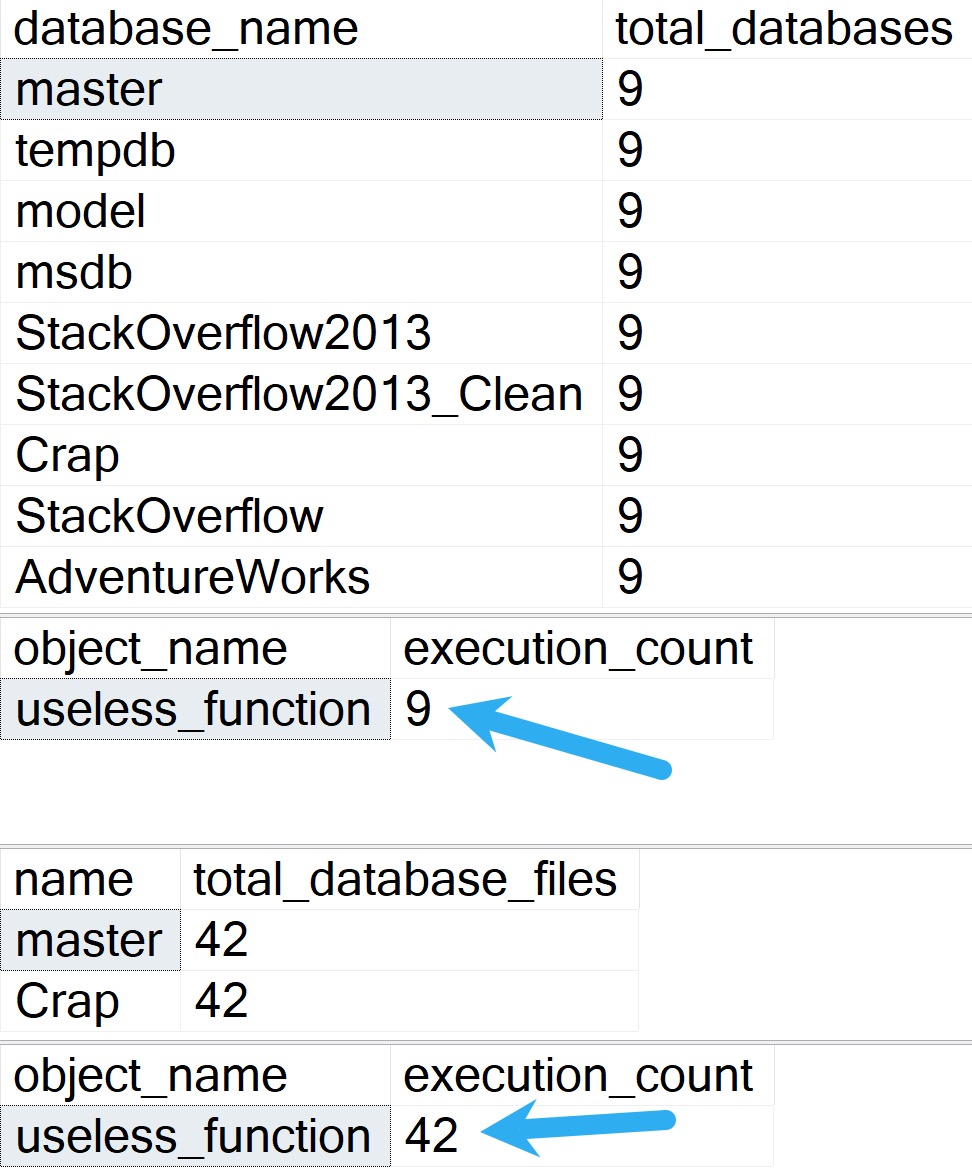
Data Driven
On my server, I have 9 total databases and 42 total database files.
The results, therefore, look precisely and consistently like so:
You Probably Won’t Like This About Functions
Assumption
For the select list, T-SQL scalar UDFs will execute once per row projected by the query, e.g. the final resulting row count, under… Every circumstance I’ve ever seen.
In SQL server. Of course.
As a couple easy-to-digest examples. Let’s say you execute a query that returns 100 rows:
Your T-SQL scalar UDF is referenced once in the select list, so it’ll run 100 times
Your T-SQL scalar UDF is referenced twice in the select list, so it’ll run 200 times
For T-SQL scalar UDFs in other parts of a query, like:
Where Clause
Join Clause
They will execute for as many rows need to be filtered when these parts of the query are executed, for as many individual references to the function as there are in the query.
The results here may vary, depending on if there are any other predicates involved that may filter out other rows.
As a couple easy-to-digest examples:
If you use a T-SQL scalar UDF as a predicate on a million row table, it’ll execute a million times to produce a result and apply the predicate
If you do the same thing as above, but there’s another part of the where clause that filters out 500k rows, the function will only execute 500k times
All sorts of other things might change this, like if the other predicate(s) can be pushed to when the data is accessed, and if there are multiple invocations of the function.
You can see an edge case where that’s not true in this post:
If this is the kind of SQL Server stuff you love learning about, you’ll love my training. I’m offering a 75% discount to my blog readers if you click from here. I’m also available for consulting if you just don’t have time for that and need to solve performance problems quickly.
The more people want to avoid fixing what’s really wrong with their server, the more they go out and find all the weird stuff that they can blame on something else (usually the product), or keep doing the same things that aren’t fixing the problem.
Spinlocks are one of those things. People will measure them, stare at them, Google them, and have no idea what to make of them, all while being sure there’s something going on with them.
I don’t want to discount when spinlocks can actually cause a problem, but you shouldn’t treat every performance problem like it’s a bridge too far from what you can solve.
Before you go ignoring all the other things that are going wrong, here’s a simple script to give you some idea if you need to follow the spinlock trail any further. Note that it might also be worth replacing the s.spins sort order with s.spins_per_collision, too.
Which sort order you choose long-term will depend on which yields numbers of interest on your system, which I can’t predict. Sorry about that.
SELECT TOP (20)
    days_uptime =
        CONVERT(decimal(38,2), d.seconds_uptime / 86400.),
    rundate =
        SYSDATETIME(),
    s.name,
    s.collisions,
    collisions_per_second =
        CONVERT(bigint, s.collisions / d.seconds_uptime),
    s.spins,
    spins_per_second =
        CONVERT(bigint, s.spins / d.seconds_uptime),
    s.spins_per_collision,
    spins_per_collision_per_second =
        CONVERT(decimal(38,6), s.spins_per_collision / d.seconds_uptime),
    s.sleep_time,
    sleep_time_per_second =
        CONVERT(bigint, s.sleep_time / d.seconds_uptime),
    s.backoffs,
    backoffs_per_second =
        CONVERT(bigint, s.backoffs / d.seconds_uptime)
FROM sys.dm_os_spinlock_stats AS s
CROSS JOIN
(
    SELECT
        seconds_uptime =
            DATEDIFF
            (
                SECOND,
                d.sqlserver_start_time,
                SYSDATETIME()
            )
    FROM sys.dm_os_sys_info AS d
) AS d
ORDER BY s.spins DESC;
Telltale
I understand that some spinlocks tend to happen in storms, and that this isn’t going to help to illuminate many situations when run in isolation. Bursty workloads, or workloads that only hit some crazy amount of spinlocks during shorter periods of high activity might escape it.
It can help you put the number of spinlocks you’re hitting in perspective compared to uptime, though.
If you see any numbers in the results that still make you say the big wow at your screen, you can easily log the output to a table every X minutes to gather more detail on when it’s happening.
Once you figure out when any potentially large spikes in spinlocks are occurring, you can match that up with:
Any independent query logging you’re doing
The plan cache, if it’s reliable
Query Store, if you’re smart enough to turn it on
Your monitoring tool data
Which should tell you which queries were executing at the time. I’d probably look for any high CPU effort queries, since those tend to be the spinlockiest in my experience.
Thanks for reading!
Going Further
If this is the kind of SQL Server stuff you love learning about, you’ll love my training. I’m offering a 75% discount to my blog readers if you click from here. I’m also available for consulting if you just don’t have time for that and need to solve performance problems quickly.
I’ve had it with presenting online, especially full-day precons. Talking to yourself for eight hours while standing in front of a camera is about as enjoyable as it sounds.
It’s a lot harder to build up rapport with the audience
There’s no social break where you get to talk to people
— Erik Darling Data (@erikdarlingdata) March 9, 2022
And there will be more MAXDOP shirts. I can’t leave my dear American friends behind.
Right On Time
This November 15-18, I’ll be presenting live and in person in Seattle at the PASS Data Community Summit. It’s available online for folks who can’t make it there in-person, too.
For a precon, I’ll be doing my world famous Blueprint Performance Tuning:
The Professional Performance Tuning Blueprint
Searching the internet for every problem isn’t cutting it. You need to be more proactive and efficient when it comes to finding and solving database performance fires.
I work with consulting customers around the world to put out SQL Server performance fires. In this day of learning, I will teach you how to find and fix your worst SQL Server problems using the same modern tools and techniques which I use every week.
You’ll learn tons of new and effective approaches to common performance problems, how to figure out what’s going on in your query plans, and how indexes really work to make your queries faster. Together, we’ll tackle query rewrites, batch mode, how to design indexes, and how to gather all the information you need to analyze performance.
This day of learning will teach you cutting edge techniques which you can’t find in training by folks who don’t spend time in the real world tuning performance. Performance tuning mysteries can easily leave you stumbling through your work week, unsure if you’re focusing on the right things. You’ll walk out of this class confident in your abilities to fix performance issues once and for all.
If you want to put out SQL Server performance fires, this is the precon you need to attend. Anyone can have a plan, it takes a professional to have a blueprint.
Regular sessions haven’t been announced yet, so keep your eyes peeled!
Hope to see you there, one way or another!
Thanks for reading!
Going Further
If this is the kind of SQL Server stuff you love learning about, you’ll love my training. I’m offering a 75% discount to my blog readers if you click from here. I’m also available for consulting if you just don’t have time for that and need to solve performance problems quickly.
If we want to start this post in the right place, we have to go back to 2009. That was the first time a (much) young(er) Erik Darling wrote dynamic SQL that didn’t suck.
There was a terrible piece of SSRS report code that used the standard catch-all pattern repeated over most of a dozen columns: (a.col = @a_parameter OR @a_parameter IS NULL)
I neither pioneered the non-sucky dynamic SQL approach, nor did I end up solving the problem entirely just by implementing non-sucky dynamic SQL. I did get things most of the way there, but every so often something bad would still happen:
At no point did I stop, take a deep breath, and just use a recompile hint on this piece of code that would run every 6-8 hours at most.
I was obsessed. I was possessed. I had to do things the right way.
But the right way didn’t always give me the best results, and I had a bad case of Egg-On-Face syndrome from swearing that I did things the right way but still ended up with a bad result.
Not all the time, but when it happened I’d get just as much guff as when things were always bad.
Goodie Howser
Good dynamic SQL and good stored procedures can suffer from the same issue: Parameter Sensitivity.
Plan A works great for Parameter A
Plan A does not work great for Parameter B
Plan B works great for Parameter B
Plan B does not work great for Parameter A
And so on. Forever. Until the dragons return. Which, you know, any day now would be great 🤌
In our quest to solve the problems with IF branching, we’ve tried a lot of things. Most of them didn’t work. Stored procedures worked for the most part, but we’ve still got a problem.
A parameter sensitivity problem.
The problem within stored procedures is a lot like the problems we saw with IF branches in general: the optimizer can’t ever pause to take a breath and make better decisions.
It would be nice if the concept of deferred name resolution had a deeper place in plan creation that would allow for deferred query optimization when IF branch boundaries are involved.
Instead, we’ll probably just keep getting different ways to work with JSON.
Looking forward to FOR YAML PATH queries, too.
Toothsome
The lovely part about dynamic SQL is that you get to construct your own query, and you can take what you know about data distributions to construct different queries.
You know all the Intelligent Query Processing and Adaptive doodads and gizmos galore that the optimizer is getting added to it? You could have been the optimizer all along.
But you were too busy rebuilding indexes and other memes that don’t bear mentioning at this late date.
We still need to write dynamic SQL the right way, but we also need to offer the optimizer a way to understand that while every parameter is created equally, not all data distributions are.
In other words, we need to give it some room to breathe.
But here I am meandering again. Let’s get on to the SQL.
Grim
I’m going to use the example from yesterday’s post to show you what you can do to further optimize queries like this.
To make the code fit in the post a little better, I’m going to skip the IF branch for the Posts table and go straight to Votes. Using dynamic SQL here will get you the same behavior at stored procedures, though.
CREATE OR ALTER PROCEDURE
    dbo.counter_if_dynamic
(
    @PostTypeId int = NULL,
    @VoteTypeId int = NULL,
    @CreationDate datetime = NULL
)
AS
SET NOCOUNT, XACT_ABORT ON;
BEGIN

DECLARE
    @sql nvarchar(4000) = N'',
    @posts_parameters nvarchar(4000) = N'@PostTypeId int, @CreationDate datetime',
    @votes_parameters nvarchar(4000) = N'@VoteTypeId int, @CreationDate datetime';

/*
    Cutting out the Posts query for brevity.
    This will behave similarly to stored procedures
    in separating the execution plan creation out.
*/

IF @VoteTypeId IS NOT NULL
BEGIN

SELECT
    @sql += N'
    /*dbo.counter_if_posts*/
    SELECT
        c = COUNT_BIG(*)
    FROM dbo.Posts AS p
    JOIN dbo.Votes AS v
        ON p.Id = v.PostId
    WHERE v.VoteTypeId = @VoteTypeId
    AND   v.CreationDate >= @CreationDate
    '
IF @VoteTypeId IN
    (2, 1, 3, 5, 10, 6, 16, 15, 11, 8)
BEGIN
    SELECT
        @sql +=
      N'AND   1 = (SELECT 1);'
END;
ELSE
BEGIN
    SELECT
        @sql +=
      N'AND   2 = (SELECT 2);'
END;

EXEC sys.sp_executesql
    @sql,
    @votes_parameters,
    @VoteTypeId,
    @CreationDate;

END;

END;
GO
I determined which values to assign to each branch by grabbing a count from the Votes table. You could theoretically automate this a bit by dumping the count into a helper table, and updating it every so often to reflect current row counts.
You’re essentially building your own histogram by doing that, which for this case makes sense because:
There’s a limited range of values to store and evaluate for an equality predicate
Getting the count is very fast, especially if you get Batch Mode involved
I basically ran the procedure with recompile hints to see at which row threshold for the VoteTypeId filter I’d tip between Nested Loops and Hash Joins, which is what bit us yesterday.
Running Wild
Let’s compare these two runs!
DBCC FREEPROCCACHE
GO
EXEC dbo.counter_if_dynamic
    @PostTypeId = NULL,
    @VoteTypeId = 7,
    @CreationDate = '20080101';
GO

EXEC dbo.counter_if_dynamic
    @PostTypeId = NULL,
    @VoteTypeId = 2,
    @CreationDate = '20080101';
GO
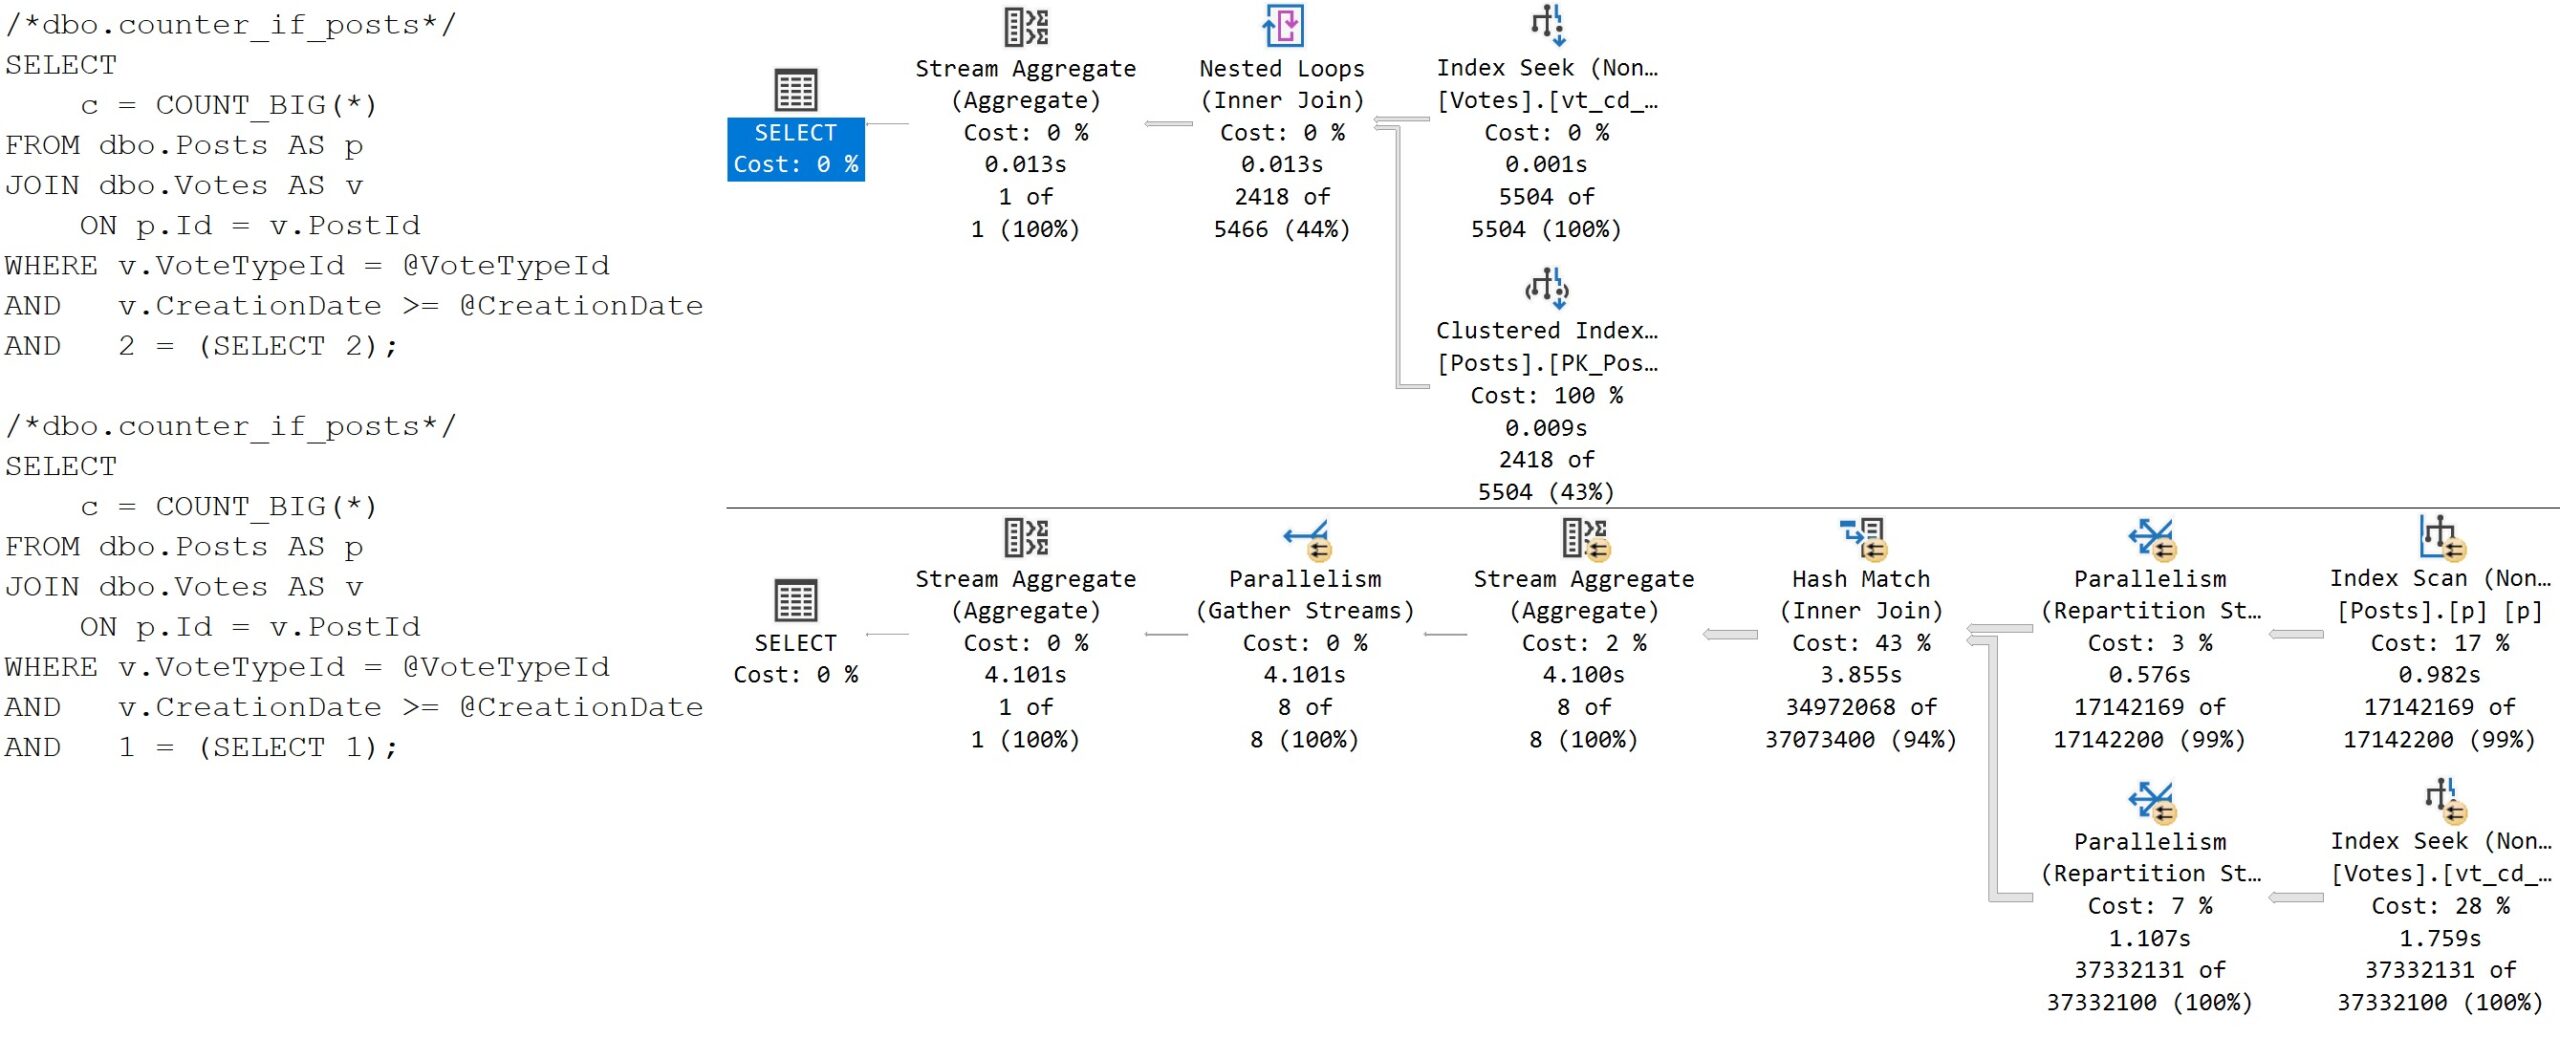
Here’s what happens:
exacto
For this example, we can consider this separation good enough.
D-Rive
Perhaps the larger point behind this series would be that multi-purpose stored procedures are a pretty bad idea. In many cases they’re completely avoidable, but in others the queries are similar-enough that grouping them into one procedure makes sense at first glance.
If you’re going to do this, you need to be prepared to provide some additional separation for each query, or at least each branch of the logic.
Stored procedures can provide a reasonable amount of shelter, but you can still encounter parameter sensitivity issues.
In the end, using parameterized dynamic SQL allows you to generate queries that are just different enough without changing the logic of the query so that the optimizer spits out different query plans for them.
Thanks for reading!
Going Further
If this is the kind of SQL Server stuff you love learning about, you’ll love my training. I’m offering a 75% discount to my blog readers if you click from here. I’m also available for consulting if you just don’t have time for that and need to solve performance problems quickly.
You know and I know and everyone knows that stored procedures are wonderful things that let you tune queries in magickal ways that stupid ORMs and ad hoc queries don’t really allow for.
Sorry about your incessant need to use lesser ways to manifest queries. They just don’t stack up.
But since we’re going to go high brow together, we need to learn how to make sure we don’t do anything to tarnish the image of our beloved stored procedures.
Like… Probably not doing most of the stuff that we talked about so far this week. We’ve seen some really bad ideas in action, which are largely only possible with stored procedures.
Giveth. Taketh.
It’s up to you.
Likened
The good news is that stored procedures help us with the problem we’ve been hitting all week, where when different IF branches are expanded, we get quality query plans for each one.
Here’s today’s setup, starting with the two procedures that we’re going to be calling from our main procedure in lieu of plain selects.
CREATE OR ALTER PROCEDURE
    dbo.counter_if_posts
(
    @PostTypeId int = NULL,
    @CreationDate datetime = NULL
)
AS
SET NOCOUNT, XACT_ABORT ON;
BEGIN

        SELECT
            c = COUNT_BIG(*)
        FROM dbo.Posts AS p
        JOIN dbo.Votes AS v
            ON p.Id = v.PostId
        WHERE p.PostTypeId = @PostTypeId
        AND   p.CreationDate >= @CreationDate;

END;
GO

CREATE OR ALTER PROCEDURE
    dbo.counter_if_votes
(
    @VoteTypeId int = NULL,
    @CreationDate datetime = NULL
)
AS
SET NOCOUNT, XACT_ABORT ON;
BEGIN

        SELECT
            c = COUNT_BIG(*)
        FROM dbo.Posts AS p
        JOIN dbo.Votes AS v
            ON p.Id = v.PostId
        WHERE v.VoteTypeId = @VoteTypeId
        AND   v.CreationDate >= @CreationDate;

END;
GO
And here’s the main calling procedure now:
CREATE OR ALTER PROCEDURE
    dbo.counter_if
(
    @PostTypeId int = NULL,
    @VoteTypeId int = NULL,
    @CreationDate datetime = NULL
)
AS
SET NOCOUNT, XACT_ABORT ON;
BEGIN

    IF @PostTypeId IS NOT NULL
    BEGIN

    EXEC dbo.counter_if_posts
        @PostTypeId = @PostTypeId,
        @CreationDate = @CreationDate;

    END;

    IF @VoteTypeId IS NOT NULL
    BEGIN

    EXEC dbo.counter_if_votes
        @VoteTypeId = @VoteTypeId,
        @CreationDate = @CreationDate;

    END;

END;
GO
In this example, I’m letting the two procedures “share” the creation date parameter for simplicity. There is almost no good reason to have a separate one.
The Plans
The good news here is that we can run queries like this back to back and get well-optimized plans for each:
DBCC FREEPROCCACHE
GO

EXEC dbo.counter_if
    @PostTypeId = 2,
    @VoteTypeId = NULL,
    @CreationDate = '20080101';
GO

EXEC dbo.counter_if
    @PostTypeId = NULL,
    @VoteTypeId = 2,
    @CreationDate = '20080101';
GO
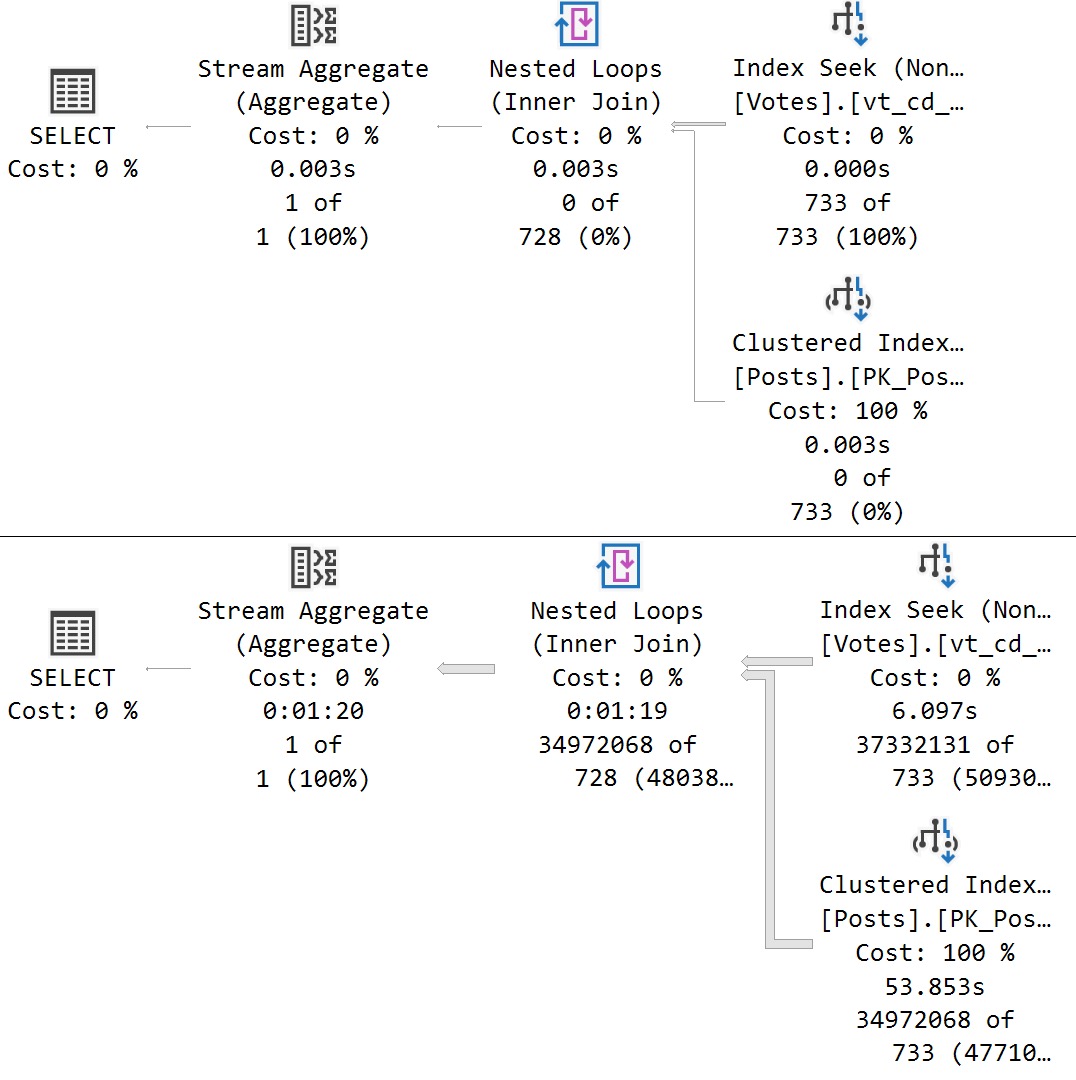
tip top
This is much happier than any of the results we’ve seen so far. The queries run quickly, have no spills, and cardinality estimation is on point.
Miced
The problem is when we do something like this, which is an actual parameter sensitivity issue. We can use this as an extreme example:
DBCC FREEPROCCACHE
GO
EXEC dbo.counter_if
    @PostTypeId = NULL,
    @VoteTypeId = 4,
    @CreationDate = '20080101';
GO

EXEC dbo.counter_if
    @PostTypeId = NULL,
    @VoteTypeId = 2,
    @CreationDate = '20080101';
GO
There are not many Vote Types of 4. There are quite a few manys of Type 2.
summation
Going from 3 milliseconds to one minute and twenty seconds is what many would consider a failure.
I would agree.
More Problem Than Problem
We’ve solved the problem of getting different individual queries to optimize well in IF branches by using stored procedures.
The different execution contexts here provide optimization fences between IF branches, but we still need to worry about parameter sensitivity for each stored procedure.
Tomorrow we’re going to look at how we can use dynamic SQL to resolve some parameter sensitivity issues.
Thanks for reading!
Going Further
If this is the kind of SQL Server stuff you love learning about, you’ll love my training. I’m offering a 75% discount to my blog readers if you click from here. I’m also available for consulting if you just don’t have time for that and need to solve performance problems quickly.
Parameters get a bad name. It seems everything that gets sniffed does, whether it’s a stored procedure, a piece of anatomy, or an illicit substance.
Once you stop worshipping memes, you’ll find that things aren’t always black and white. End results are important.
What never seems to get a bad name, despite numerical supremacy in producing terrible results, are local variables.
In this particular scenario, I see developers use them to try to beat “parameter sniffing” to no avail.
A chorus of “it seemed to work at the time”, “I think it made things a little better”, “it worked on my machine”, and all that will ensue.
But we know the truth.
Hush, Puppy
This general strategy is one that I see often enough to warrant a blog post to talk about how bad it is.
It’s a little different from yesterday, but equally misguided in its effect.
CREATE OR ALTER PROCEDURE
    dbo.counter_if
(
    @PostTypeId int = NULL,
    @VoteTypeId int = NULL,
    @CreationDate datetime = NULL
)
AS
SET NOCOUNT, XACT_ABORT ON;
BEGIN

    IF @PostTypeId IS NOT NULL
    BEGIN

        DECLARE
            @PostTypeIdCopy int = @PostTypeId,
            @CreationDatePostCopy datetime = @CreationDate;

        SELECT
            c = COUNT_BIG(*)
        FROM dbo.Posts AS p
        JOIN dbo.Votes AS v
            ON p.Id = v.PostId
        WHERE p.PostTypeId = @PostTypeIdCopy
        AND   p.CreationDate >= @CreationDatePostCopy;

    END;

    IF @VoteTypeId IS NOT NULL
    BEGIN

        DECLARE
            @VoteTypeIdCopy int = @VoteTypeId,
            @CreationDateVoteCopy datetime = @CreationDate;

        SELECT
            c = COUNT_BIG(*)
        FROM dbo.Posts AS p
        JOIN dbo.Votes AS v
            ON p.Id = v.PostId
        WHERE v.VoteTypeId = @VoteTypeIdCopy
        AND   v.CreationDate >= @CreationDateVoteCopy;

    END;

END;
In this (bad, threatening individual) display of transact SQL, we declare local copies of each parameter as a variable and then use those local copies as arguments in the queries.
There are other variations on this theme that I see from time to time, but I think that you get the point.
Cardinality Sins
What I want to show you here is related to cardinality estimation issues with the above strategy.
DBCC FREEPROCCACHE
GO
EXEC dbo.counter_if
    @PostTypeId = 8,
    @VoteTypeId = NULL,
    @CreationDate = '20080101';
GO
DBCC FREEPROCCACHE
GO
EXEC dbo.counter_if
    @PostTypeId = 2,
    @VoteTypeId = NULL,
    @CreationDate = '20080101';
GO

DBCC FREEPROCCACHE
GO
EXEC dbo.counter_if
    @PostTypeId = NULL,
    @VoteTypeId = 4,
    @CreationDate = '20080101';
GO
DBCC FREEPROCCACHE
GO
EXEC dbo.counter_if
    @PostTypeId = NULL,
    @VoteTypeId = 2,
    @CreationDate = '20080101';
GO
The point here is to execute each query with a cleared plan cache and show that cardinality estimation for both parameter values is the same value, and also completely wrong.
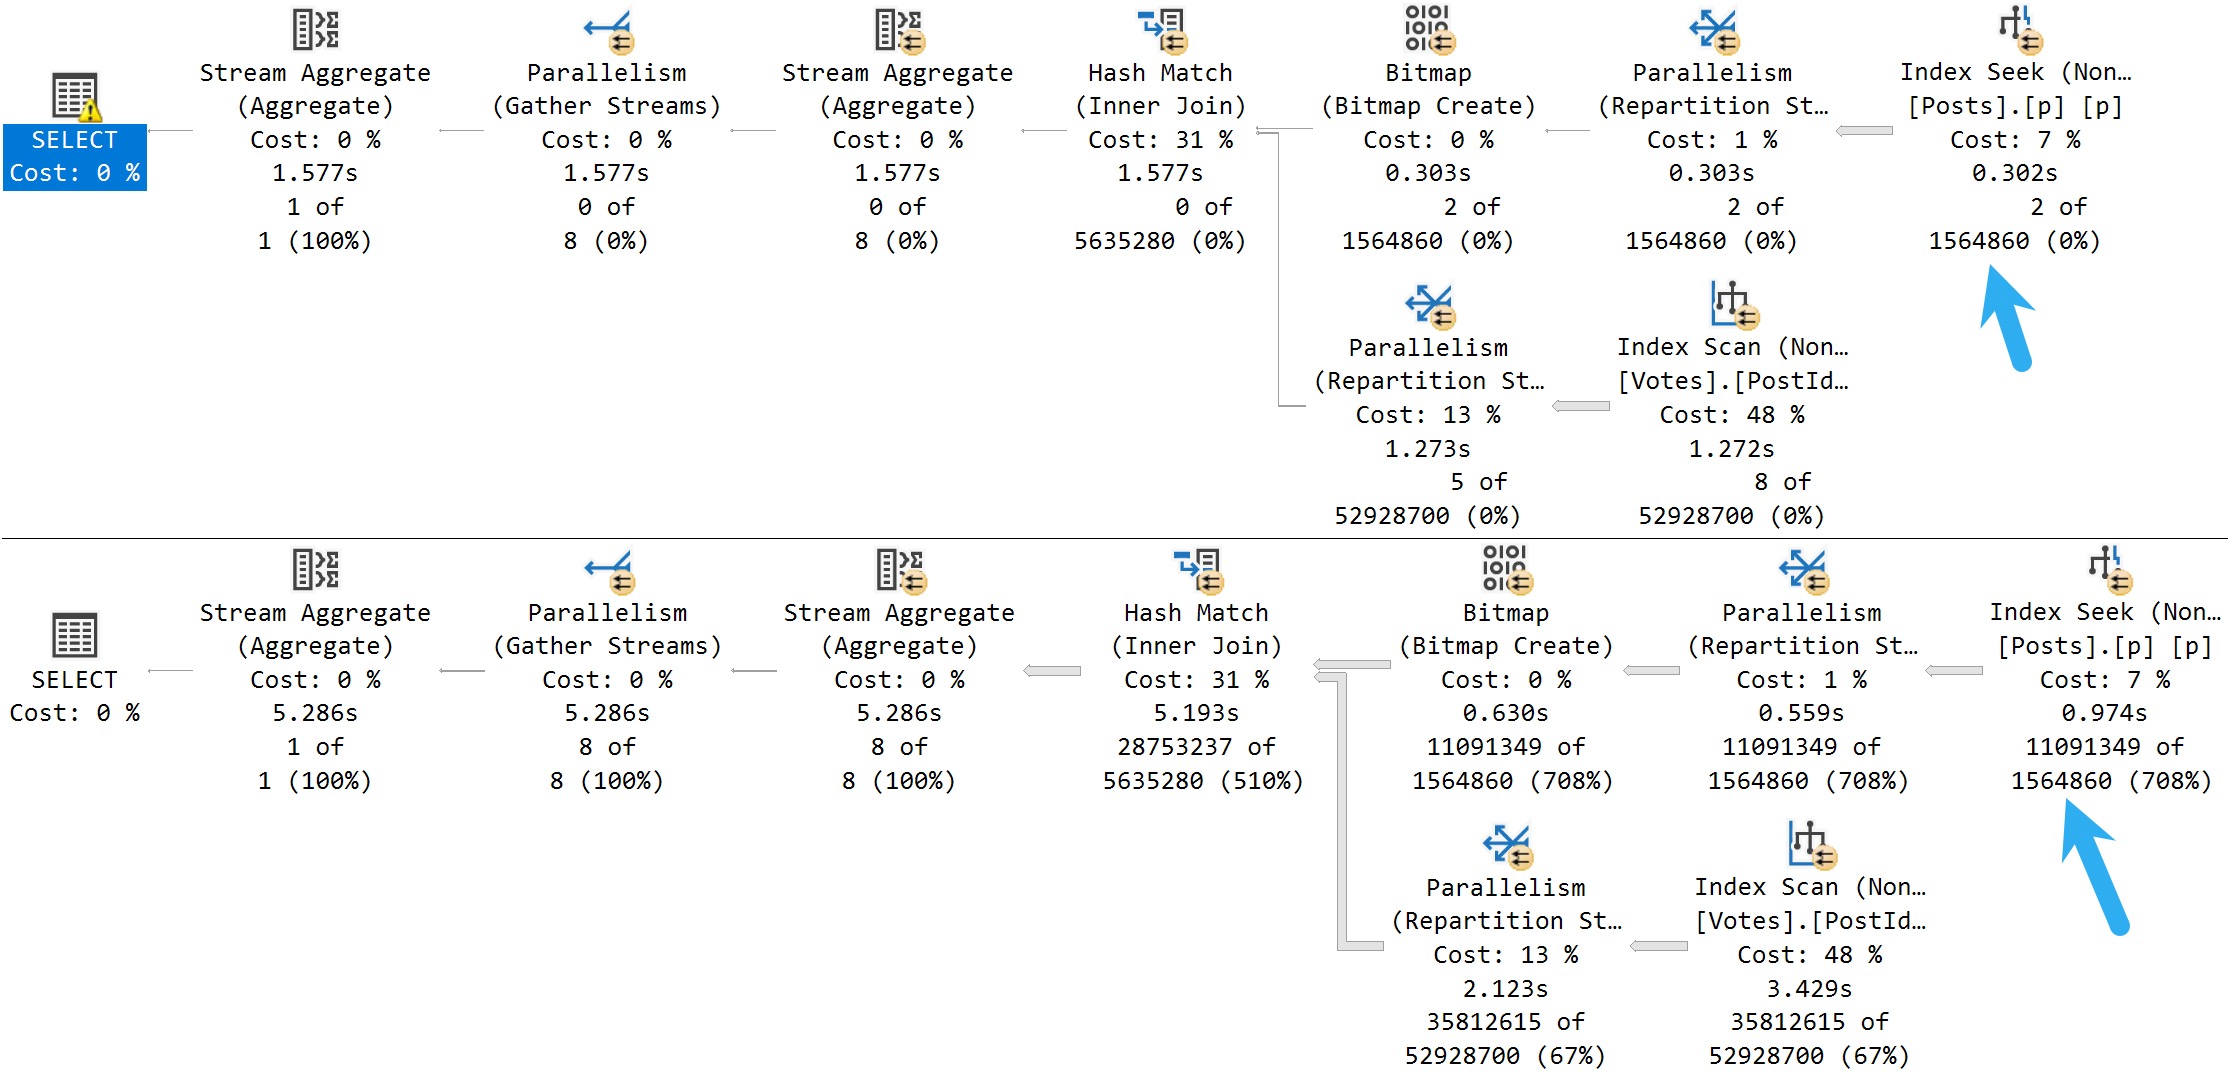
Posts
Here are the plans that hit the Posts table:
nope
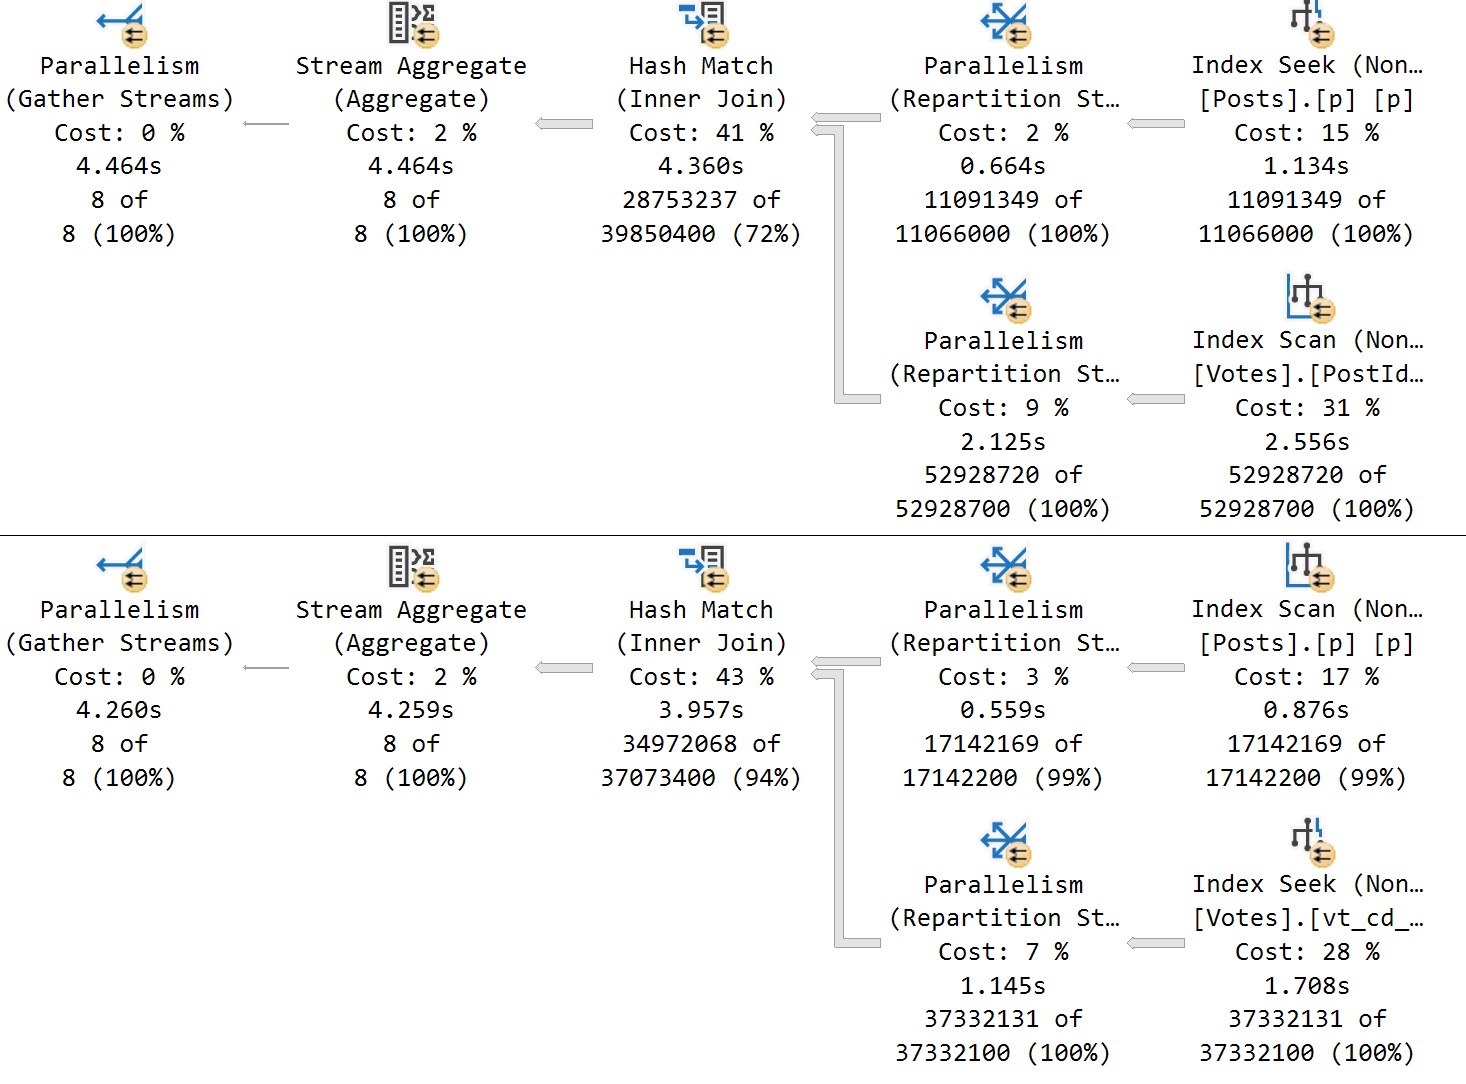
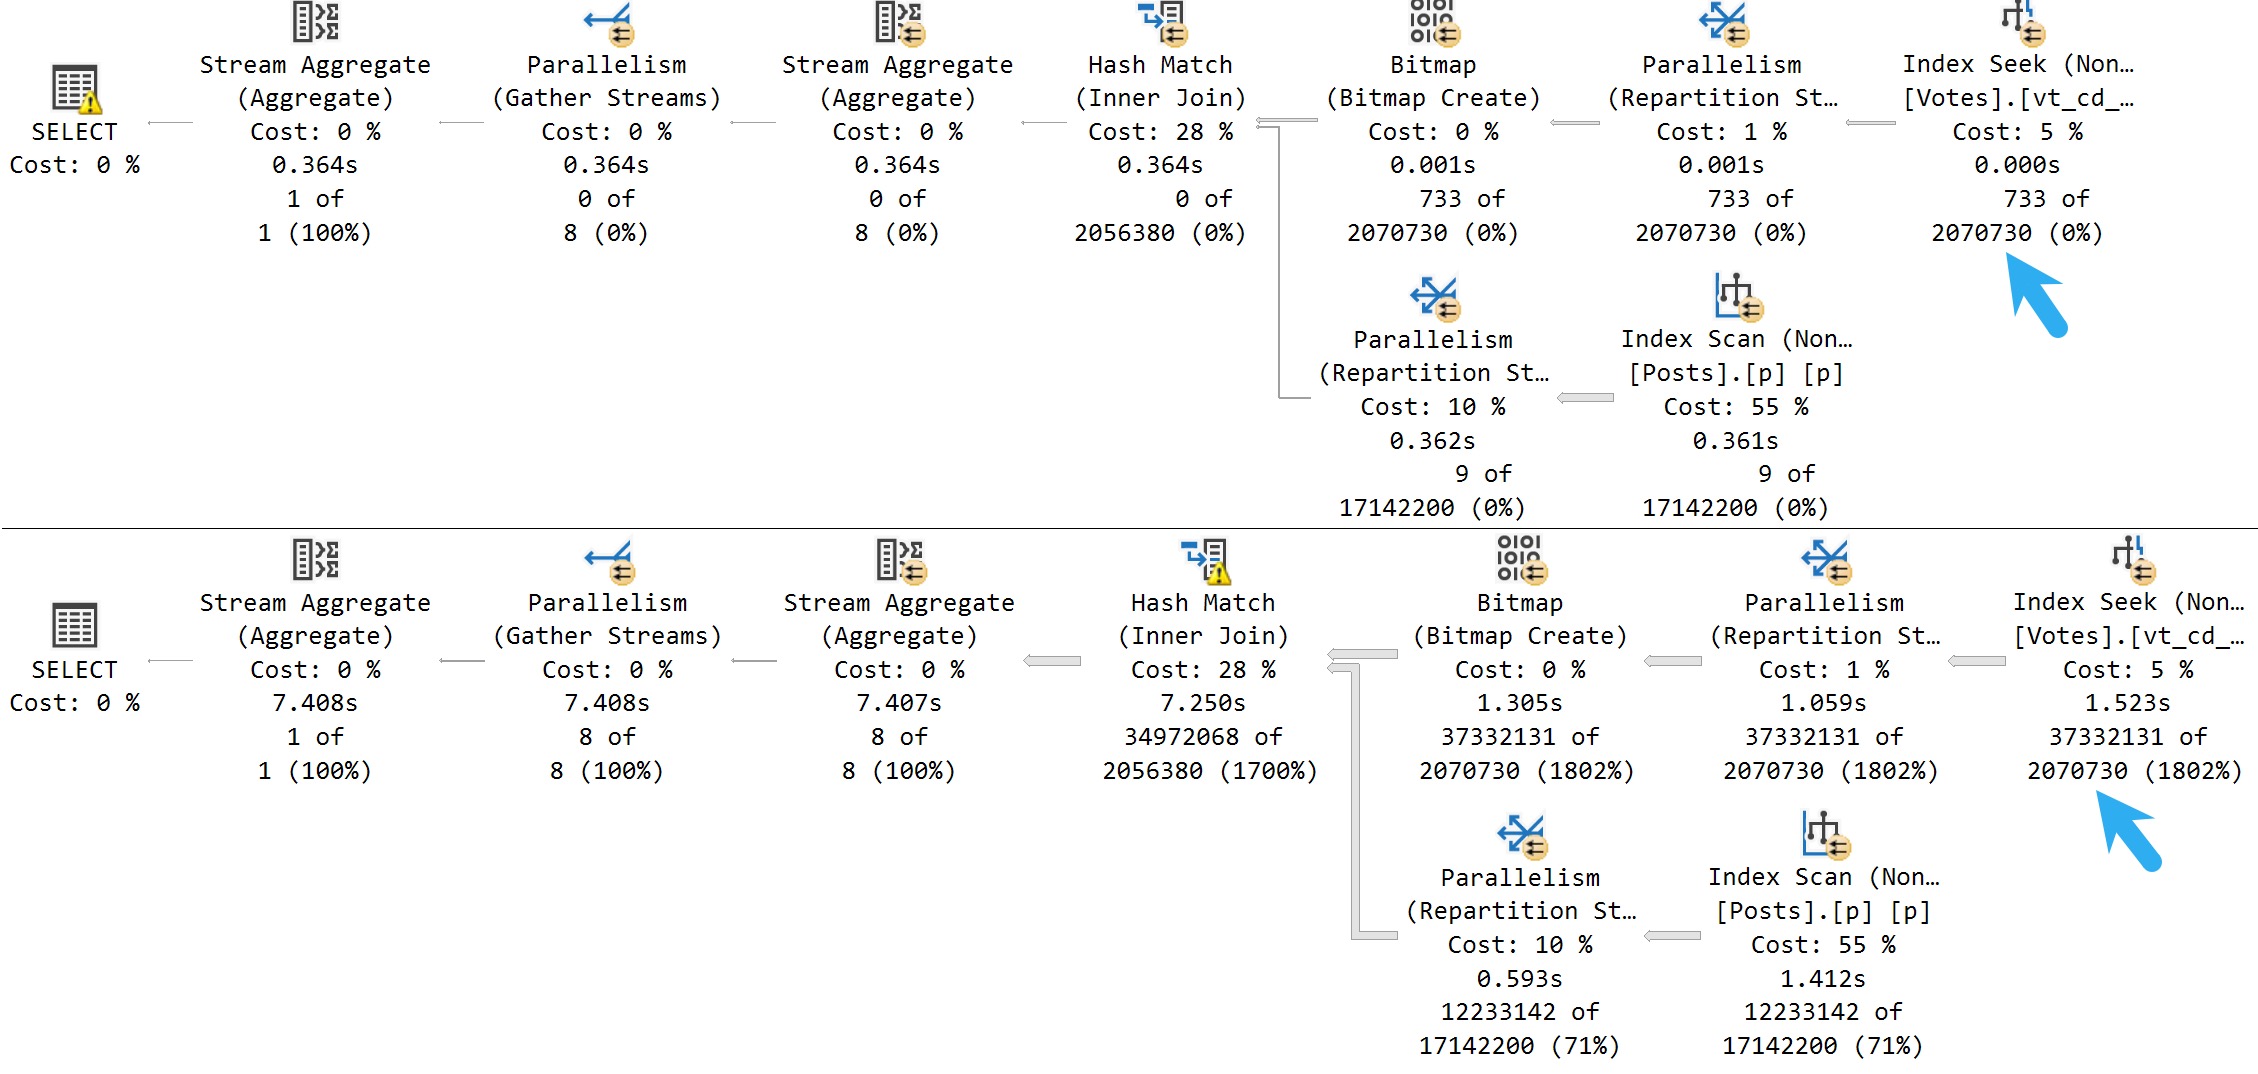
Votes
Here are query plans for the Votes table:
also nope
Planama!
Regardless of how many rows may actually flow out of the table, SQL Server makes the same “density vector” guess, which sucks in these cases.
This isn’t parameter sniffing, or plan caching, because we’re wiping out the plan cache between executions. This is what happens when local variables get used, even when you copy parameter values over to them.
I’ve seen this work under rare circumstances where SQL Server’s estimates were bad regardless of the supplied parameters, but… I want to emphasize that it’s incredibly rare for this to be a good long-term solution.
You can sort of ignore the cardinality estimates on the joined tables a bit, because the Bitmaps are going to throw those off a bit.
So, we’ve seen the problem, and we’ve seen things that don’t work to fix the problem.
Tomorrow we’re going to see if stored procedures will give us better results.
Thanks for reading!
Going Further
If this is the kind of SQL Server stuff you love learning about, you’ll love my training. I’m offering a 75% discount to my blog readers if you click from here. I’m also available for consulting if you just don’t have time for that and need to solve performance problems quickly.