Understand Your Plan: When Queries Use Batch Mode

Batchius Modius


Much like parallelism, Batch Mode is something I often resort to to make queries get reliably faster.

There aren’t a lot of great visual indicators in SSMS about when a query uses it, aside from:

  • Adaptive joins
  • Operator Properties (Execution Mode)
  • Window Aggregates
  • Parallel plans sometimes missing Exchange Operators
  • Your horrible reporting query finishes immediately for some reason

There might be more, but I’ve been day drinking.

Of course, it’s basically useless on Standard Edition:

https://erikdarling.com/sql-server/how-useful-is-column-store-in-standard-edition/

Heuristic Worship


Prior to SQL Server 2019, you needed to have a columnstore index present somewhere for batch mode to kick in for a query.

Somewhere is, of course, pretty loose. Just having one on a table used in a query is often enough, even if a different index from the table is ultimately used.

That opened up all sorts of trickery, like creating empty temporary or permanent tables and doing a no-op left join to them, on 1 = 0 or something along those lines.

Sure, you couldn’t read from rowstore indexes using batch mode doing that prior to SQL Server 2019, but any other operator that supported Batch Mode could use it.

  • Hash Joins
  • Hash Aggregates
  • Sorts
  • Window Aggregates
  • Filter
  • Compute Scalar
  • Others, but again, I’ve been day drinking

You can read more about the differences here:

https://erikdarling.com/sql-server/batch-mode-on-row-store-vs-batch-mode-tricks/

Homebody


With SQL Server 2019 Enterprise Edition, in Compatibility Level 150, SQL Server can decide to use Batch Mode without a columnstore index, even reading from rowstore indexes in Batch Mode.

The great thing is that you can spend hours tediously tuning queries and indexes to get exactly the right plan and shape and operators or you can just use Batch Mode and get back to day drinking.

Trust me.

To get a sense of when you should be trying to get Batch Mode in your query plans, check out this post:

https://erikdarling.com/sql-server/signs-you-need-batch-mode-for-your-sql-server-queries/

Thanks for reading!

Going Further


If this is the kind of SQL Server stuff you love learning about, you’ll love my training. I’m offering a 75% discount to my blog readers if you click from here. I’m also available for consulting if you just don’t have time for that and need to solve performance problems quickly.
Understand Your Plan: When Queries Go Parallel

Zip Zap Fast


Parallel queries were originally conceived of by David Lee Roth in 198X. He doesn’t remember exactly. It’s cool.

In some cases, they’re the only reasonable option. If your query is processing millions of rows, spreading them out across a bunch of worker threads will reduce wall clock time (assuming nothing goes terribly, horribly wrong elsewhere).

It doesn’t necessarily increase CPU time, though. Again, perfect world (we’re optimists here at Darling Data):

  • One thread processing 8 million rows takes one 8 seconds
  • Eight threads processing 1 million rows a piece takes 1 second

Either way, you’re looking at 8 seconds of CPU time, but it changes how that’s spread out and who feels it.

  • On a single thread, it happens over eight person-seconds to a human being
  • One eight threads, it happens over 1 person seconds, but the “strain” is on the CPUs doing extra work

Your Own Parallel Query


In my corner of the query tuning world, parallelism is the only way to speed up some queries. There’s only so much work you can stick on one thread and get it going faster.

Often, queries aren’t going parallel because of some limiting factor:

  • Scalar UDFs anywhere near the vicinity
  • Inserting to table variables
  • Linked server queries
  • Cursor options

There are also times when every query is going overly-parallel because:

Neither situation is ideal.

Why Getting Settings Right Is So Tough


We all know the default suck. MAXDOP at 0 and Cost Threshold For Parallelism at 5 is dumb for anything north of Northwinds.

Check out this video to hear my thoughts on it:

Accosted


The other thing that’s really tough to reason out about setting Cost Threshold For Parallelism is that every single thing related to cost you see, whether it’s for the entire plan, or just a single operator, is an estimate.

Estimates are… Well, have you ever gotten one? Has it ever been 100%? If you’ve ever hired a contractor, hoo boy. You’re sweating now.

Expensive queries can be fast. Cheap queries can be slow. Parameterized queries can be cheap and fast, but if you get into a situation with bad parameter sniffing, that cheap fast plan can turn into an insufferable relationship.

Yeah, I’m one of those people who usually starts off by bumping Cost Threshold For Parallelism to 50. It’s reasonable enough, and I don’t get married to it. I’m open to changing it if there’s evidence that’s necessary. Plus, it’s pretty low risk to experiment with.

My dear friend Michael J Swart has a Great Post about measuring changes to it here.

The important thing to keep in mind with any of these settings, aside from the defaults being bad, is that you’re not setting them with the goal of eliminating CXPACKET and CXCONSUMER waits completely. Unless you’re running a pure virgin OLTP system, that’s a real bad idea.

Thanks for reading!

Going Further


If this is the kind of SQL Server stuff you love learning about, you’ll love my training. I’m offering a 75% discount to my blog readers if you click from here. I’m also available for consulting if you just don’t have time for that and need to solve performance problems quickly.

Understand Your Plan: Operators That Use Memory Grants

What’s The Point?


Whoever called memory a “bank” was a smart cookie. Everything you get from RAM is a loan.

In SQL Server, queries can get memory loaned to them while they execute. The most common reasons for memory grants are Sorts and Hashes. You may also see them for an Optimized Nested Loops Join, but whatever.

Memory is such an important aspect of query and overall server performance that it really helps to understand when there’s pressure on it, and where it’s coming from.

It’s sort of funny, you read any article about PAGEIOLATCH waits, and people are sitting there telling you that you have a problem with your disk subsystem and whatnot and to investigate that. Buy SSDs.

They never tell you to add memory to be less reliant on disk. I do, but that’s because I love you and want you to be happy and smart.

But this ain’t about that, it’s about this. And this is query memory grants.

How Much?


If you’re on Standard Edition, or using the default Resource Governor settings on Enterprise Edition, any query can come along and suck up up to ~25% of your server’s max server memory setting.

Ain’t that just crackers?

Would you also believe that SQL Server will give out 75% of that setting to queries, and there’s no way to control that? At least not without a bunch of complicated Resource Governor

All that can add up to some severe contention issues. Especially because SQL Server tends to way overestimate memory grants. String columns are lit’rally the devil.

But SQL Server isn’t totally out to get you, either. Some operators can share memory, and parallelism splits up memory grants across threads.

At least until SQL Server 2019, where Batch Mode On Row Store made everything… well, more crackers.

If you’ve been using columnstore for a while, you probably already know these pains.

Fixing Them?


If you need to “fix” a specific query quickly, you can use the MIN and MAX grant percent hints. That allows you to set high and low boundaries for what a single memory can be granted for memory.

Remember that indexes put data in order, and having ordered data can increase the chances of you getting order-friendly algorithms, and decrease your need to ask for memory to sort data in.

Consider joins and aggregates:

  • Hash Joins are typically chosen for large, unordered sets
  • Merge Joins require ordered sets
  • Hash Aggregates are typically chosen for large, unordered sets
  • Stream Aggregates require ordered sets

If you index columns appropriately, you make the choice for using ordered algorithms more likely. Without an index putting that data in order, the optimizer would have to choose to add a Sort to the query plan for them to occur.

That can sometimes be costed out of the realm of existence, and that’s fine. Sorts can be pretty rough.

If you need some help figuring that stuff out, check out these posts:

Thanks for reading!

Going Further


If this is the kind of SQL Server stuff you love learning about, you’ll love my training. I’m offering a 75% discount to my blog readers if you click from here. I’m also available for consulting if you just don’t have time for that and need to solve performance problems quickly.

Understand Your Plan: Operators That Write Data (Spools, Spools, Spools)

Four Non Mods


This post isn’t about modifying data. I don’t believe in doing that; get your data right the first time and you’ll avoid a lot of issues. You’ll also never need to worry about Merge.

I kid, of course. You’re doing great with it. Good for you.

This post also isn’t about things that oh-look-how-technically-correct-I-am may also write data via workfiles or worktables.

  • Many to many merge joins
  • Hash joins aggregates
  • A bunch of other stuff that won’t make you popular to know about

This post is about one of my query plan frenemies: Spools. Spools of all variety, lazy and eager.

There are other kinds of spools too, like rowcount spools and window spools, but they’re different enough that I can’t generalize them in with other types.

For example, rowcount spools only keep a count; they don’t track a full data set. Sure, you may be able to rewrite queries when you see them, but this is about how they operate.

Ditto window spools. I typically don’t sweat those unless someone uses a window function and doesn’t specify the ROWS in the OVER clause. The default is RANGE, and uses a far less efficient disk-based spool.

With that out of the way, let’s part on with the other two.

What’s A Spool To Do


Spools are temporary structures that get stuck over in tempdb. They’re a bit like temp tables, though they don’t have any of the optimizations and enhancements. For example, loading data into a spool is a row-by-row operation.

The structure that spools use varies a bit. Table spools use a “clustered index”, but it’s not built on any of the columns in your data. Index spools use the same thing, but it’s defined on columns in your data that the optimizer thinks would make some facet of the query faster.

In both cases, these spools are used in an attempt to do less work on the inner sign of a nested loops join, either by:

  • Table Spool: Reducing how many times the branch executes by only running for unique values
  • Index Spool: Creating a more opportune index structure to seek to rows in

I don’t think of Spools as always bad, but I do think of them as something to investigate. Particularly Eager Index Spools, but Table Spools can act up too.

You may see Spools in modification queries that can be tuned, or are just part of modifying indexes.

Lazy v. Eager


Lazy spools load data as requested, and then truncate themselves to honor a new request (except Lazy Index Spools, which don’t truncate).

In Spool operator properties, you’ll see things like “Rewinds” and “Rebinds”. You can think of rewinds like reusing data in the spool, and Rebinds like putting a new set of data in. You can sometimes judge the efficacy of a Lazy Table Spool by looking at actual rebind vs. rewinds.

If rebinds are and rewinds are close in count, it may not have been an effective spool. These numbers for Lazy Index Spools are almost useless. Don’t look at them.

Eager spools load all the data at once. Where you have to be careful with them is when you see Eager Index spools on large tables.

  • No missing index request
  • Data is loaded on a single thread even in a parallel plan
  • Data is loaded row by row
  • Index is thrown out when the query finishes

Look, these are bad traits. They’re so bad I’ve dedicated a lot of blog space to writing about them:

https://erikdarling.com/sql-server/a-query-to-help-you-find-plans-with-eager-index-spools/

https://erikdarling.com/sql-server/eager-index-spool-annoyances/

https://erikdarling.com/sql-server/spool-and-spool-alike/

https://erikdarling.com/sql-server/spool-sizes-and-the-select-list/

https://erikdarling.com/sql-server/things-sql-server-vnext-should-address-spools/

https://erikdarling.com/sql-server/spools-are-just-crappy-temp-tables/

https://erikdarling.com/plan-cache-liars/signs-your-execution-plan-is-lying-to-you-index-spools/

Thanks for reading!

Going Further


If this is the kind of SQL Server stuff you love learning about, you’ll love my training. I’m offering a 75% discount to my blog readers if you click from here. I’m also available for consulting if you just don’t have time for that and need to solve performance problems quickly.
Understand Your Plan: Processing Data With A Join Operator

Your Girlfriend


Anyone who tells you there are only three types of joins in SQL Server isn’t your friend.

Okay, maybe that’s harsh. Maybe they’re just getting you prepared for the bonne promenade through all the many different faces a join can wear in your query plans.

Maybe they have a great explanation for Grace Hash Joins in their back pocket that they’re waiting to throw in your face like a bunch of glitter.

Maybe.

Nested Loops Join


Nested loops are the join type that everyone starts talking about, so in the interest of historical familiarity, I will too. And you’ll like it. Because that’s what you’re used to.

Some things to look for in the properties of a Nested Loops join:

  • Prefetching (can be ordered or not ordered)
  • Vanilla Nested Loops (predicate applied at the join)
  • Apply Nested Loops (Outer Reference at join operator, predicate applied at index)
  • As part of a Lookup (key or bookmark)

Nested Loops work best a relatively small outer input, and an index to support whatever join conditions and other predicates against the inner table.

When the outer side of a Nested Loops Join results in N number of scans on the inner side, you can usually expect performance to be unsatisfactory.

This may be part of the reason why Adaptive Joins have the ability to make a runtime decision to choose between Hash and Nested Loops Joins.

Right now, Nested Loops Joins can’t execute in Batch Mode. They do support parallelism, but the optimizer is biased against those plans, and cost reductions are only applied to the outer side of the plan, not the inner side.

A fun piece of SQL Jeopardy for the folks watching along at home: these are the only type of joins that don’t require an equality predicate. Wowee.

This is how Microsoft keeps consultants employed.

Merge Join


Traditionally in second place, though I wish they’d be done away with, are Merge Joins.

People always say things like “I wish I had a dollar for every time blah blah blah”, but at this point I think I do have a dollar for every time a Merge Join has sucked the life out of a query.

If you’ll permit me to make a few quick points, with the caveat that each should have “almost always” injected at some point:

  • Many to Many Merge Joins were a mistake

    SQL Server Query Plan
    trash
  • Sort Merge plans were a mistake
  • Parallel Merge Joins were a mistake

Merge joins don’t support Batch Mode, and are not part of the Adaptive Join decision making process. That’s how terrible they are.

Part of what makes them terrible is that they expect ordered input. If you don’t have an index that does that, SQL Server’s Cost Based Optimizer might fly right off the handle and add a Sort into your query plan to satisfy our precious little Merge Join.

The gall.

In a parallel plan, this can be especially poisonous. All that expected ordering can result in thread to thread dependencies that may lead to exchange spills or outright parallel deadlocks.

Merge Joins were a mistake.

Hash Join


Ah, Hash Joins. Old Glory. Supporters of Adaptive Joins and Batch Mode, and non-requirers of ordered inputs.

Hail To The Hash, baby.

That isn’t to say that they’re perfect. You typically want to see them in reporting queries, and you typically don’t want to see them in OLTP queries. Sometimes they’re a sign that of a lack of indexing in the latter case.

There are all sorts of neat little details about Hash Joins, too. I am endlessly fascinated by them.

Take bitmaps, for example. In parallel row mode plans, they’re way out in the open. In batch mode plans, they’re only noted in the hash join operator, where you’ll see the BitmapCreator property set to true. In serial row mode plans, they get even weirder. They’re always there, they’re always invisible, and there’s no way to visually detect them.

Semi Joins and Anti-Semi Joins


You may see these applied to any of the above types of joins, which are a bit different from inner, outer, full, and cross joins in how they accept or reject rows.

They’ll usually show up when you use

  • EXISTS
  • NOT EXISTS
  • INTERSECT
  • EXCEPT

Where they differ is in their:

  • Treatment of duplicate matches
  • Treatment of NULLs
  • Ability to accept or reject rows at the join

Both EXISTS and NOT EXISTS stop looking once they find their first match. They do not produce duplicates in one to many relationships.

NOT EXISTS doesn’t get confused by NULLs the way that NOT IN does, and both INTERSECT and EXCEPT handle NULLs differently than equality predicates.

Thanks for reading!

Going Further


If this is the kind of SQL Server stuff you love learning about, you’ll love my training. I’m offering a 75% discount to my blog readers if you click from here. I’m also available for consulting if you just don’t have time for that and need to solve performance problems quickly.
Understand Your Plan: Processing Data With An Aggregate Operator

Smack Dab


Aggregates can be useful for all sorts of things in a query plan, and can show up in many different forms.

It would be tough to cover all of them in a single post, but what I’d like to do is help all you nice folks out there understand some of their finer points.

Streaming and Hashing


The two main types of aggregates you’ll see in SQL Server query plans are:

  • Stream Aggregate (expect ordered data)
  • Hash Aggregate (don’t care about order)

Of course, they break down into more specific types, too.

  • Partial aggregates (an early attempt to reduce rows)
  • Scalar aggregates (returning a sum or count without a group by, for example)
  • Vector aggregates (with a group by)

And if you want to count more analytical/windowing functions, you might also see:

  • Segment/Sequence project (row mode windowing functions)
  • Window Aggregates (batch mode windowing functions)

To learn more about partial aggregates, check out this post.

Aggregation Ruling The Nation


One of the big benefits of aggregates is, of course, making a set of values distinct. This can be particularly help around joins, especially Merge Joins where the many to many type can cause a whole lot of performance issues.

That being said, not every aggregation is productive. For example, some aggregations might happen because the optimizer misjudges the number of distinct values in a set. When this happens, often other misestimates will follow.

Two of the biggest factors for this going awry are:

  • Memory grants for sorts and aggregations across the execution plan
  • Other operators chosen based on estimated row counts being much lower

Here are some examples:

SQL Server Query Plan
creep

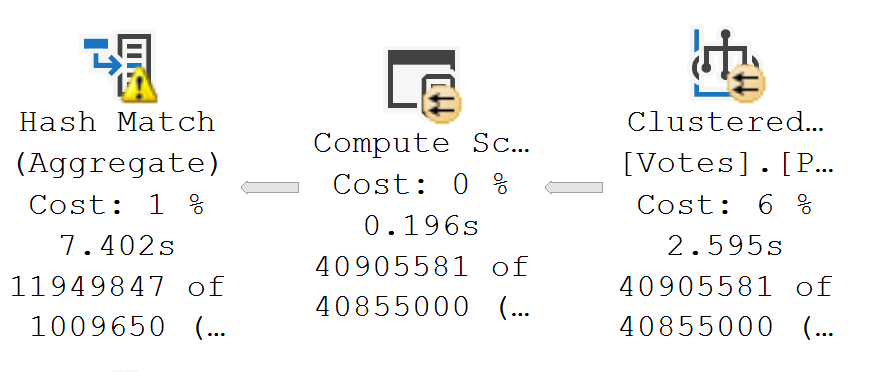
This hash match aggregate is the victim of a fairly large misestimation, and ends up spilling out to disk. In this case, the spill is pretty costly from a performance perspective and ends up adding about 5 seconds to the query plan.

SQL Server Query Plan
distorted

Here, a hash match aggregate misestimates again, but now you can see it impact the next operator over, too. The sort just didn’t have enough of a memory grant to avoid spilling. We add another few seconds onto this one.

SQL Server Query Plan
contagious

In extreme cases, those spills can really mess things up. This one carries on for a couple minutes, doing nothing but hashing, spilling, and having a bad time.

Thanks for reading!

Going Further


If this is the kind of SQL Server stuff you love learning about, you’ll love my training. I’m offering a 75% discount to my blog readers if you click from here. I’m also available for consulting if you just don’t have time for that and need to solve performance problems quickly.
Understand Your Plan: Getting Data With A Scan Operator

They Live


I’m not sure why scans got such a bad rap. Perhaps it’s a leftover from the Bad Old Days© when people worried about logical fragmentation and page splits.

What I mean to say is: scans are often treated with a level of revulsion and focus that distracts people from larger issues, and is often due to some malpractice on their part.

Sure, scans can be bad. Sometimes you do need to fix them. But make that decision when you’re looking at an actual execution plan, and not just making meme-ish guesses based on costs and estimates.

You’re better than that.

It Follows


Let’s start with a simple query:

SELECT TOP (1)
    p.*
FROM dbo.Posts AS p;

There’s no where clause, no join, and we’ll get a scan, but it’s driven by the TOP.

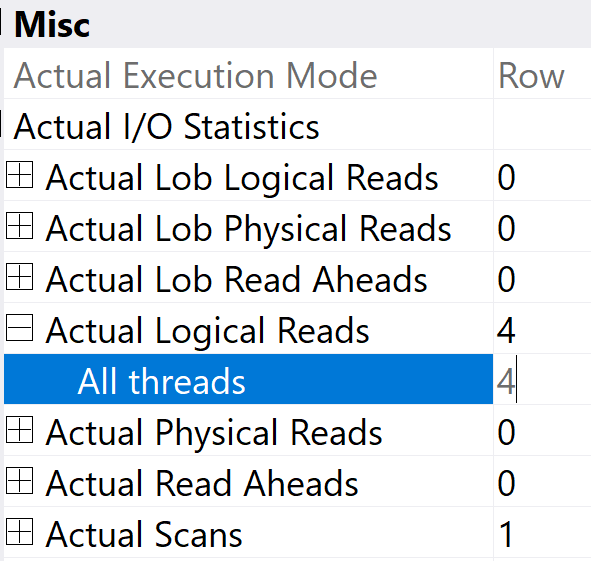
If we get look at the actual execution plan, and hit F4/get the Properties of the clustered index scan, we’ll see it does a minimal number of reads.

SQL Server Query Plan
scooting

The four reads to get a single row are certainly not the number of reads it would take to read this entire Posts table.

The reason it’s not 1 read is because the Posts table contains the nvarchar(max) Body column, which leads to reading additional off row/LOB pages.

C.H.U.D


Let’s look at a situation where you might see a clustered index scan(!), a missing index request(!), and think you’ll have the problem solved easily(!), but… no.

SELECT TOP (1000)
    u.DisplayName,
    p.Score,
    _ = dbo.InnocentScan(p.OwnerUserId)
FROM dbo.Posts AS p
JOIN dbo.Users AS u
    ON p.OwnerUserId = u.Id
WHERE p.Score = 1
ORDER BY p.Id;

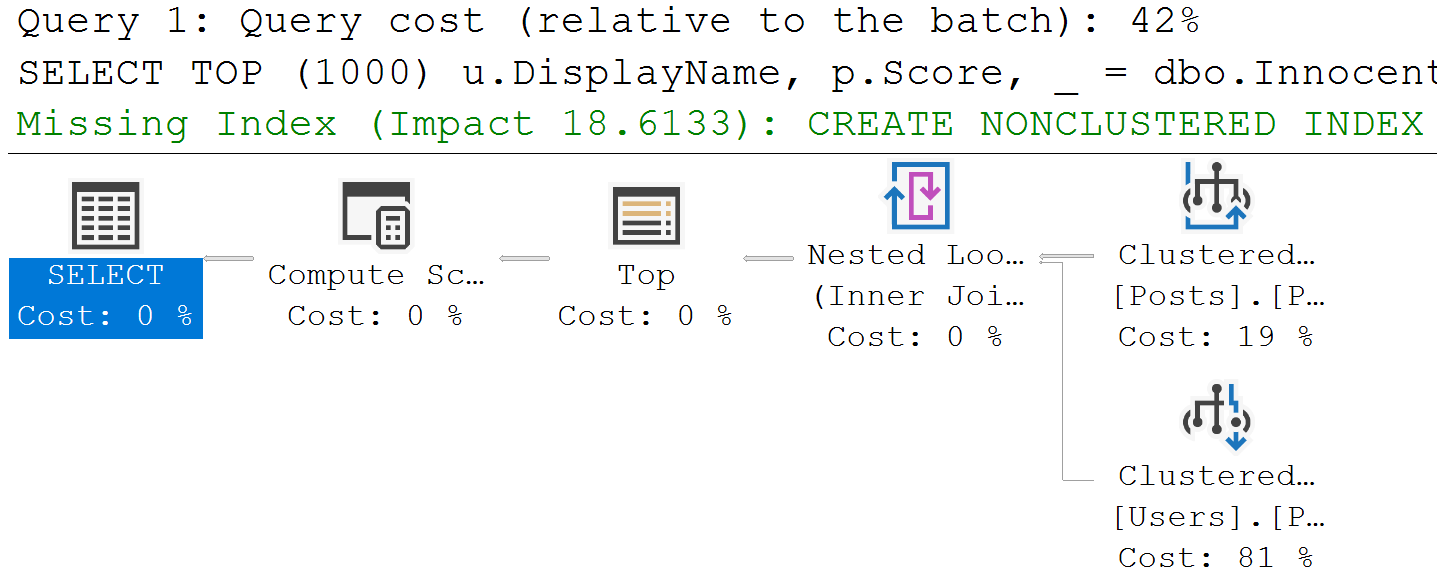
Costs are really wacky sometimes. Like here.

SQL Server Query Plan
exhibit a

In this really unhelpful query plan (thanks, SSMS, for not showing what the clustered thing is), we have:

  • A clustered index scan of Posts
  • A clustered index seek of Users

The optimizer tells us that adding an index will reduce the estimated effort needed to execute the query by around 18%. Mostly because the estimated effort needed to scan the clustered index is 19% of the total operator costs.

CREATE NONCLUSTERED INDEX [<Name of Missing Index, sysname,>]
ON [dbo].[Posts] ([Score])
INCLUDE ([OwnerUserId])

Got it? Missing index requests don’t care about joins.

Geistbusters


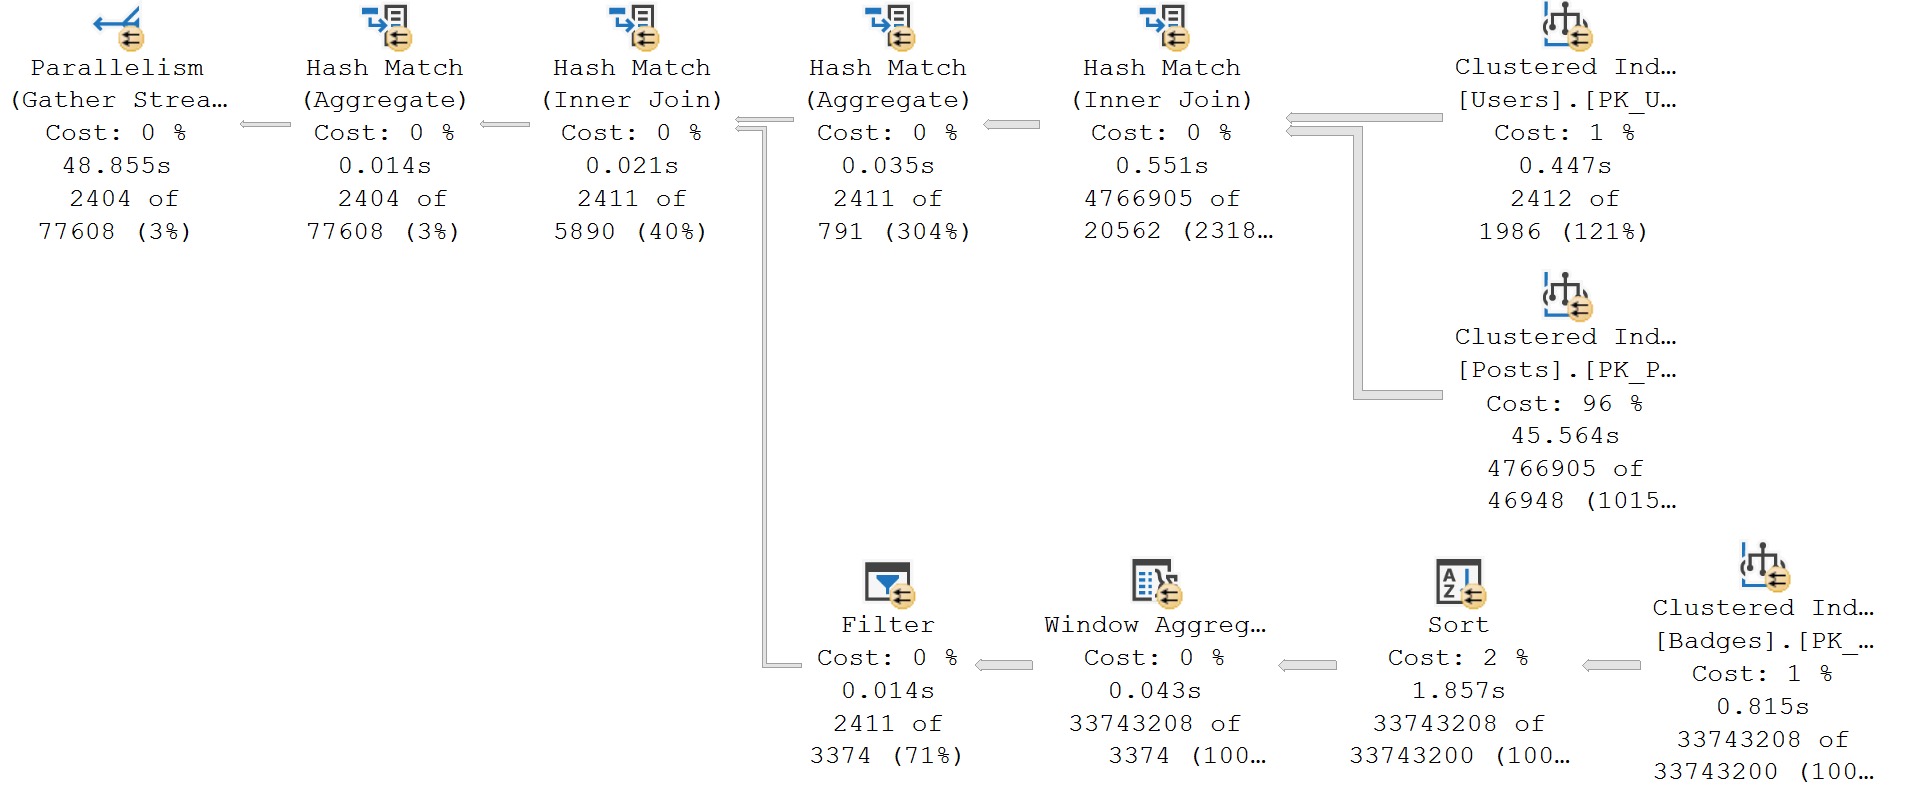
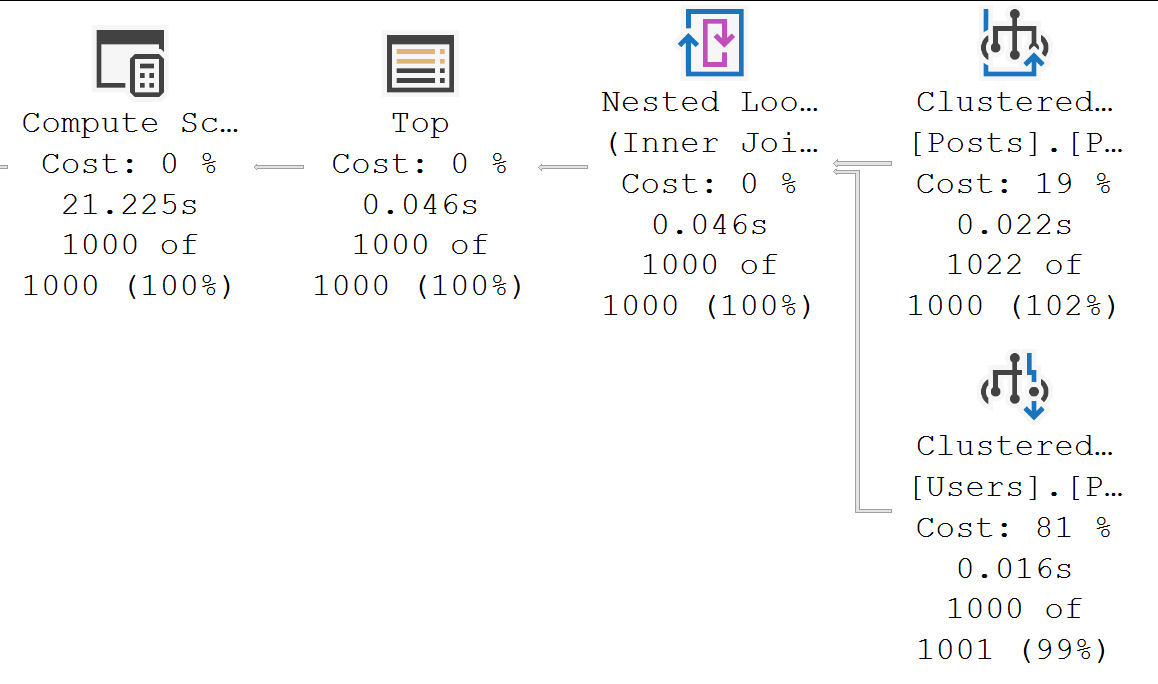
If one were to look at the actual execution plan, one may come to the conclusion that an index here would not solve a gosh. darn. thing.

SQL Server Query Plan
plan, actually

21 seconds is spent in the operator that costs 0%, and less than 40 milliseconds is spent between the two operators that make up 100% of the plan cost.

Very sad for you if you thought that missing index request would solve all your problems.

What About Scans?


I know, the title of this post is about retrieving data via an index scan, but we ended up talking about how scans aren’t always the root of performance issues.

It ended up that way because as I was writing this, I had to help a client with an execution plan where the problem had nothing to do with a clustered index scan that they were really worried about.

To call back to a few other points about things I’ve made so far in this series:

  • The operator times in actual execution plans are the most important thing for you to look at
  • If you’re not getting a seek when you think you should, ask yourself some questions:
  • Do I have an index that I can actually seek to data in?
  • Do I have a query written to take advantage of my indexes?

If you’re not sure, hit the link below. This is the kind of stuff I love helping folks out with.

Thanks for reading!

Going Further


If this is the kind of SQL Server stuff you love learning about, you’ll love my training. I’m offering a 75% discount to my blog readers if you click from here. I’m also available for consulting if you just don’t have time for that and need to solve performance problems quickly.
Understand Your Plan: Getting Data With A Seek Operator

Rumble, Young Man, Rumble


People. People complain. People complain about SQL Server. That’s probably why I get paid to deal with it, but whatever.

One complaint I get to hear week in and week out is that SQL Server isn’t using someone’s index, or that there are too many index scans and they’re slow.

That might actually be a composite of like twelve complaints, but let’s not start counting.

Usually when we start examining the queries, query plans, and indexes for these renegades, the reasons for the lack of a seek become apparent.

  • There’s no good index to seek to
  • The query is written in a way that seeks can’t happen
  • A predicate is on two columns

Desperately Seeking Susan


In a query that doesn’t have any of those problems, you’ll naturally get a seek and feel really good about yourself.

CREATE INDEX v ON dbo.Votes(PostId)
WITH(SORT_IN_TEMPDB = ON, DATA_COMPRESSION = PAGE);

SELECT
    c = COUNT_BIG(*)
FROM dbo.Votes AS v
WHERE v.PostId = 194812;

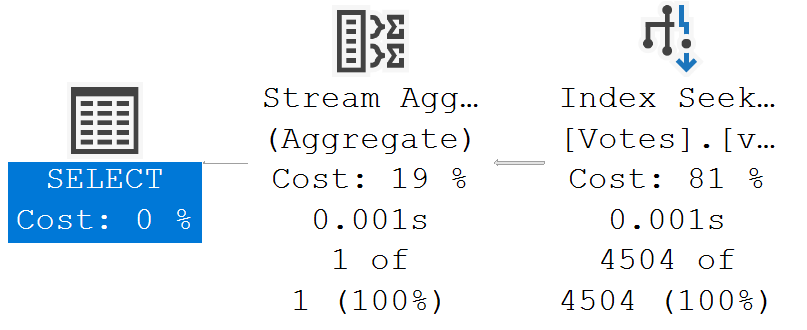
We’re set for success! And look how happy things are. Happy little query plans.

SQL Server Query Plan
rookie card

Sargy Bargy


You’re smart people. You’re on top of things. You know that without an index on PostId, the query up above wouldn’t have anything to seek to.

Useful indexes are half the battle. The other half of the battle is not screwing things up.

I’m going to use dynamic SQL as shorthand for any parameterized query. I should probably add that using a local variable would only make things worse.

Don’t do that. Or this.

DECLARE
    @sql nvarchar(MAX) = N'',
    @PostId int = 194812;

SELECT
    @sql = N'
SELECT
    c = COUNT_BIG(*)
FROM dbo.Votes AS v
WHERE (v.PostId = @PostId 
OR     @PostId IS NULL);';

EXEC sys.sp_executesql
    @sql,
    N'@PostId int',
    @PostId;

While we’re on the topic, don’t do this either.

DECLARE
    @sql nvarchar(MAX) = N'',
    @PostId int = 194812;

SELECT
    @sql = N'
SELECT
    c = COUNT_BIG(*)
FROM dbo.Votes AS v
WHERE v.PostId = ISNULL(@PostId, v.PostId);';

EXEC sys.sp_executesql
    @sql,
    N'@PostId int',
    @PostId;

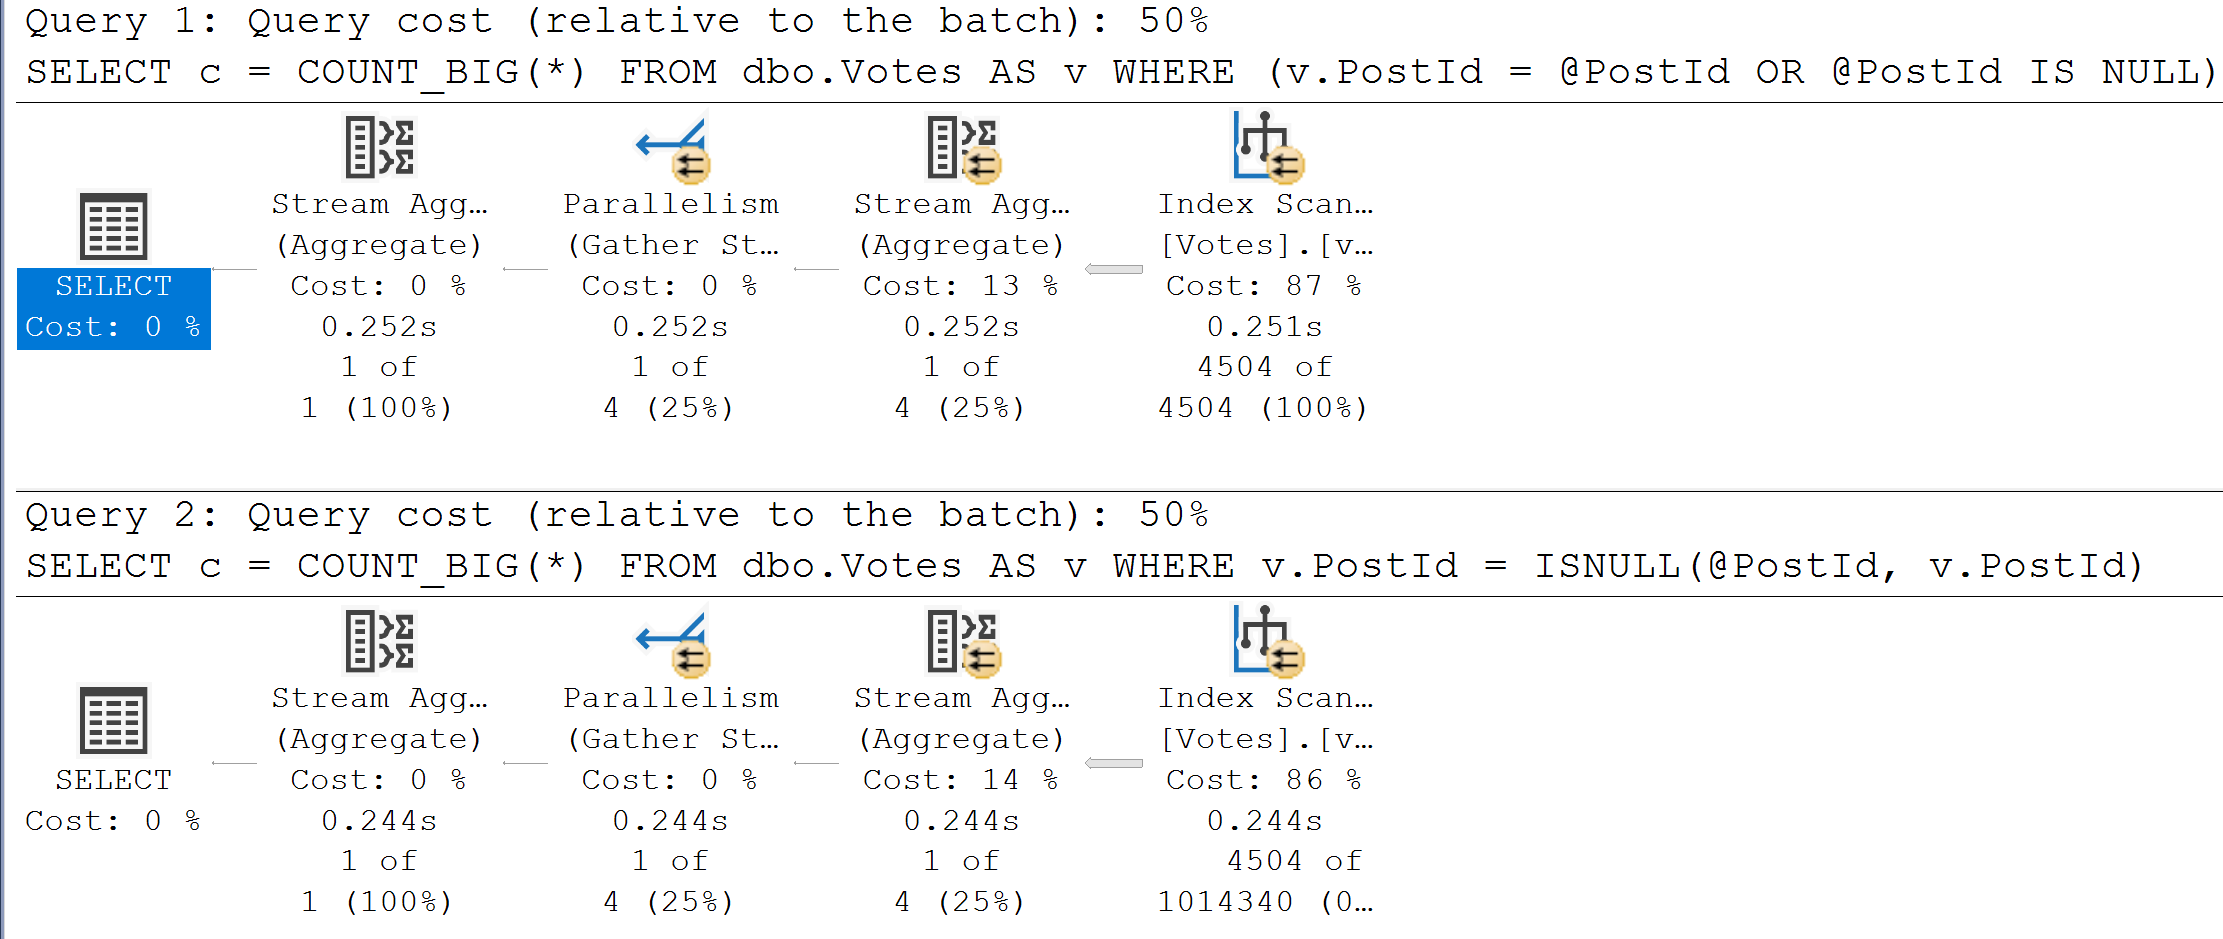
Here’s the query plans for these:

SQL Server Query Plan
practice makes

We end up not only scanning the entire index unnecessarily, but the second one gets a really unfavorable cardinality estimate.

It’s amazing how easy it is to ruin a perfectly good seek with lazy query writing, isn’t it?

Joint Venture


When you compare two columns in tables, you might not always see a seek, even if you have the best index ever.

Let’s use this as an example:

CREATE INDEX p ON dbo.Posts(OwnerUserId, LastEditorUserId)
WITH(SORT_IN_TEMPDB = ON, DATA_COMPRESSION = PAGE);

SELECT
    c = COUNT_BIG(*)
FROM dbo.Posts AS p
WHERE p.OwnerUserId = p.LastEditorUserId;

We have an index that matches our predicate, and you might think that having all that data very nicely in order would make SQL Server’s job really easy to match those columns up.

But no. No in every language.

SQL Server Query Plan
scrab

Big ol’ index scan. Even if you try to force the matter, SQL Server says  no nein nyet non and all the rest.

SELECT
    c = COUNT_BIG(*)
FROM dbo.Posts AS p WITH(FORCESEEK)
WHERE p.OwnerUserId = p.LastEditorUserId;
Msg 8622, Level 16, State 1, Line 56
Query processor could not produce a query plan because of the hints defined in this query. 
Resubmit the query without specifying any hints and without using SET FORCEPLAN.

Who can deal with all that?

Hail Mary


Let’s really dig our heels in and try to make this work. We’ll create an index on both columns individually and see how things go.

CREATE INDEX p ON dbo.Posts(OwnerUserId)
WITH(SORT_IN_TEMPDB = ON, DATA_COMPRESSION = PAGE);

CREATE INDEX pp ON dbo.Posts(LastEditorUserId)
WITH(SORT_IN_TEMPDB = ON, DATA_COMPRESSION = PAGE);
SQL Server Query Plan
woof

Just to be clear, this is horrible. You don’t want this to happen. This sucks, and if you like it you should jump in a deep, deep hole.

Ends Well


Seeks are often the best possible outcome when a small number of rows are sought. OLTP workloads are the prime candidate for seeking seeks. A seek that reads a large portion of the table isn’t necessarily agreeable.

For everyone else, there’s nothing wrong with scans. Especially with column store indexes, you shouldn’t expect seeking to a gosh darn thing.

Thanks for reading!

Going Further


If this is the kind of SQL Server stuff you love learning about, you’ll love my training. I’m offering a 75% discount to my blog readers if you click from here. I’m also available for consulting if you just don’t have time for that and need to solve performance problems quickly.
Understand Your Plan: Reading Operator Times In SQL Server Execution Plans

Wiseacre


When I was sitting down to figure out what to write about this, one of the topics that I thought would be interesting was the width of lines/arrows in query plans.

I sat here for half a day pecking here and there getting the post started, writing some demos, and… realized I couldn’t remember the last time I really looked at them. I could explain it, but… I’d be lying to you if I said I really cared.

Unless you have an actual execution plan, line thickness is based on estimates. They could be totally wrong, and chances are that if you’ve got a query plan in front of you it’s not because it’s running well.

If you’re going to run it and look at the actual execution plan anyway, you’d have to be seven levels obtuse to look at line widths instead of operator times.

They’re your best friends these days, and help you focus on the parts of the plan that need help.

Looney Tunes


At this point in 2022, most people are going to be looking at plans running only in row mode. As folks out there start to embrace:

  • Column store
  • SQL Server 2019 Enterprise Edition
  • Compatibility level 150+

We’ll start to see more batch mode operators, especially from batch mode on row store. I only mention this because row mode and batch mode operators track time differently, and you need to be really careful when analyzing operator times in actual execution plans.

In plans that contain a mix of row mode and batch mode operators, timing might look really funny in some places.

Let’s chat about that!

Row Mode


As of this writing, all row mode query plan operators accumulate time, going from right to left. That means each operator tracks it’s own time, along with all of the child operators under it.

Where this is useful is for following time accumulation in a query plan to where it spikes. I sort of like this because it makes tracking things down a bit easier than the per-operator times in batch mode plans.

Let’s use this plan as an example:

SQL Server Query Plan
oh i forgot it’s summertime

Yes, it’s intentionally bad. I made it that way. You’re welcome. There are two things I’d like to point out here:

  • Just about every line looks equally thick
  • Costing is a bit weird, aside from the Eager Index Spool

But you know what? If you look at operator times, you can get a pretty good idea about where things went wrong.

  • Maybe that Key Lookup wasn’t the greatest use of time
  • Boy howdy, that eager index spool took about 90 seconds

I’m not gonna go into how to fix this, I just want you to understand where time is taken, and how it adds up across operators.

Batch Mode


In batch mode plans, the story is a whole lot different.

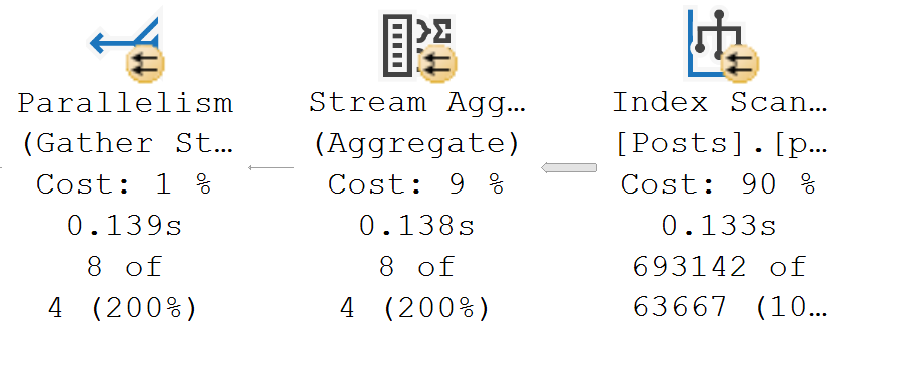
SQL Server Query Plan
BMOR than you can be

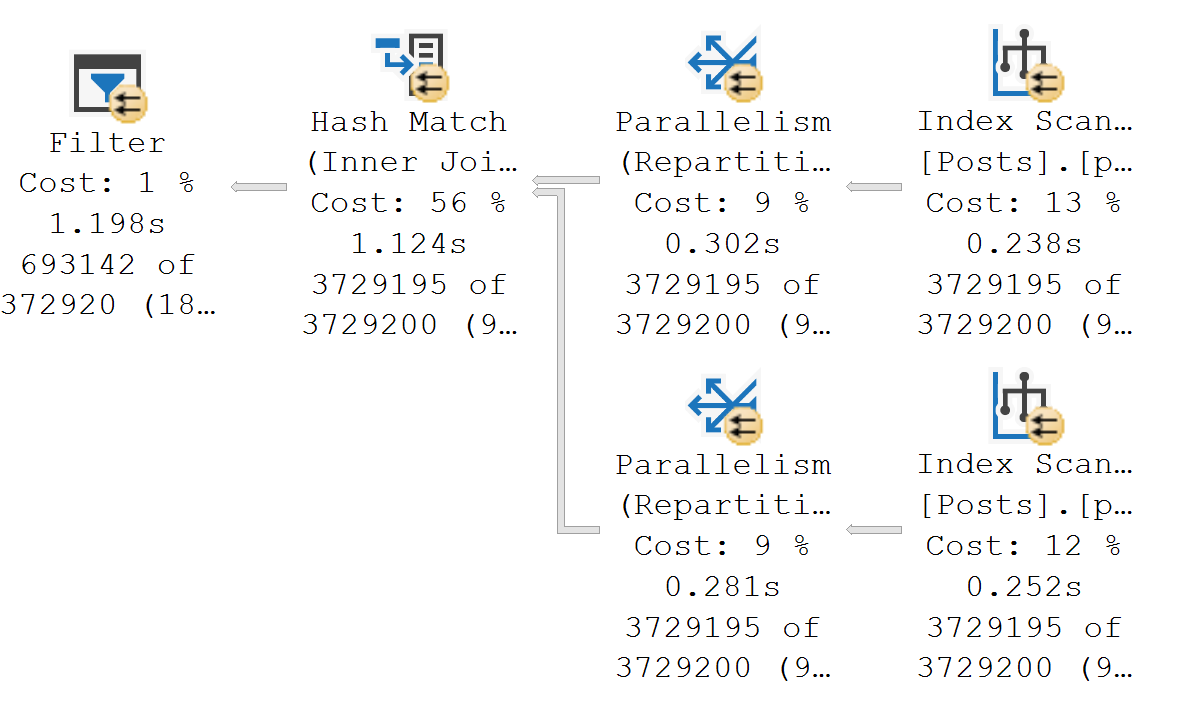
Times for operators are all over the place. They’re not wrong, they’re just different. Each operator that executes in batch mode tracks it’s own time, without the child operator times.

Nothing adds up until the very end, when you hit the Gather Streams operator. Right now, none of the parallel exchange operators can run in batch mode, so they’ll add up all of the child operator times.

If you’ve got a plan with a lot of operators mixed between row and batch mode, things will look even weirder.

Thanks for reading!

Going Further


If this is the kind of SQL Server stuff you love learning about, you’ll love my training. I’m offering a 75% discount to my blog readers if you click from here. I’m also available for consulting if you just don’t have time for that and need to solve performance problems quickly.
No, Really: Don’t Optimize For Ad Hoc Workloads As A Best Practice

Better Late


A few weeks back, my friend Randolph (B|T) and I collaborated a bit on a blog post about Optimize For Ad Hoc Workloads.

Now that I’m a Microsoft Approved Blogger™️ and you all have to take me Very Seriously™️, I’d like to make a few of the points here in my own words, though I highly suggest reading Randolph’s post because it’s much better.

Randolph writes for a living. I’m just a consultant with some free time.

The result you want from Optimize For Ad Hoc Workloads is probably closer to what Forced Parameterization does


When people complain about lots of “single use” plans, they probably want there to be fewer of them. Turning on Forced Parameterization will promote plan reuse. Turning on Optimize For Ad Hoc Workloads won’t do that.

  • With Forced Parameterization, literal values are replaced (when possible) with parameters, which promotes plan re-use
  • Turning on Optimize For Ad Hoc Workloads compiles a new plan for queries with literal values, and then just caches a stub

Parameterization, and further Parameter Sniffing, has an ominous meaning for many of you.

I see it all the time, folks jumping through every hoop in the world to not have a parameter get sniffed. Recompiling, Unknown-ing, Local Variable-ing. Sad. Very sad.

Bottom line: If you want fewer single use plans, parameterize your damn queries.

Turning Optimize For Ad Hoc Workloads on can make workload analysis difficult


You know how sometimes you have a performance issue, and then you go look in the plan cache, and queries don’t have execution plans? This setting can make that happen.

Why? Because stubs aren’t query plans. Never have been. Never will be.

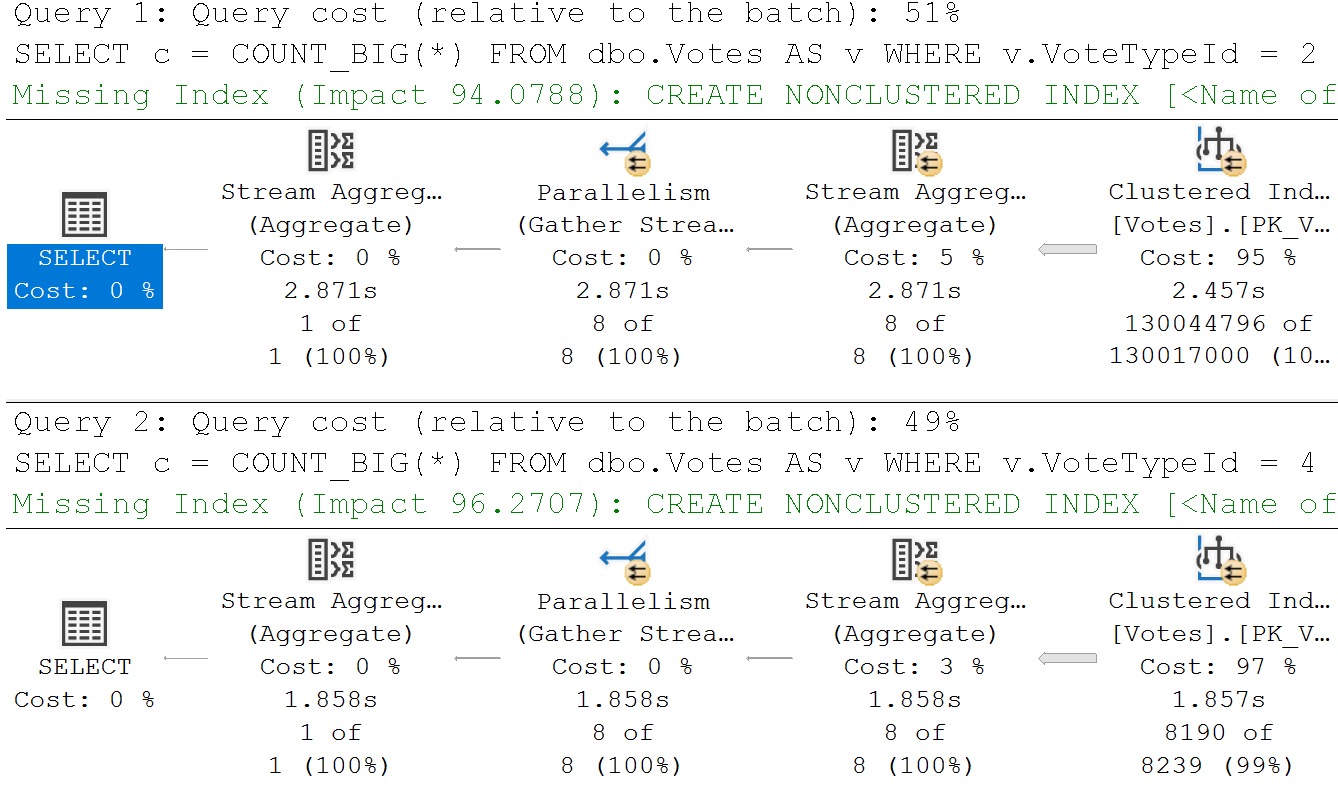
If we run these queries, they’ll both get a stub, because each one has a different literal value. These are “single use” plans, even though SQL Server compiled and use the “same” plan for each one.

SELECT
    c = COUNT_BIG(*)
FROM dbo.Votes AS v
WHERE v.VoteTypeId = 2
AND 1 = (SELECT 1); --Skip a Trivial Plan/Simple Parameterization
GO

SELECT
    c = COUNT_BIG(*)
FROM dbo.Votes AS v
WHERE v.VoteTypeId = 4
AND 1 = (SELECT 1); --Skip a Trivial Plan/Simple Parameterization
GO

Here are the plans:

SQL Server Query Plan
tell me why

But here’s why they’re “different” and each one gets a stub:

hashtastic

Even though the Query Hash and Query Plan Hash are identical, each one has a different SQL Handle.

I’m using a simple demo to show you the end result, but you can probably see why this would be more difficult to deal with in real life.

The “same” query might run more than once, but if a literal in the where clause is different, you’ll have two stubs


Thinking about the situation above:

  • Did we really want to compile the same execution plan twice?
  • What’s the point of having two stubs for what amounts to the exact same query and plan?

If we had turned on Forced Parameterization, that’s what would have happened: The where clause would have had the literal 4 and 2 values replaced with a parameter, and we would have gotten a cached and re-used plan.

The problem we hit is that we got two different SQL Handles because the 4 and 2 hash out differently.

That’s a problem that gets solved with parameterization, forced or fixed in code.

You’ll still compile full plans for queries to execute with


This is another misconception I run into a lot. For every time a query runs that SQL Server can’t find a matching SQL Handle for, you’ll get a new plan generated, even if only a stub is cached.

If you have a lot of big, complicated queries that take a long time to compile, that can be unpleasant.

And look, I’m not afraid of recompiling plans. In the right place, that can be awesome.

This can also be annoying if you have queries constantly coming in and compiling new plans.

It’s been a while since I’ve seen this scenario cause CPU to hit 100% (or even close to it), but in today’s Unfortunate Cloud Age© any CPU reduction you can make to end up on smaller, less expensive instances can make you look like a Bottom Line Hero™️.

Constant query compilation, and long query compilation, can contribute to that.

The stubs still count towards the total number of plans you can have cached


By default, you have a limit of 160,036 total plans allowed in the cache, and other limits in total size based on available memory.

Plan stubs still contribute towards the total count. Lots of single use stubs can still cause “bloat”.

The questions you have to ask here, are:

  • How much larger are my query plans than the stubs?
  • Is that savings worth it to not have plans in cache available to analyze?
  • Do you capture query plans in a different way? (Query Store, monitoring tool, etc.)

Lots of stubs aren’t necessarily more useful.

When you end up with “the same” unparameterized query running over and over again, you might miss out on aggregate resource usage for it


One way that it can be useful to look at your server’s workload is seeing which queries:

  • Execute the most
  • Use the most total CPU
  • Are attached to missing index requests

A lot of plan cache analysis scripts (even ones I’ve written and worked on) will group by or correlate on SQL Handle for different things.

If you have a different SQL Handle for every execution of “the same” query with different literals, you’ll miss out on them.

You’ll have to look by something else, like Query Hash, Query Plan Hash, or Plan Handle instead.

You can run into this regardless of Optimize For Ad Hoc Workloads being enabled, but a lot of folks out there tend to ignore rows returned by analysis scripts that don’t also have a query plan.

Stubs Ahoy.

The Setting Is Poorly Named


Last but not least: this is a poorly named setting.

I still run into folks who think that enabling this gives the optimizer some special powers for ad hoc queries.

It doesn’t. The only thing it does is cache a plan stub instead of the entire plan on “first execution”.

This isn’t a documentation problem either, this is a not-reading-the-documentation problem.

Thanks for reading!

Going Further


If this is the kind of SQL Server stuff you love learning about, you’ll love my training. I’m offering a 75% discount to my blog readers if you click from here. I’m also available for consulting if you just don’t have time for that and need to solve performance problems quickly.