While I still don’t install Azure Data Studio by default, I heard recently from Erin Stellato (t) that there’s a preview of real, live, actual execution plans out now.
Since not having query plans available was one of my chief gripes about ADS, I figured this was a good time to install it.
The pro here is that it looks like the query plan assets are much higher DPI than the ones in SSMS, but… I still can’t picture using it every day just yet.
There’s some key stuff missing, like being able to hide query results, and plan operators don’t show parallelism yet. While I hear that a lot of improvements are on the to-do list, between whatever is going on internally along with the GitHub backlog, I have no idea what the timeline is for them.
A Query Plan In Azure Data Studio
If you enable the workbench editor enable preview setting, you can hit CTRL+M to get an actual execution plan. Here’s what it looks like:
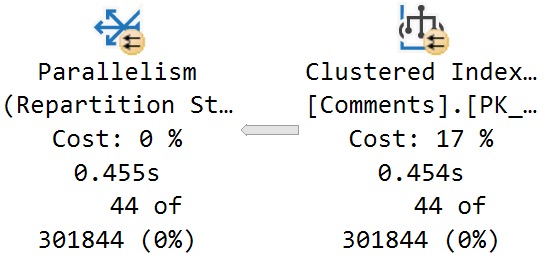
The arrow is just to point out the the plan does have parallelism engaged, but it is not shown anywhere (yet, I know, I know).
It is cool that you can get the full properties of any of the operators, and that operator times are consistent with what SSMS shows. Also, I like the highly accusatory, Snag-It style arrows here.
The Same Plan In SSMS
I recently changed the font that my query plans use to one that’s a bit less offensive. The only point here is that in this plan you can see parallelism more easily, and maybe that the operator icons aren’t quite as spiffy.
Aside from slight variations in CPU timing, the plans are virtually identical. Good!
Kind of.
Six Different Ways
My criticisms of how query plans are displayed are somewhat nit-picky, and I’d even wager that some people might disagree with me on how things should show up.
For example, i think it’s quite confusing that batch mode operators track time differently than row mode operators, and that there’s no real visual indication as to which operators use batch mode. I also very much dislike that in both the ADS and SSMS plans, the index operation is cut off. “Clustered Index S…” doesn’t help anyone.
I’d also find it useful to have an I/O rollup in the root node, where other Query Time Statistics are. But hey.
When you get deeper into things, stuff like a visual indicator of how many times an operator executed, and missing index requests for Eager Index Spools would be nice, too.
Anyway, I’m still not the target audience for ADS (at least so far as I can tell), and I’ll be sticking with SSMS for now, but this is a very nice addition for folks who ADS is more useful for.
Thanks for reading!
Going Further
If this is the kind of SQL Server stuff you love learning about, you’ll love my training. I’m offering a 75% discount to my blog readers if you click from here. I’m also available for consulting if you just don’t have time for that and need to solve performance problems quickly.
GitHub had been making me feel guilty about taking some time off over the holidays to not monkey about with T-SQL, and since my brain finally seems to be working after a hectic travel schedule, I decided to tweak a few things in sp_PressureDetector.
What’d I change? Great question! There’s a preview in yesterday’s post, but here’s the change log:
Formatting, of course
Clarify memory rollup column names
Add a section with wait stats overview for related cpu/memory/disk waits
Add query text column to memory grant results
Make query txt columns xml clickables
Rearranged columns for readability and consistency
Added a couple comments to clarify code intent
Add Max Server Memory to the total/available/granted line
If this is the kind of SQL Server stuff you love learning about, you’ll love my training. I’m offering a 75% discount to my blog readers if you click from here. I’m also available for consulting if you just don’t have time for that and need to solve performance problems quickly.
Memory is S-Tier crucial for most workloads to run reliably fast. It’s where SQL Server caches data pages, and it’s what it gives to queries to process Sorts and Hashes (among other things, but these are most common).
Without it, those two things, and many other caches, would be forced to live on disk. Horrible, slow disk. Talk about a good way to make databases less popular, eh?
With no offense to the SAN administrators of the world, I consider it my sworn duty to have databases avoid your domain as much as possible.
In this post, we’ll talk about how to figure out if your SQL Server needs more memory, and if there’s anything you can do to make better use of memory at the same time.
After all, you could be doing just fine.
(You’re probably not.)
Tale Of The Wait Stats
You can look at wait stats related to memory and query performance by running sp_PressureDetector.
It’ll give you some details about wait stats that relate to CPU and memory pressure. You wanna pay attention to the memory and disk waits, here. I had to squish it a little, but if you’re unfamiliar you can use the “description” column to better understand which ones to pay attention to.
Some important metrics to note here:
How do wait times relate to server uptime?
How long on average do we wait on each of these?
This won’t tell the whole story, of course, but it is a reasonable data point to start with. If your workload isn’t a 24×7 slog, though, you might need to spend more time analyzing waits for queries as they run.
In this example, it’s my local SQL instance, so it hasn’t been doing much work since I restarted it. Sometimes, you gotta look at what queries that are currently running are waiting on.
For that, go grab sp_WhoIsActive. If you see queries constantly waiting on stuff like this, it might be a sign you need more memory, because you have to keep going out to disk to get what queries need to use.
It could also be a sign of other things, like queries and indexes that need tuning, but if it’s sustained like this then that’s not entirely likely.
It’s much more likely a memory deficiency, but it’s up to you to investigate further on your system.
How Is SQL Server Using Memory Now?
Current memory utilization can be a good way to find out if other things are using memory and taking valuable space away from your buffer pool.
A lot of folks out there don’t realize how many different things SQL Server has to share memory across.
And, hey, yeah, sp_PressureDetector will show you that, too. Here’s a “normal” run:
SQL Server’s buffer pool is uninfringed upon by other consumers! Great. But sometimes queries ask for memory grants, and that’s where things can get perilous.
You may sometimes see Ye Olde First Memory Bank Of Motherboard loan out a swath to one or more queries:
The difference here? The buffer pool is reduced by ~9GB to accommodate a query memory grant.
sp_PressureDetector will show you the queries doing that, too, along with query plans.
It’ll also show you memory available in resource pools for granting out to queries. On this server, Max Server Memory is set to 50GB.
If you’re shocked that SQL Server is willing to give out 37GB of that to query memory grants, you haven’t been hanging around SQL Server long enough.
Then there’s a pretty good chance that it does, especially if data just plain outpaces memory by a good margin (like 3:1 or 4:1 or more).
You also have some options for making better use of your current memory, too.
Check critical queries for indexing opportunities (there may not always be a missing index request, but seasoned query tuners can spot ones the optimizer doesn’t)
Apply PAGE compression to existing row store indexes to make them smaller on disk and in memory
Check the plan cache for queries asking for large memory grants, but not using all of what’s granted to them
You can check the plan cache using a query like this. It’ll look for queries that ask for over 5GB of memory, and don’t use over 1GB of it.
WITH
unused AS
(
SELECT TOP (100)
oldest_plan =
MIN(deqs.creation_time) OVER(),
newest_plan =
MAX(deqs.creation_time) OVER(),
deqs.statement_start_offset,
deqs.statement_end_offset,
deqs.plan_handle,
deqs.execution_count,
deqs.max_grant_kb,
deqs.max_used_grant_kb,
unused_grant =
deqs.max_grant_kb - deqs.max_used_grant_kb,
deqs.min_spills,
deqs.max_spills
FROM sys.dm_exec_query_stats AS deqs
WHERE (deqs.max_grant_kb - deqs.max_used_grant_kb) > 1024.
AND deqs.max_grant_kb > 5242880.
ORDER BY unused_grant DESC
)
SELECT
plan_cache_age_hours =
DATEDIFF
(
HOUR,
u.oldest_plan,
u.newest_plan
),
query_text =
(
SELECT [processing-instruction(query)] =
SUBSTRING
(
dest.text,
( u.statement_start_offset / 2 ) + 1,
(
(
CASE u.statement_end_offset
WHEN -1
THEN DATALENGTH(dest.text)
ELSE u.statement_end_offset
END - u.statement_start_offset
) / 2
) + 1
)
FOR XML PATH(''),
TYPE
),
deqp.query_plan,
u.execution_count,
u.max_grant_kb,
u.max_used_grant_kb,
u.min_spills,
u.max_spills,
u.unused_grant
FROM unused AS u
OUTER APPLY sys.dm_exec_sql_text(u.plan_handle) AS dest
OUTER APPLY sys.dm_exec_query_plan(u.plan_handle) AS deqp
ORDER BY u.unused_grant DESC
OPTION (RECOMPILE, MAXDOP 1);
This will get you the top (up to!) 100 plans in the cache that have an unused memory grant, ordered by the largest difference between grant and usage.
What you wanna pay attention to here:
How old the plan cache is: if it’s not very old, you’re not getting the full picture
How big the memory grants are: by default, the max is ~25% of max server memory
Controlling Memory Grants
If you’re looking for ways to control memory grants that doesn’t involved a bunch of query and index tuning, you have a few options:
Resource Governor: Enterprise Edition only, and usually applies to the whole workload
MIN_GRANT_PERCENT and MAX_GRANT_PERCENT query hints: You usually wanna use both to set a proper memory grant, just setting an upper level isn’t always helpful
Batch Mode Memory Grant Feedback: Requires Batch Mode/Columnstore, only helps queries between executions, usually takes a few tries to get right
For Resource Governor, you’ll wanna do some analysis using the query in the previous section to see what a generally safe upper limit for memory grants is. The more memory you have, and the higher your max server memory is, the more insane 25% is.
Again, just be cautious here. If you change this setting based on a not-very-old plan cache, you’re not gonna have a clear pictures of which queries use memory, and how much they use. If you’re wondering why I’m not telling you to use Query Store for this, it’s because it only logs how much memory queries used, not how much they asked for. It’s pretty ridiculous.
After you make a change like this, or start using those query hints, you’ll wanna do some additional analysis to figure out if queries are spilling to disk. You can change the query above to something like this to look at those:
WITH
unused AS
(
SELECT TOP (100)
oldest_plan =
MIN(deqs.creation_time) OVER(),
newest_plan =
MAX(deqs.creation_time) OVER(),
deqs.statement_start_offset,
deqs.statement_end_offset,
deqs.plan_handle,
deqs.execution_count,
deqs.max_grant_kb,
deqs.max_used_grant_kb,
unused_grant =
deqs.max_grant_kb - deqs.max_used_grant_kb,
deqs.min_spills,
deqs.max_spills
FROM sys.dm_exec_query_stats AS deqs
WHERE deqs.min_spills > (128. * 1024.)
ORDER BY deqs.max_spills DESC
)
SELECT
plan_cache_age_hours =
DATEDIFF
(
HOUR,
u.oldest_plan,
u.newest_plan
),
query_text =
(
SELECT [processing-instruction(query)] =
SUBSTRING
(
dest.text,
( u.statement_start_offset / 2 ) + 1,
(
(
CASE u.statement_end_offset
WHEN -1
THEN DATALENGTH(dest.text)
ELSE u.statement_end_offset
END - u.statement_start_offset
) / 2
) + 1
)
FOR XML PATH(''),
TYPE
),
deqp.query_plan,
u.execution_count,
u.max_grant_kb,
u.max_used_grant_kb,
u.min_spills,
u.max_spills,
u.unused_grant
FROM unused AS u
OUTER APPLY sys.dm_exec_sql_text(u.plan_handle) AS dest
OUTER APPLY sys.dm_exec_query_plan(u.plan_handle) AS deqp
ORDER BY u.max_spills DESC
OPTION (RECOMPILE, MAXDOP 1);
Small spills aren’t a big deal here, but you’ll definitely wanna pay attention to larger ones. This is set to find ones that are over 1GB, which is still pretty small, but could be meaningful.
If you notice a lot more queries spilling in a substantial way, you may have capped the high end of query memory grants too low.
Recap
Memory is something that I see people struggle to right-size, forecast, and understand the physics of in SQL Server. The worst part is that hardly anything in this post applies to Standard Edition, which is basically dead to me.
The cap for the buffer pool is 128GB, but you can use memory over that for other stuff
The main things to keep an eye on are:
Wait stats overall, and for running queries
Large unused memory grants in the plan cache
Size of data compared to size of memory
If you need help with this sort of thing, hit the link below to drop me a line about consulting.
Thanks for reading!
Going Further
If this is the kind of SQL Server stuff you love learning about, you’ll love my training. I’m offering a 75% discount to my blog readers if you click from here. I’m also available for consulting if you just don’t have time for that and need to solve performance problems quickly.
When I first started selling training videos, I tried out Shopify because it was highly recommended, seemed great at e-commerce, and offered an easy way for me to let folks buy inexpensive SQL Server training videos.
And you know what? It does all that stuff nicely, but I found it hard to incorporate other things easily.
Live training
Distributing slides and demos
Quizzes
Progress charts
Not that a lot of folks were asking for it, but it’s all stuff that seems nice to have when you’re trying to keep learners engaged.
As soon as I start getting other stuff set up, and figure out how to get past customers migrated, I’ll send out more official emails to let folks know to head to the new site.
In the meantime, thanks for all your support over the past couple years. I’m definitely looking forward to using a platform that’s friendlier for teaching, and not just selling.
Thanks for reading!
Going Further
If this is the kind of SQL Server stuff you love learning about, you’ll love my training. I’m offering a 75% discount to my blog readers if you click from here. I’m also available for consulting if you just don’t have time for that and need to solve performance problems quickly.
I’m a really big fan of using operator properties for a lot of things, at least visually. Where things sort of fall down for that is copying and pasting things out.
For some stuff, you still need to head down to the XML.
Let’s say you have a stored procedure that accepts a bunch of parameters. The rest of this one isn’t important, but here you go:
CREATE OR ALTER PROCEDURE
dbo.AwesomeSearchProcedure
(
@OwnerUserId int = NULL,
@CreationDate datetime = NULL,
@LastActivityDate datetime = NULL,
@PostTypeId int = NULL,
@Score int = NULL,
@Title nvarchar(250) = NULL,
@Body nvarchar(MAX) = NULL
)
A Plan Appears
Let’s say we grab a query plan for this thing from the plan cache or query store. We can get the properties of the select operator and see compile time values:
Again — nice visually — but it doesn’t do much for us if we want to recreate executing the stored procedure to get an actual execution plan.
It’s also not terrible helpful if we want to simulate a parameter sniffing situation, because we only have the compile time values, not the run time values.
Bummer. But whatever.
XML Time!
If we right click and select “show execution plan XML”, we can scroll way down to the bottom to find the XML fragment that holds what the properties display:
This still isn’t awesome, because we have to do some surgery on the XML itself to get values out.
It’s even worse if we have a parameterized application query, because not only do we need to make a DECLARE to assign values to these variables but we need to turn the query itself into dynamic SQL.
For most things, I absolutely adore using operator properties. For some things, you still need the XML.
It’d be nice if there were some fancy copy and paste magic that would do that for you, but so far it doesn’t exist.
Thanks for reading!
Going Further
If this is the kind of SQL Server stuff you love learning about, you’ll love my training. I’m offering a 75% discount to my blog readers if you click from here. I’m also available for consulting if you just don’t have time for that and need to solve performance problems quickly.
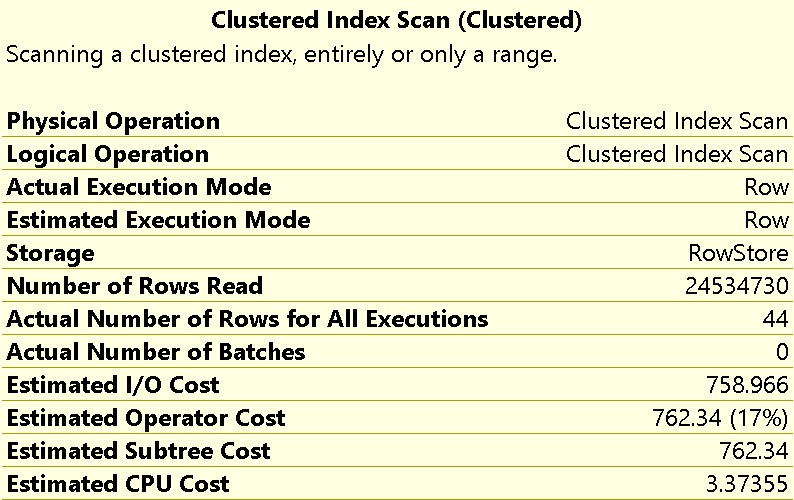
I know what you’re gonna say: You’re gonna say, Erik, you can do this by setting the Maximum Memory Percent for each and every resource pool other than the internal one.
And I’ll tell you something wacky: That limits more than just total query memory grants, and all I want is an easy and straightforward way to tell SQL Server that I don’t want it to give up huge swaths of my buffer pool to query memory grants.
While the Memory Grant Percent setting makes it really easy to cap the total memory grant a single query can ask for, nothing does a singular job of controlling how much total memory queries can ask for as a whole, without also stifling other caches that contribute to Stolen Server Memory, like the plan cache. A very big thank you to LMNOP(b|t) for helping me figure that out.
The other downside is that you’d have to set that cap for each pool, and that’s exhausting. Tiresome. Easy to get wrong. It’d be a whole lot easier and cleaner to set that globally, without also nerfing a bunch of other potentially useful caches.
Thanks for reading!
Going Further
If this is the kind of SQL Server stuff you love learning about, you’ll love my training. I’m offering a 75% discount to my blog readers if you click from here. I’m also available for consulting if you just don’t have time for that and need to solve performance problems quickly.
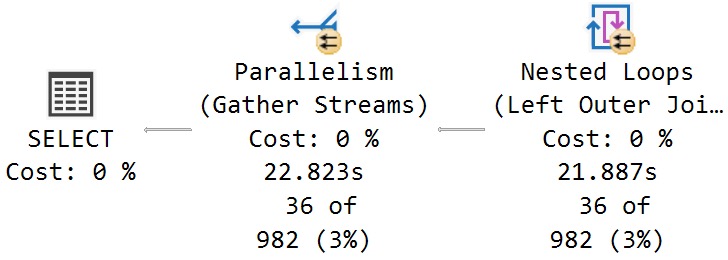
The sad news for you here is that nothing aside from selecting a CTE into a real or temporary table will materialize the result of the query within in it.
WITH
cte AS
(
SELECT TOP (1)
u.Id
FROM dbo.Users AS u
)
SELECT
c1.*
FROM cte AS c1
JOIN cte AS c2
ON c1.Id = c2.Id
JOIN cte AS c3
ON c1.Id = c3.Id;
This query will still have to touch the Users table three times. I’ve blogged about this part before, of course.
Bounce
You may notice something interesting in there, though, once you get past the disappointment of seeing three scans of the Users table.
Each scan is preceded by the TOP operator. This can sometimes be where people confuse the behavior of TOP in a Common Table Expression or Derived Table.
It’s not a physical manifestation of the data into an object, but (at least for now) it is a logical separation of the query semantics.
In short, it’s a fence.
The reason why it’s a fence is because using TOP sets a row goal, and the optimizer has to try to meet (but not exceed) that row goal for whatever part of the query is underneath it.
Strange
Take this query for example, which loads a bunch of work into a Common Table Expression with a TOP in it:
WITH
Posts AS
(
SELECT TOP (1000)
p.*
FROM dbo.Posts AS p
WHERE p.PostTypeId = 1
AND p.Score > 500
AND EXISTS
(
SELECT
1/0
FROM dbo.Users AS u
WHERE u.Id = p.OwnerUserId
)
AND EXISTS
(
SELECT
1/0
FROM dbo.Badges AS b
WHERE b.UserId = p.OwnerUserId
)
ORDER BY p.Score DESC
)
SELECT
u.DisplayName,
p.PostTypeId,
p.Score
FROM dbo.Users AS u
JOIN Posts AS p
ON p.OwnerUserId = u.Id
ORDER BY u.Reputation DESC;
And the plan for it looks like this:
All the work within the Common Table Expression is fenced by the top.
There are many times you can use this to your advantage, when you know certain joins or predicates can produce a very selective result.
Care Control
As a final note, just be really careful how you position your TOPs. They insert loads of semantic differences to the query.
If you don’t believe me, put a TOP in the wrong place and watch your results change dramatically.
Thanks for reading!
Going Further
If this is the kind of SQL Server stuff you love learning about, you’ll love my training. I’m offering a 75% discount to my blog readers if you click from here. I’m also available for consulting if you just don’t have time for that and need to solve performance problems quickly.
This post is obviously biased, because I loved SQLBits well before going this year. Everyone involved just kinda gets it, and makes things as nice and easy for presenters and attendees as possible.
Of course, this year was important for different reasons. I’ll spare you all the honey-drizzle about rebuilding the community. It’s an important group effort, but I’m not a group. I’m just me.
I want to be part of that group, and to do that there were things I had to personally accomplish:
Feeling like life can be normal again
Getting some of the humanity back into interactions
Some folks out there aren’t ready for that, or don’t need that, and that’s fine. I hope you get there eventually, if that’s something you want.
I do need that. It’s part of how I stay mentally healthy. Twitter is not a great way for me to do that, shockingly.
We’re All Clones
In two years of virtual-everything, and only online interactions, it sort of became easy to forget the people behind the words on your screen.
I burned out on virtual events really early on. It did not scratch the itch that teaching or attending in-person did.
If I’m not enjoying myself as a presenter, then the product you get as an attendee is going to suffer. That sucks for both of us.
And that’s why I’m jumping back onto in-person stuff.
Getting on stage and seeing a room full of Butts-In-Seats just does it for me. Getting out in the crowd and talking to people does it for me.
I’ll do that all day long. It doesn’t even feel like work.
Looking Forward
I’ve already booked flights and hotels for PASS in Seattle this November. I’d written that event off under the old ownership, for many obvious reasons.
That wasn’t a rash or unfair choice, either. After all, they made me pay to attend my own precon because Brent was listed as the primary speaker.
That sort of crap is how you lose a community fast.
I’m interested to see how Red Gate handles things, and hopeful that it’s as friction-free as possible, in all directions.
A well lubricated event is important.
Thanks for reading!
Going Further
If this is the kind of SQL Server stuff you love learning about, you’ll love my training. I’m offering a 75% discount to my blog readers if you click from here. I’m also available for consulting if you just don’t have time for that and need to solve performance problems quickly.
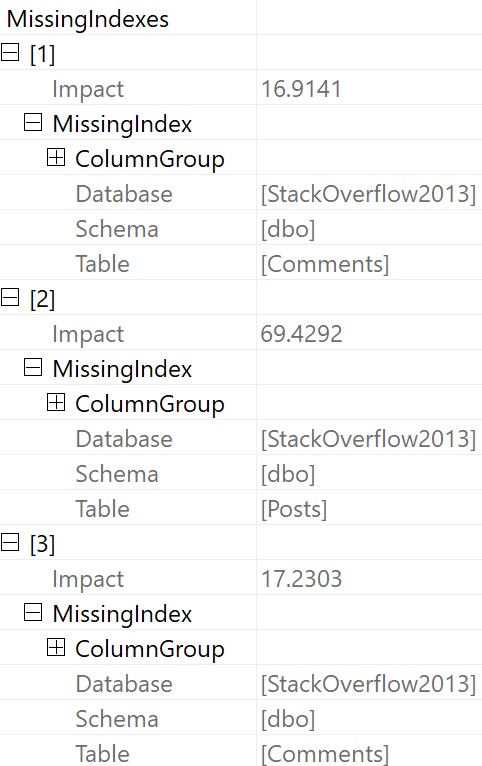
There’s a lot of stuff flying around in a query plan. Data and what not.
Sure, you can hover over operators and arrows and see some stuff, but if you really wanna see stuff — I mean REALLY wanna see stuff — you gotta get into the properties.
You can access those in two ways:
Hit F4 (not F5 again; you already suffered through that)
Right click on any operator in the query plan and hit Properties
And that, my dear friend, will unlock many mysteries in your query plans.
Start With Select
I think one of the most interesting places to start is with the root operator (select, insert, update, delete), because there’s so much in there.
Here’s an abridged list of things you can see from the properties of the root node of an Actual Execution Plan:
Compile metrics: CPU, duration, memory
Degree Of Parallelism
Detailed Memory Grant information
Stats Usage
Query Time Stats in CPU and duration (including UDF times)
Parameter compile and runtime values
Nonparallel Plan reasons
Set Options
Warnings
CPU thread usage
Wait Stats
There’s more in there too, but holy cow! All the stuff you can learn here is fantastic. You might not be able to solve all your problems looking here, but it’s as good a place to start as any.
Plus, this is where you can get a sense of just how long your query ran for, and start tracking down the most troublesome operators.
Follow The Time
I’ve said before that operator costs are basically useless, and you should be following the operator times to figure out where things get wonky.
For some operators, just looking at the tool tip is enough. For example, if you have an operator that piles up a bunch of execution time because of a spill, the spill details are right in front of you.
But other times, operator properties expose things that aren’t surfaced at the tool tip.
Skew Manchu
Take skewed parallelism, for example. There are no visual indicators that it happened (maybe there should be, but given the warnings we get now, I’m not sure I trust that summer intern).
But you know, it might be nice to know about stuff like this. Each thread is supposed to get an equal portion of the query memory grant, and if work is distributed unevenly, you can end up with weird, random performance issues.
This is something I almost always spot check in parallel plans. In a perfect world, duration would be CPU➗DOP. Life rarely ends up perfect, which is why it’s worth a look.
I To The O
You can also see I/O stats at the operator level, logical and physical. This is why I kinda laugh at folks who still use SET STATISTICS TIME, IO ON; — you can get that all in one place — your query plan.
You can interpret things in the same way, it’s just a little easier to chew.
Thanks for reading!
Going Further
If this is the kind of SQL Server stuff you love learning about, you’ll love my training. I’m offering a 75% discount to my blog readers if you click from here. I’m also available for consulting if you just don’t have time for that and need to solve performance problems quickly.
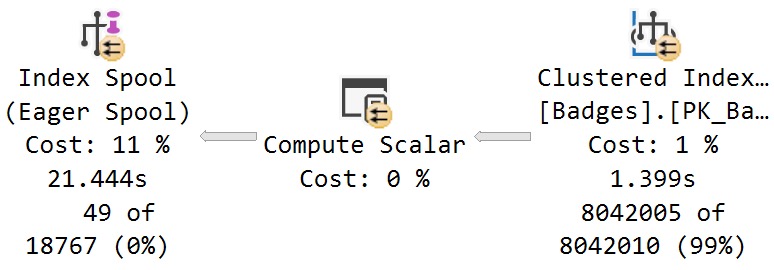
The good news is that SQL Server’s query plans will attempt to warn you about problems. The bad news is that most of the warnings only show up in Actual Execution Plans. The worse news is that a lot of the warnings that try to be helpful in Estimated Execution plans can be pretty misleading.
Certain of these are considered runtime issues, and are only available in Actual Execution Plans, like:
Spills to tempdb
Memory Grants
I’ve never seen the “Spatial Guess” warning in the wild, which probably speaks to the fact that you can measure Spatial data/index adoption in numbers that are very close to zero. I’ve also never seen the Full Update For Online Index Build warning.
Then there are some others like Columns With No Statistics, Plan Affecting Converts, No Join Predicate, and Unmatched Indexes.
Let’s talk about those a little.
Columns With No Statistics
I almost never look at these, unless they’re from queries hitting indexed views.
The only time SQL Server will generate statistics on columns in an indexed view is when you use the NOEXPAND hint in your query. That might be very helpful to know about, especially if you don’t have useful secondary indexes on your indexed view.
If you see this in plans that aren’t hitting an indexed view, it’s likely that SQL Server is complaining that multi-column statistics are missing. If your query has a small number of predicates, it might be possible to figure out which combination and order will satisfy the optimizer, but it’s often not worth the time involved.
Like I said, I rarely look at these. Though one time it did clue me in to the fact that a database had auto create stats disabled.
So I guess it’s nice once every 15 years or so.
Plan Affecting Converts
There are two of these:
Ones that might affect cardinality estimates
Ones that might affect your ability to seek into an index
Cardinality Affecting
The problem I have with the cardinality estimation warning is that it shows up when it’s totally useless.
SELECT TOP (1)
Id = CONVERT(varchar(1), u.Id)
FROM dbo.Users AS u;
Like I said, misleading.
Seek Affecting
These can be misleading, but I often pay a bit more attention to them. They can be a good indicator of data type issues in comparison operations.
Where they’re misleading is when they tell you they mighta-coulda done a seek, when you don’t have an index that would support a seek.
SELECT TOP (1)
u.Id
FROM dbo.Users AS u
WHERE u.Reputation = CONVERT(sql_variant, N'138');
Of course, without an index on Reputation, what am I going to seek to?
Nothing. Nothing at all.
No Join Predicate
This one is almost a joke, I think.
Back when people wrote “old style joins”, they could have missed a predicate, or something. Like so:
SELECT
c = COUNT_BIG(*)
FROM dbo.Users AS u,
dbo.Badges AS b,
dbo.Comments AS c
WHERE u.Id = b.UserId;
/*Oops no join on comments!*/
Except there’s no warning in this query plan for a missing join predicate.
But if we change the query to this, it’ll show up:
SELECT
u.Id
FROM dbo.Users AS u,
dbo.Badges AS b,
dbo.Comments AS c
WHERE u.Id = b.UserId;
/*Oops no join on comments!*/
But let’s take a query that has a join predicate:
SELECT TOP (1)
b.*
FROM dbo.Comments AS c
JOIN dbo.Badges AS b
ON c.UserId = b.UserId
WHERE b.UserId = 22656;
We still get that warning:
We still get a missing join predicate, even though we have a join predicate. The predicate is implied here, because of the where clause.
But apparently the check for this is only at the Nested Loops Join. No attempt is made to track pushed predicates any further.
If there were, the warning would not appear.
Unmatched Indexes
If you create filtered indexes, you should know a couple things:
It’s always a good idea to have the column(s) you’re filter(ing) on somewhere in the index definition (key or include, whatever)
If query predicate(s) are parameterized on the column(s) you’re filter(ing) on, the optimizer probably won’t choose your filtered index
I say probably because recompile hints and unsafe dynamic SQL may prompt it to use your filtered index. But the bottom line here is parameters and filtered indexes are not friends in some circumstances.
Here’s a filtered index:
CREATE INDEX
cigarettes
ON dbo.Users
(Reputation)
WHERE
(Reputation >= 1000000)
WITH
(SORT_IN_TEMPDB = ON, DATA_COMPRESSION = PAGE);
And here’s a query that should use it:
SELECT
u.Reputation
FROM dbo.Users AS u
WHERE u.Reputation >= 1000000;
BUUUUUUUUUUUUUUUT!
SQL Server warns us we didn’t. This is an artifact of Simple Parameterization, which happens early on in the Trivial Plan optimization phase.
It’s very misleading, that.
Warnings And Other Drugs
In this post we covered common scenarios when plan warnings just don’t add up to much of a such. Does that mean you should always ignore them? No, but also don’t be surprised if your investigation turns up zilch.
If you’re interested in learning more about spills, check out the Spills category of my blog. I’ve got a ton of posts about them.
At this point, you’re probably wondering why people bother with execution plans. I’m sort of with you; everything up to the actual version feels futile and useless, and seems to lie to you.
Hopefully Microsoft invests more in making the types of feedback mechanisms behind gathering plans and runtime metrics easier for casual users in future versions of SQL Server.
Thanks for reading!
Going Further
If this is the kind of SQL Server stuff you love learning about, you’ll love my training. I’m offering a 75% discount to my blog readers if you click from here. I’m also available for consulting if you just don’t have time for that and need to solve performance problems quickly.